Diagnosis of front and Wave(s)
|
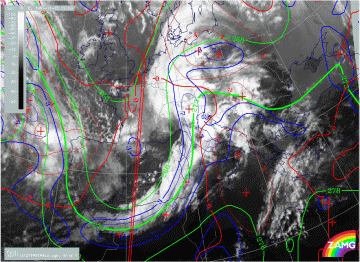
12 November 1997/12.00 UTC - Meteosat IR image; blue: thermal front parameter (TFP) 500/850 hPa, green: equivalent thickness 500/850
hPa, red: temperature advection - WA 1000 hPa
|
|
The front parameters in the image above describe a very well-pronounced Cold Front with high thickness gradients within the frontal cloud band. The biggest part of the cloud band, or at least the one west of Italy, is still under CA. This is of special interest for the intensification area over the Algerian coast where the jet crossing takes place. Although a quick inspection of the cloud configuration might indicate a Wave development there, the temperature advection field contradicts this idea with a maximum of CA instead.
|
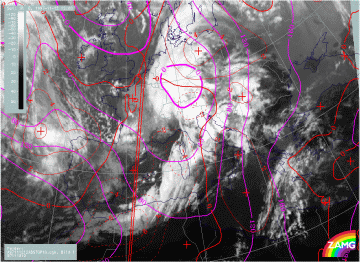
12 November 1997/12.00 UTC - Meteosat IR image; magenta: height contours 1000 hPa, red: temperature advection 1000 hPa
|
|
On the other hand, the TA field strongly supports the Wave situation over south Germany with an ideal connection between the surface minimum and the TA distribution: the zeroline of temperature advection runs through the centre of the surface low.
|
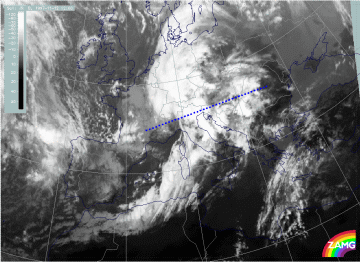
12 November 1997/12.00 UTC - Meteosat IR image; position of vertical cross section indicated
|
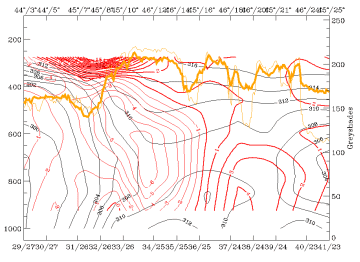
12 November 1997/18.00 UTC - Vertical cross section; black: isentropes (ThetaE), orange thin: IR pixel values, orange thick: WV pixel
values
|
This is supported in the vertical cross section immediately south of the area of interest showing two maxima of CA: one in the main frontal zone and another one in front of it corresponding to the area of Slovenia and Croatia.
|
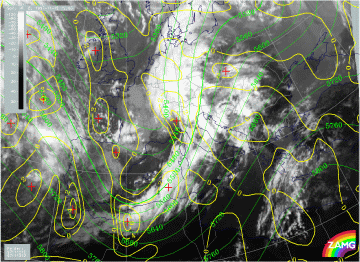
12 November 1997/12.00 UTC - Meteosat IR image; green: height contours 500 hPa, yellow: positive vorticity advection (PVA) 500 hPa
|
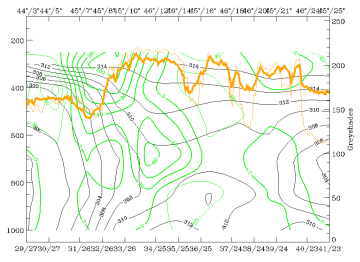
12 November 1997/18.00 UTC - Vertical cross section; black: isentropes (ThetaE), green thick: vorticity advection - PVA, green thin:
vorticity advection - NVA, orange thin: IR pixel values, orange thick: WV pixel values
|
But as already mentioned the cloud configuration contradicts this very classical distribution of parameters relevant for a Wave: the cloud spiral is on the rear side of the surface minimum. The only explanation which can be found for such a remarkable deviation is the influence of the processes going on in upper levels. The left image shows a pronounced trough at 500 hPa exactly at the rear of, and intensive PVA over, the cloud spiral. In the same cross section as the one discussed before PVA (right image) shows a completely different behaviour in the two different areas of maximal CA, while over Slovenia and Croatia decrease of PVA with height takes place over the frontal surface. A pronounced increase of PVA with height is recognizable, which is connected with the main cloudiness there.
