Overall situation and frontal diagnosis
|
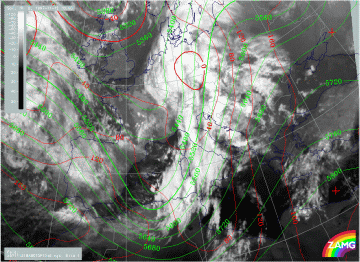
12 November 1997/18.00 UTC - Meteosat IR image; red: height contours 1000 hPa, green: height contours 500 hPa
|
|
The image above shows an unchanged situation between cloud configuration on the one hand and surface and upper level height on the other. The cloud spiral is not in agreement with the surface low but with a mesoscale upper level trough there. In the area of the front intensification between Algeria and Sardinia the upper level trough has become even more distinct.
|
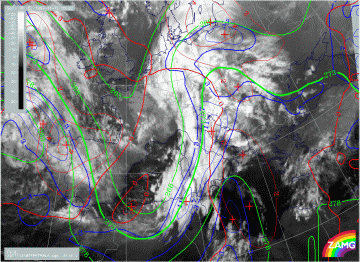
12 November 1997/18.00 UTC - Meteosat IR image; blue: thermal front parameter (TFP) 500/850 hPa, green: equivalent thickness 500/850
hPa, red: temperature advection - WA 500/1000 hPa
|
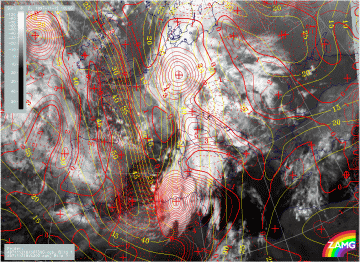
12 November 1997/18.00 UTC - Meteosat IR image; yellow: isotachs 300 hPa, red: vorticity advection 300 hPa
|
There is also no change in the frontal situation (left image). The Cold Front represented by the TFP has reached central Austria, central Slovenia and the westernmost coast areas of Croatia. As with six hours earlier the intensification area between Algeria and Sardinia does not represent a classical Wave situation because of the absence of any WA area there. But as can be seen from the right image a very distinct situation of a jet streak crossing takes place there, with the isotach maximum crossing the front nearly perpendicularly and the PVA maximum in the left exit region superimposed exactly on the frontal intensification area.
|
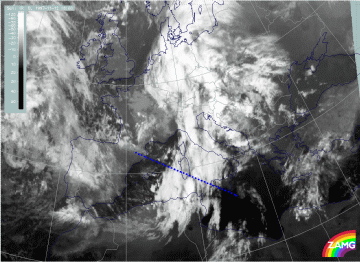
12 November 1997/18.00 UTC - Meteosat IR image; position of vertical cross section indicated
|
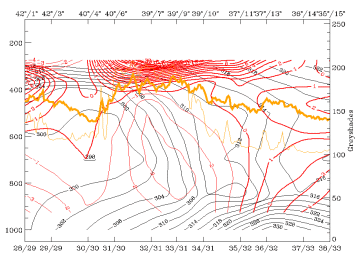
12 November 1997/18.00 UTC - Vertical cross section; black: isentropes (ThetaE), orange thin: IR pixel values, orange thick: WV pixel
values
|
This area of the front shows also interesting and characteristic behaviour in the vertical cross section. In the right image the isentropes (ThetaE) clearly show a frontal crowding zone inclined from approximately 39N/06E at 400 hPa downward to about 900 hPa at 38N/10E where it pushes at a boundary layer with surface-parallel isentropes representing a very warm air pillow. Another zone of inclined isentropes can be seen more in the east of this vertical cross section (around 13E) where the transition from CA to WA takes place. The nearly vertical inclination is not characteristic of a classical front, but it cannot be ignored that some air mass transitions are taking place there. This will be mentioned below in connection with the relative streams.
|
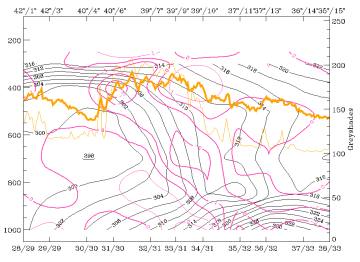
12 November 1997/18.00 UTC - Vertical cross section; black: isentropes (ThetaE), magenta thin: divergence, magenta thick: convergence,
orange thin: IR pixel values, orange thick: WV pixel values
|
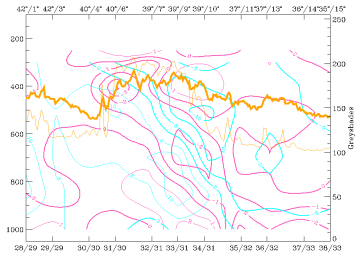
12 November 1997/18.00 UTC - Vertical cross section; black: isentropes (ThetaE), cyan thick: vertical motion (omega) - upward motion,
cyan thin: vertical motion (omega) - downward motion, magenta thin: divergence, magenta thick: convergence, orange thin: IR pixel
values, orange thick: WV pixel values
|
|
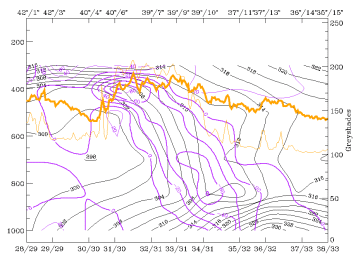
12 November 1997/18.00 UTC - Vertical cross section; black: isentropes (ThetaE), lilac: Q-Vector (normal component), orange thin: IR
pixel values, orange thick: WV pixel values
|
|
But there are also other important frontal features in this vertical cross section. The left and right top images show that the western frontal surface is connected with a distinct zone of convergence from the surface up to 400 hPa leading to upward motion on top of the frontal zone, especially pronounced in middle levels. Also the n-component of the Q-vector used as a frontogenetic parameter indicates pronounced frontogenesis (left image bottom). Both divergence and frontogenesis do not separate the boundary layer from the frontal layer.
