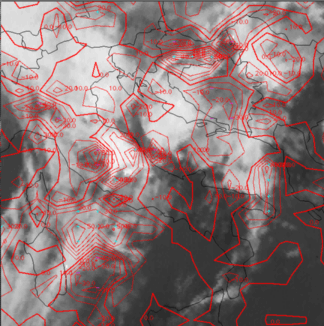
The period 12 November 11.00 - 12.00 UTC
Observational part
|
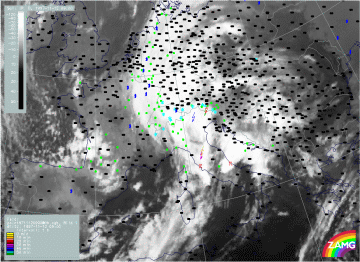
12 November 1997/09.00 UTC - Meteosat IR image; weather reports (green: rain and showers, blue: drizzle, cyan: snow, purple: freezing
rain, red: thunderstorm with precipitation, orange: hail, black: no actual precipitation or thunderstorm with precipitation)
|
|
The IR image superimposed by thunderstorm and lightning reports at 09.00 UTC may bridge the two phases (image above). The very white MCS extending from central Italy across the Adriatic Sea to the Croatian coast area has developed from the thickness ridge cell Th2 discussed in the chapter before (compare The period 12 November 05.00 - 07.00 UTC). The big white area of north-east Italy and west Austria accompanied by some lightning measurements has already been observed in the 06.00 UTC image as cellular area Th1. A cellular area at the Italian west coast east of Corsica is a new development and will be named Th3.
|
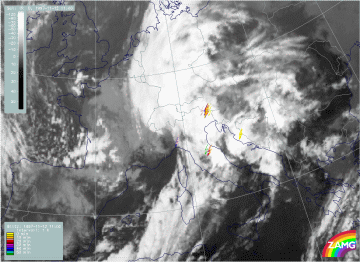
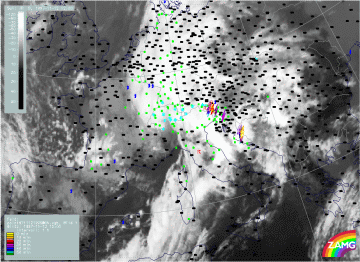
12 November 1997/11.00 UTC - Meteosat IR image; lightning reports
|
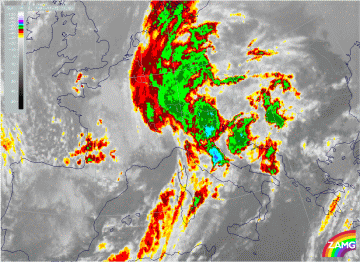
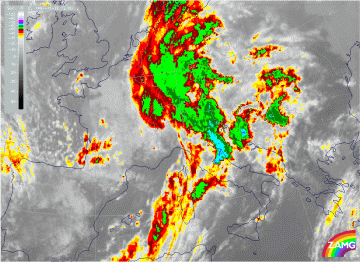
12 November 1997/11.00 UTC - Meteosat IR enhanced image
|
|
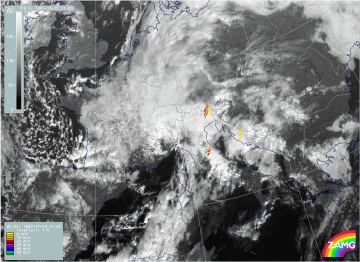
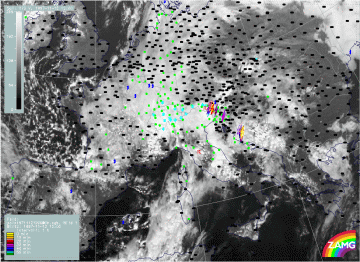
12 November 1997/11.00 UTC - Meteosat VIS image; lightning reports
|
|
Two hours later at 11.00 UTC the same three areas can be separated by their typical shape, their cold cloud tops and the lightning reports; also Th2 and Th3 show a distinct eastward movement.
|
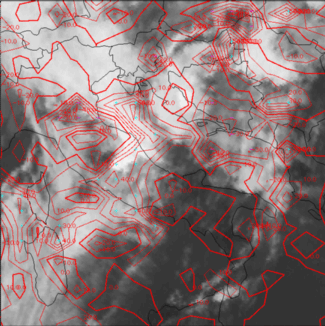
12 November 1997/09.00 UTC - Meteosat IR image; red: mean values of grey shades of cloud development and decay, cyan: cloud development
greater than 30 units, magenta: cloud decay greater than 20 units
|
|
Additional information about the development stage of these complexes can be summarized with help of the development image: only the new convective development over Italy (Th3) is in a developing stage with production of new cloudiness during the last hour; the MCS over the Adriatic Sea and Croatia (Th2) shows production of new cloudiness only in the downstream areas over Croatia which is the anvil area, while upstream over the Adriatic Sea dissolution of cloudiness has occurred. The MCS over North Italy (Th1) is rather steady without any important new development.
|
12 November 1997/12.00 UTC - Meteosat IR image; weather reports (green: rain and showers, blue: drizzle, cyan: snow, purple: freezing
rain, red: thunderstorm with precipitation, orange: hail, black: no actual precipitation or thunderstorm with precipitation)
|
12 November 1997/12.00 UTC - Meteosat IR enhanced image
|
|
12 November 1997/12.00 UTC - Meteosat VIS image; weather reports (green: rain and showers, blue: drizzle, cyan: snow, purple: freezing
rain, red: thunderstorm with precipitation, orange: hail, black: no actual precipitation or thunderstorm with precipitation)
|
|
Two hours later at 12.00 UTC the MCS over the Adriatic sea (Th2) has moved further eastward influencing more and more Croatia and Bosnia. The MCS over north Italy (Th1) has also moved eastward into Slovenia with several lightning and thunderstorm reports there. The new development over central Italy (Th3) has further intensified and fills now the whole northern part of the Adriatic Sea. This area is still under development (image below) with formation of new cloudiness in nearly the whole cloud area. The other two MCSs Th1 and Th2 are connected with areas of weak decay of cloudiness.
|
12 November 1997/12.00 UTC - Meteosat IR image; red: mean values of grey shades of cloud development and decay, cyan: cloud development
greater than 30 units, magenta: cloud decay greater than 20 units
|
|
Synoptic environment part
|
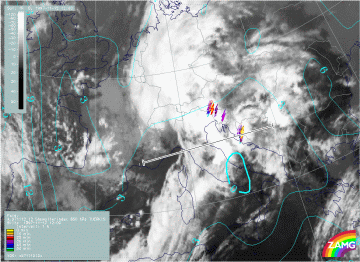
12 November 1997/12.00 UTC - Meteosat IR image; yellow: Showalter index 500/850 hPa, lightning reports; position of vertical cross
section indicated
|
|
Similar to the first period about six hours before, the Showalter index shows with values below 3 units a situation with high probability for thunderstorm development in an area from the western Mediterranean across Italy and the Adriatic Sea to the Balkan Peninsula. The problem is that thunderstorm complexes do not develop everywhere in this large area but only where special conditions exist. As these small scale conditions cannot be filtered out from the larger scale material, the observational part takes over the task of thunderstorm identification.
|
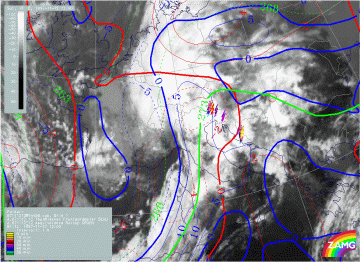
12 November 1997/12.00 UTC - Meteosat IR image; blue: thermal front parameter (TFP) 500/850 hPa, green: equivalent thickness 500/850
hPa, red: temperature advection 1000 hPa, yellow: positive vorticity advection (PVA) 500 hPa, lightning reports
|
|
The image above shows the frontal and pre-frontal situation. The MCS over Croatia and Bosnia (Th2) is still within the thickness ridge in front of the Cold Front. On the contrary, the northern MCS over north Italy (Th1) exists within the frontal cloud band, and the new MCS under development over the northern Adriatic Sea (Th3) is close to the TFP but more in front of it than the northern MCS Th1. The distribution of the TA field in relation to the three MCSs is different and can more easily be discussed with the vertical cross sections.
|
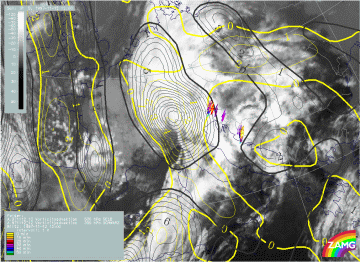
12 November 1997/12.00 UTC - Meteosat IR image; yellow: positive vorticity advection (PVA) 500 hPa, black: positive vorticity advection
(PVA) 300 hPa, lightning reports
|
|
Despite the northern MCS Th1, which is within the frontal cloud band, the two other MCSs are not in any, or any important, relation to PVA maxima at height levels (image above).
|
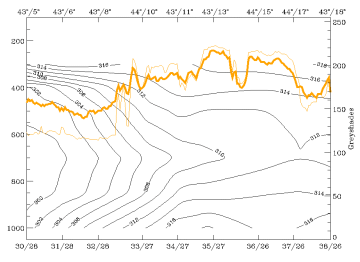
12 November 1997/12.00 UTC - Vertical cross section; black: isentropes (ThetaE), orange thin: IR pixel values, orange thick: WV pixel
values
|
|
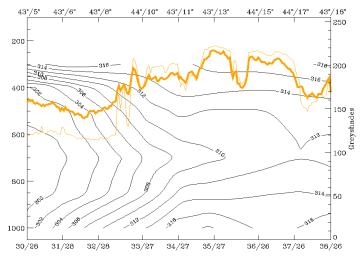
The vertical cross section used here crosses the two southern MCSs: the one over Croatia and Bosnia which is in a highly developed stage and the one over the Adriatic Sea which is in a development stage (compare the first image in the synoptic environment part). The image above contains a zone of downward inclined isentropes (from 550 hPa to about 700 hPa) accompanying the cold front; the left maximum in the IR and WV signals around 44N/10E represents the frontal cloudiness. Below 700 hPa there is a thick superadiabatic layer within the frontal surface as well as in front of it. The two other maxima in the satellite signals (between 43N/11E and 44N/14E as well as at 44N/16E) indicate the two MCSs Th3 and Th2. From the distribution of isentropes in this vertical cross section it seems to be much clearer that the developing MCS Th3 over the Adriatic Sea forms in front of and not at the frontal surface.
|
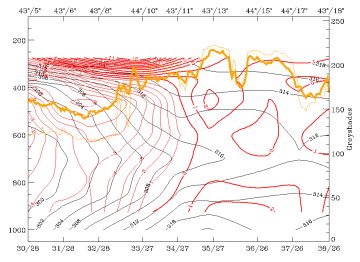
12 November 1997/12.00 UTC - Vertical cross section; black: isentropes (ThetaE), red thin: temperature advection - CA, red thick:
temperature advection - WA, orange thin: IR pixel values, orange thick: WV pixel values
|
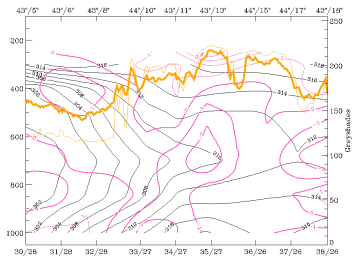
12 November 1997/12.00 UTC - Vertical cross section; black: isentropes (ThetaE), magenta thin: divergence, magenta thick: convergence,
orange thin: IR pixel values, orange thick: WV pixel values
|
|
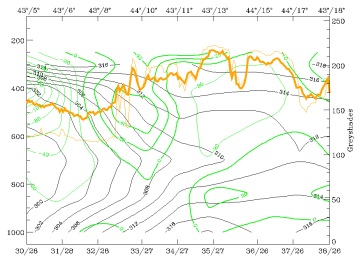
12 November 1997/12.00 UTC - Vertical cross section; black: isentropes (ThetaE), green thick: vorticity advection - PVA, green thin:
vorticity advection - NVA, orange thin: IR pixel values, orange thick: WV pixel values
|
|
As before, typical features in the relevant fields, as well as similarities and differences, are summarized:
- A thick superadiabatic layer for both MCSs;
- WA in low layers (left image top) but CA above in the middle troposphere which is a classical condition for an instability for both MCSs;
- Notable convergence (right image top) in a thick layer which takes place in front of the frontal zone;
- No PVA increase with height in connection with the two MCSs (left image bottom).
|
12 November 1997/12.00 UTC - Vertical cross section; black: isentropes (ThetaE), orange thin: IR pixel values, orange thick: WV pixel
values
|
|
For the relative streams involved the following isentropic surfaces have been selected:
- 310K which is on top of the frontal surface and can be followed from 300 hPa downward to about 700 hPa for the developing MCS Th3 over the Adriatic Sea;
- 312K, a surface which is downward inclined between 300 and 600 hPa and is relevant for both MCSs Th2 and Th3.
|
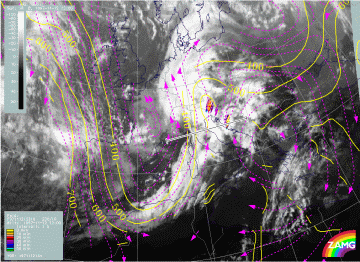
12 November 1997/12.00 UTC - Meteosat IR image; magenta: relative streams 310K - system velocity 230° 10 m/s, yellow: isobars,
lighting reports; position of vertical cross section indicated
|
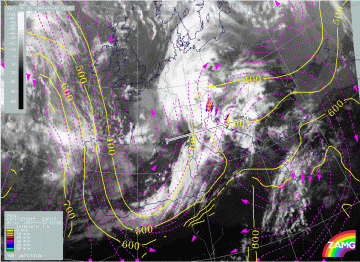
12 November 1997/12.00 UTC - Meteosat IR image; magenta: relative streams 312K - system velocity 230° 10 m/s, yellow: isobars,
lighting reports; position of vertical cross section indicated
|
On the 310K surface (left image) the origin of the relative stream involved in the Adriatic MCS Th3 cannot clearly be determined. It might already be the relative stream from behind the cold front. In the area of the eastern MCS Th2 the Warm Conveyor Belt seems to be involved.
On the 312K surface (right image) the relative stream clearly originates from the rear of the Cold Front and represents the upper relative stream there.
