Front Intensification by Jet Crossing
|
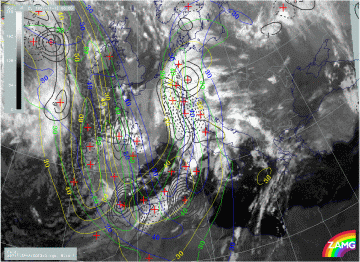
12 November 1997/06.00 UTC - Meteosat IR image; yellow: isotachs 300 hPa 06.00 UTC, green: height contours 1000 hPa 12.00 UTC, blue:
height contours 1000 hPa 18.00 UTC, black solid: positive vorticity advection (PVA) 300 hPa 06.00 UTC, black dashed: positive vorticity
advection (PVA) 300 hPa 12.00 UTC, black solid: positive vorticity advection (PVA) 300 hPa 18.00 UTC
|
|
The image above shows the propagation of the jet streak and the related PVA maximum in the left exit region in 300 hPa. The jet streak itself moves from Portugal to the Spanish east coast while the PVA maximum can be followed along the African coast to Tunisia at 18.00 UTC. This has rather dramatic consequences for the frontal cloud band.
|
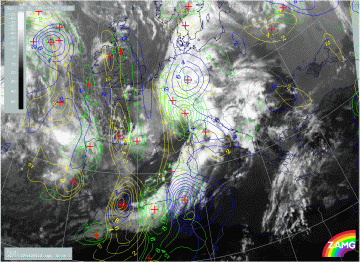
12 November 1997/12.00 UTC - Meteosat IR image; yellow: positive vorticity advection (PVA) 300 hPa 06.00 UTC, green: positive vorticity
advection (PVA) 300 hPa 12.00 UTC, blue: positive vorticity advection (PVA) 300 hPa 18.00 UTC
|
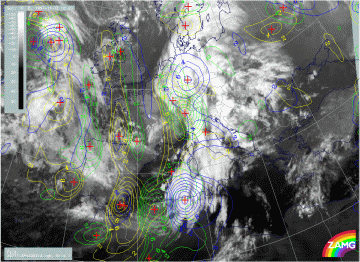
12 November 1997/18.00 UTC - Meteosat IR image; yellow: positive vorticity advection (PVA) 500 hPa 06.00 UTC, green: positive vorticity
advection (PVA) 500 hPa 12.00 UTC, blue: positive vorticity advection (PVA) 500 hPa 18.00 UTC
|
In the left image the white cellular cloudiness developed in the centre of the PVA maximum at the Algerian coast, and six hours later (right image) a Wave - like bulge has developed between the African coast and Sardinia, to where the PVA has moved.


