The period 12 November 05.00 - 07.00 UTC
Observational part
|
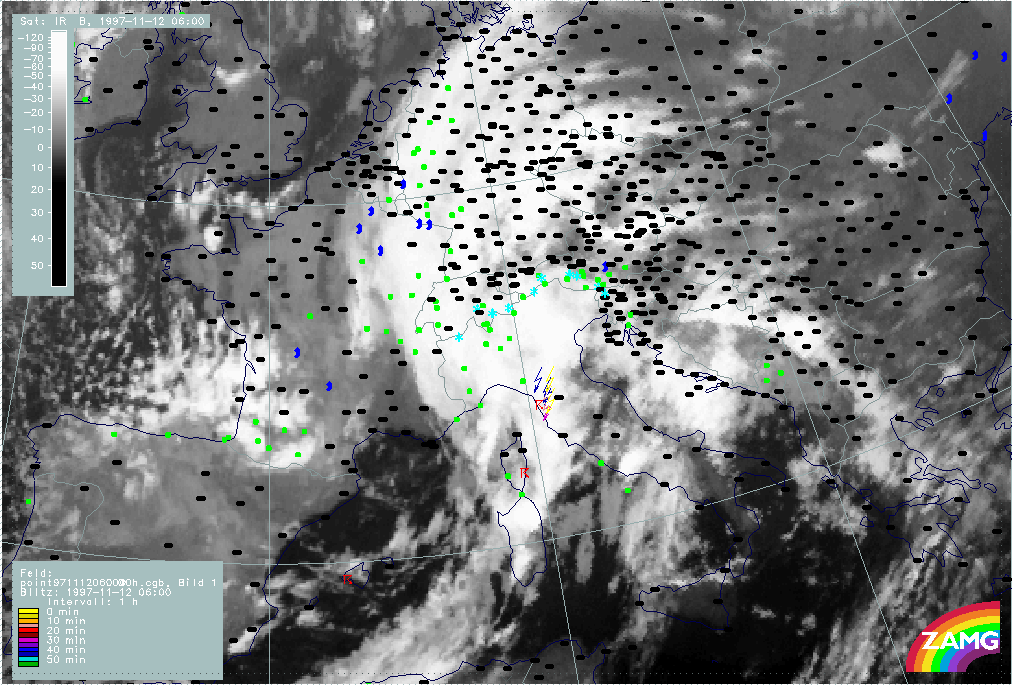
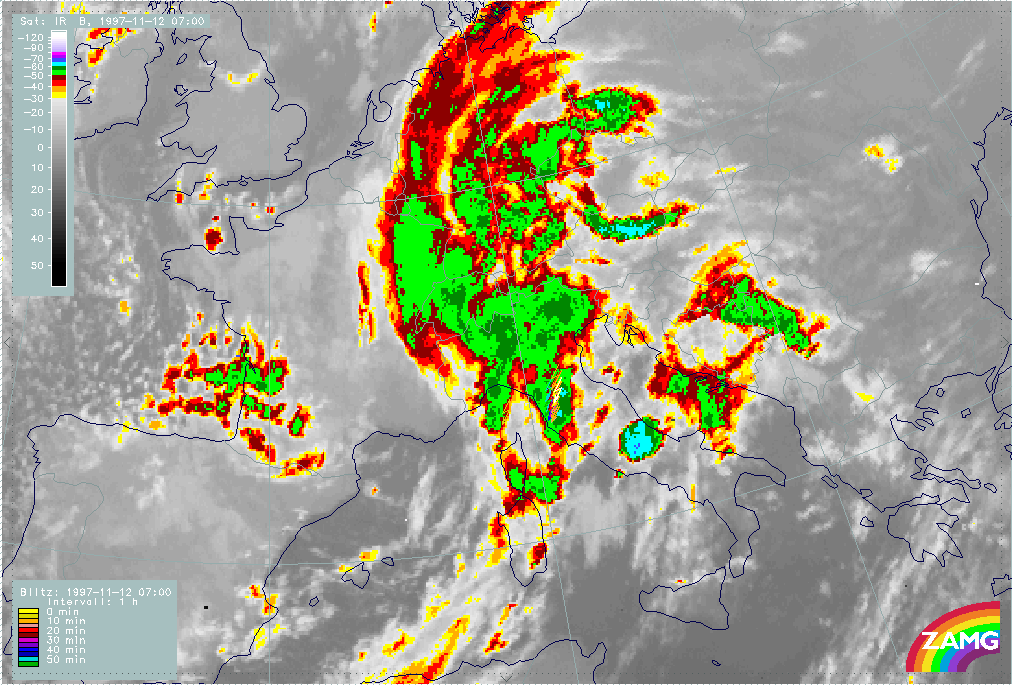
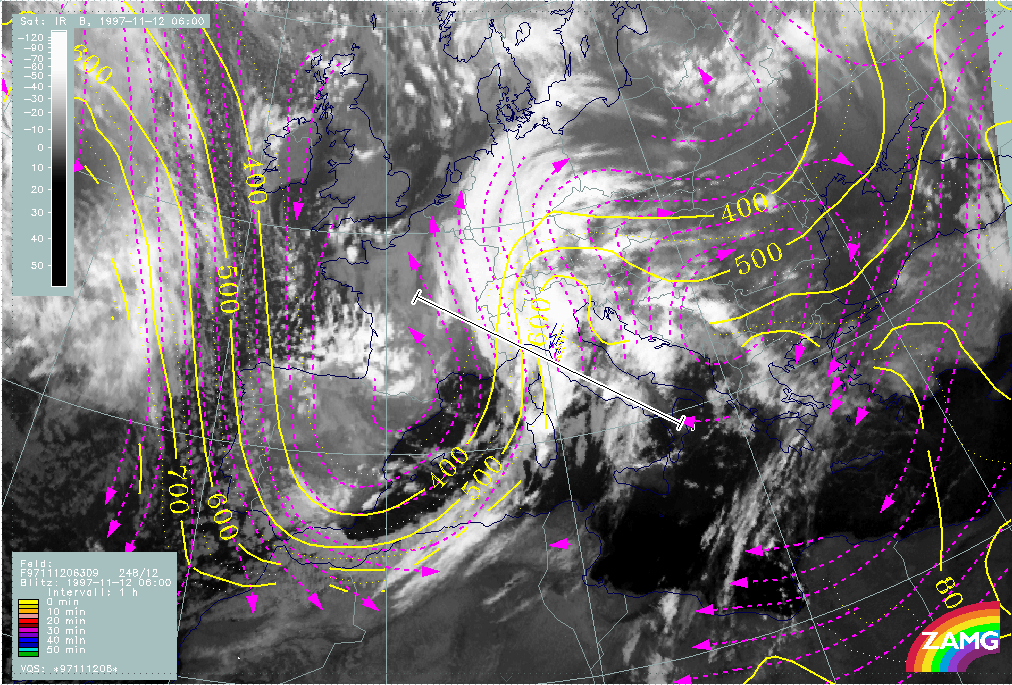
12 November 1997/06.00 UTC - Meteosat IR image; weather reports (green: rain and showers, blue: drizzle, cyan: snow, purple: freezing
rain, red: thunderstorm with precipitation, orange: hail, black: no actual precipitation or thunderstorm with precipitation)
|
|
|
The image above shows two thunderstorm reports in an area between Corsica and Italy supplemented by lightning measurements in the Italian area during the last hour (yellow are the latest ones). These reports appear close to the leading parts of the Cold Front cloud band where there are some cellular structures which will be named Th1.
|
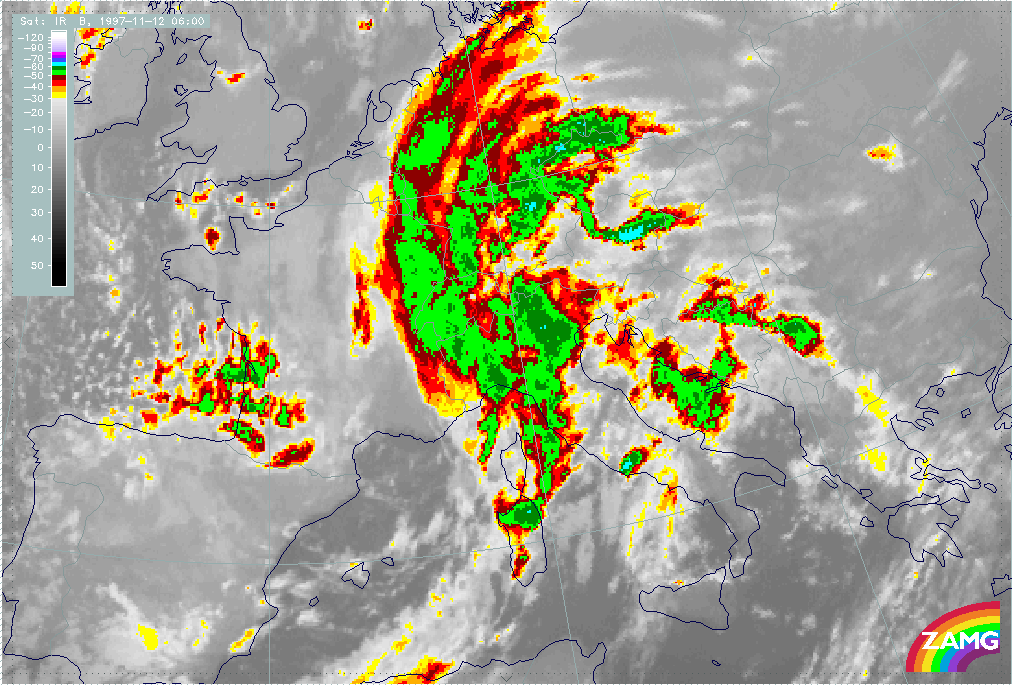
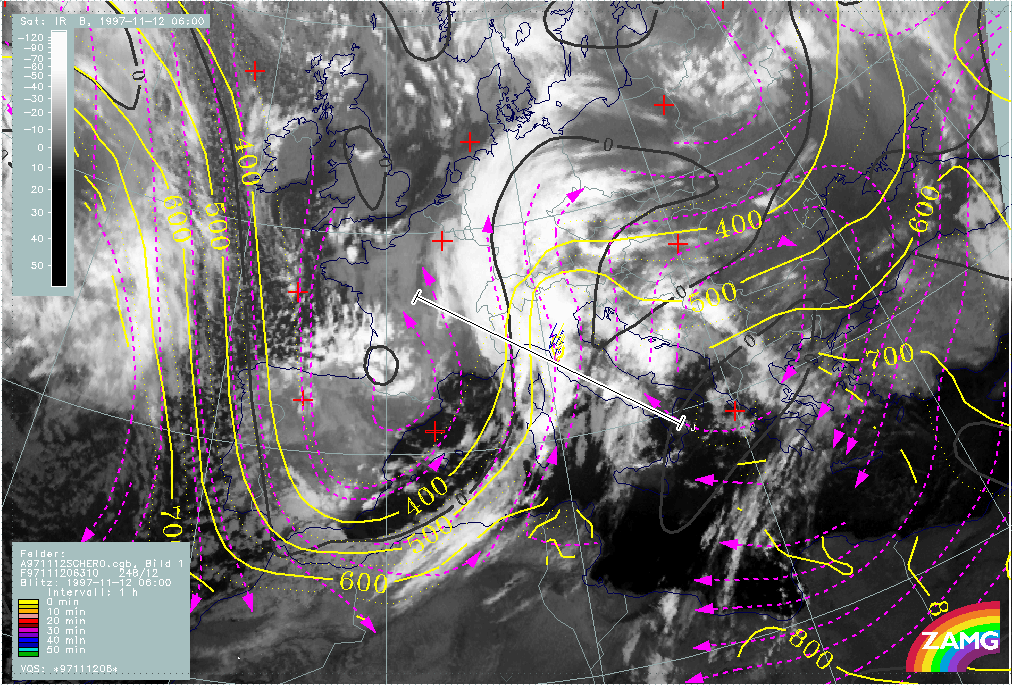
12 November 1997/06.00 UTC - Meteosat IR enhanced image
|
|
|
A visual inspection of images with help of an appropriate enhancement (image above) would also draw attention to the cells in the northern part of Sardinia and a very typical structure at the Italian coast around 41.5N/13E which has the coldest cloud tops of those mentioned. There are no lightning reports from this cell as it is not within the range of the lightning device. This cell is named Th2.
|
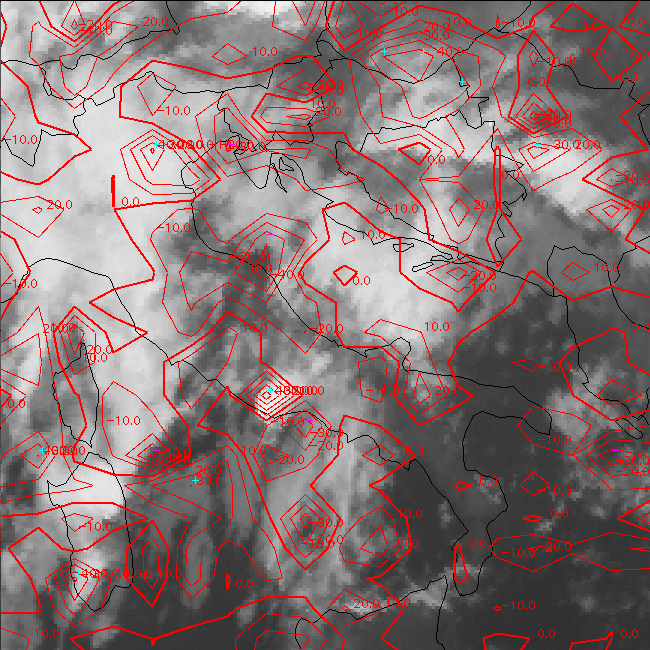
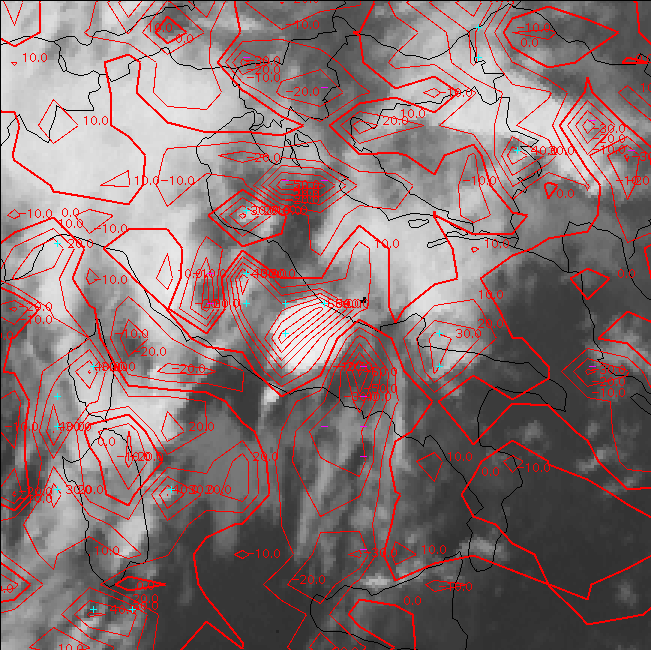
12 November 1997/06.00 UTC - Meteosat IR image; red: mean values of grey shades of cloud development and decay, cyan: cloud development
greater than 30 units, magenta: cloud decay greater than 20 units
|
|
|
The investigation of the development image can be seen in the image above. The 06.00 UTC IR image is superimposed by lines which represent mean development during the last hour. Positive values are cloud development, negative values cloud decay, the plus and minus signs enhance areas where an empirically determined threshold is reached. In the cellular area between Corsica and the Italian coast, which is accompanied by thunderstorm reports and can therefore be regarded as relatively weather active, a fully developed stage has already been reached without any further development during the last hour; on the contrary some decay has already taken place over Corsica and also over the central parts of the Italian mainland.
Appreciable development has taken place in the last hour in the area of the southern Italian cell Th2 which is therefore a new developing system (although not accompanied by weather reports because of its scale and distance).
Some new development happened also over north Italy (around 45N/11E) which is not supported by lightning reports yet. Over Slovenia and Croatia neither typical convective structures, nor very cold temperatures, nor appreciable development take place. The only area where the threshold for intensive development is exceeded is an extended area over east Croatia, which can be classified as high lee cloudiness.
|
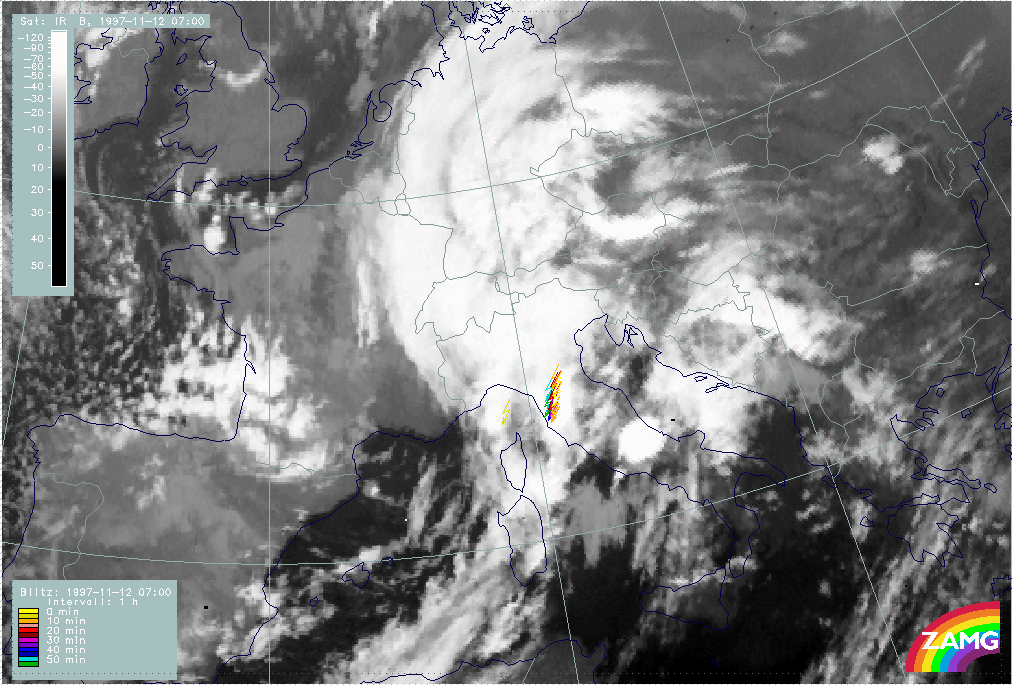
12 November 1997/07.00 UTC - Meteosat IR image; lightning reports
|
12 November 1997/07.00 UTC - Meteosat IR image; red: mean values of grey shades of cloud development and decay, cyan: cloud development
greater than 30 units, magenta: cloud decay greater than 20 units
|
|
|
|
|
|
12 November 1997/07.00 UTC - Meteosat IR enhanced image
|
|
The images above show the situation for the next hour 06.00 - 07.00 UTC. The cellular area Th1 has moved eastward and is situated over Italy now. It is still accompanied by lightning reports over Italy (left image top around 44N/11E) although no notable new development of cloudiness has happened there (right image top). Pronounced new development has happened within the cell over middle Italy Th2 (42N/14E). Looking at the enhanced image (left image bottom) the coldest tops appear in the cell just mentioned but also in some smaller parts of the northern cellular area where the lightning reports come from.
In most of Slovenia and Croatia cloud dissolution prevails, while the high Lee Cloud in the east has strengthened there.
Synoptic environment part
From all observations available, two areas of convective and thunderstorm development could be selected as being of main interest: the one between Corsica and Italy (Th1) which is already well developed, and the cell over Italy south of it (Th2), which intensifies appreciably during this investigation period.
|
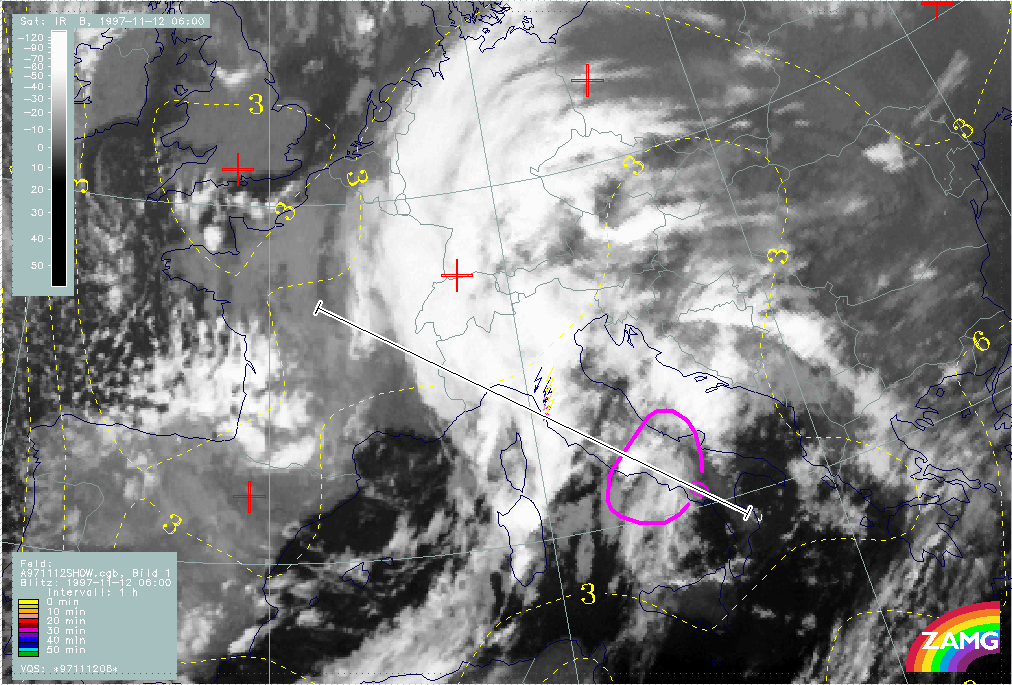
12 November 1997/06.00 UTC - Meteosat IR image; yellow: Showalter index 500/850 hPa, magenta: zero line of Showalter index 500/850 hPa,
lightning reports; position of vertical cross section indicated
|
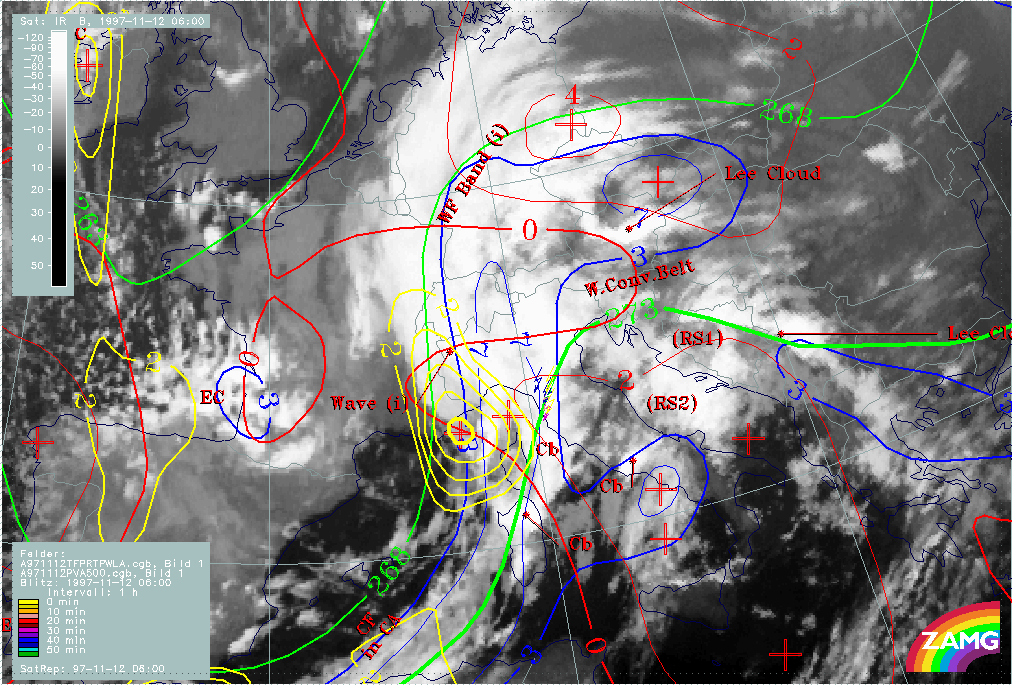
12 November 1997/06.00 UTC - Meteosat IR image; blue: thermal front parameter (TFP) 500/850 hPa, green: equivalent thickness 500/850
hPa, red: temperature advection - WA 1000 hPa, yellow: positive vorticity advection (PVA) 500 hPa, lightning reports
|
|
|
The Showalter index (left image) indicates the whole area from Spain across Italy to east Austria and Slovakia as an area of high probability for thunderstorm development (Showalter index<3). But as can be seen from the right image there are completely different synoptic environmental conditions for the two convective areas under consideration. The northern one (Th1) appears at the leading edge of the Cold Front cloud band close to the frontal line (the TFP) within a Wave area and therefore under WA. The southern one (Th2) develops also under WA but far away from the frontal situation in the thickness ridge where the most unstable area is indicated by negative Showalter values. Notable PVA maxima are connected to the Wave but not in agreement with the Cb developments.
|
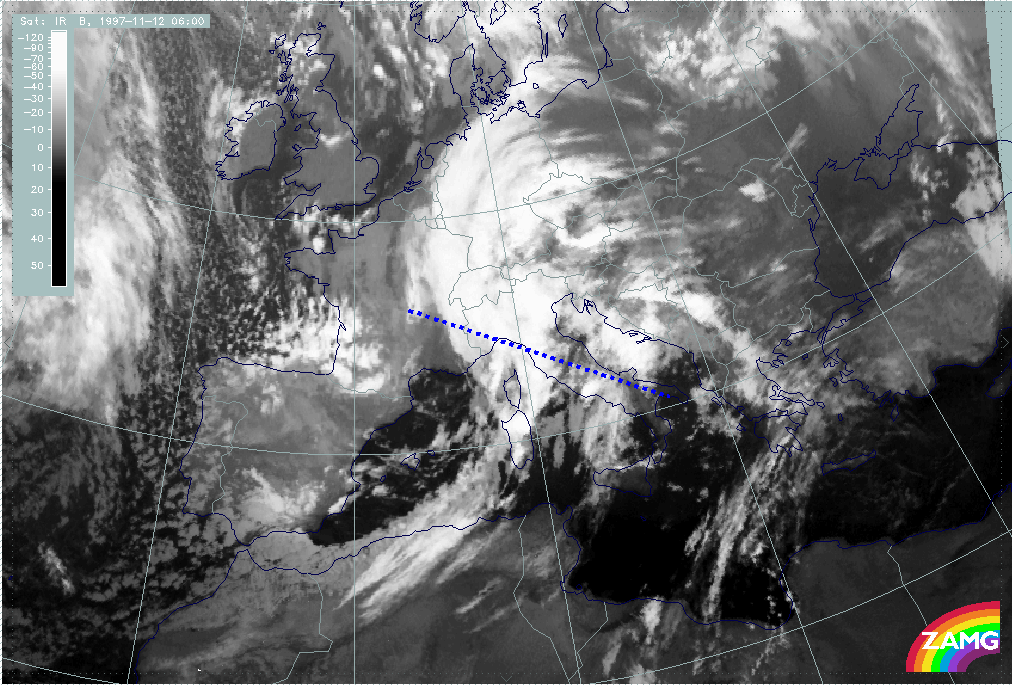
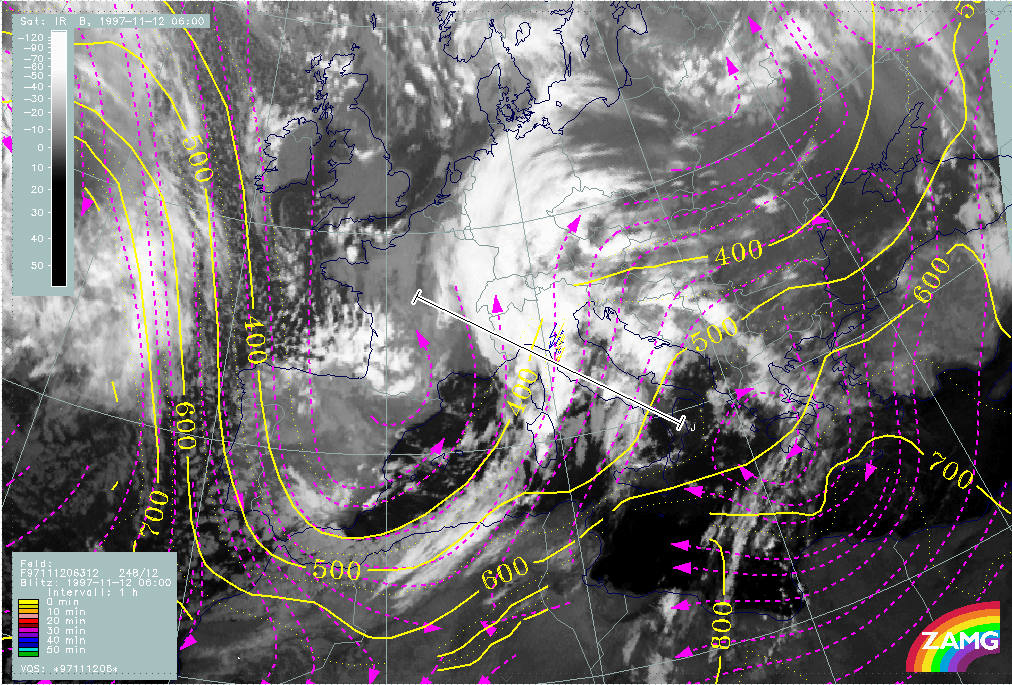
12 November 1997/06.00 UTC - Meteosat IR image; position of vertical cross section indicated
|
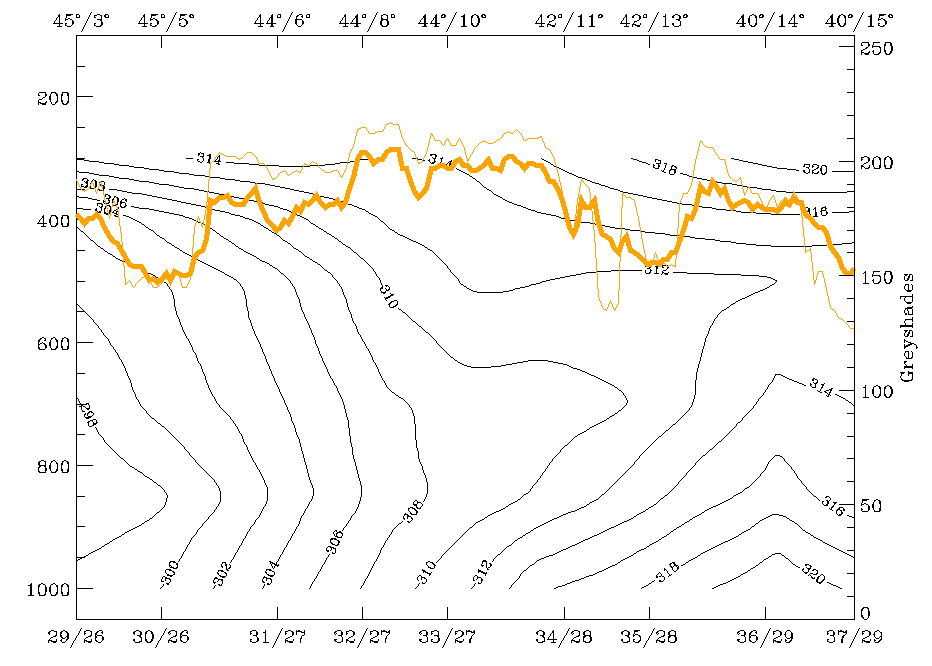
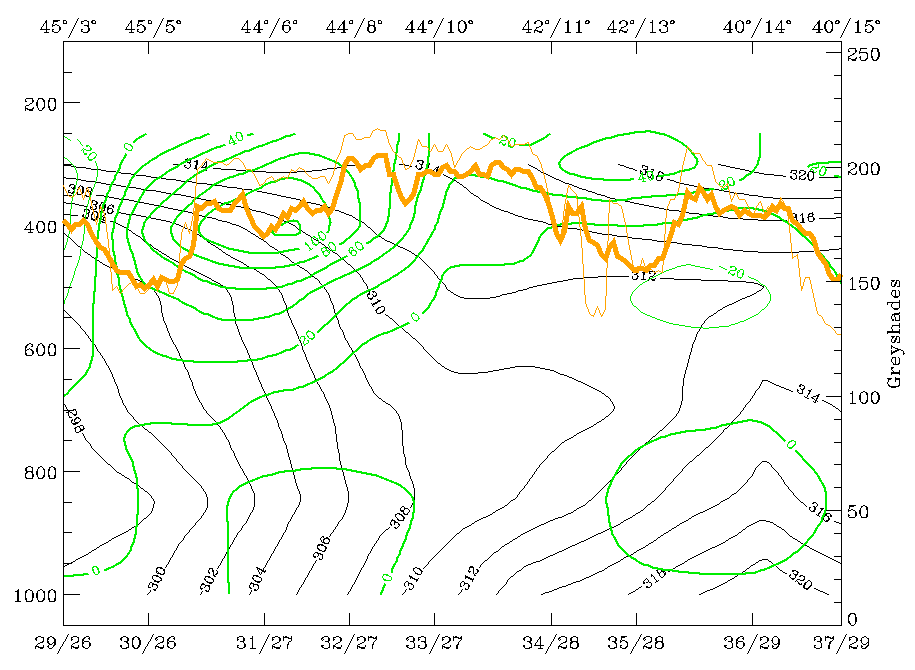
12 November 1997/06.00 UTC - Vertical cross section; black: isentropes (ThetaE), orange thin: IR pixel values, orange thick: WV pixel
values
|
|
|
The vertical cross section indicated in the left image above has been chosen with respect to the two convective areas Th1 and Th2; consequently it is not perpendicular to the frontal surface and the isentropes show a less pronounced gradient (right image). The frontal thunderstorm area (Th1) corresponds to the IR and WV peak at about 44N/10E, the single cell in the thickness ridge (Th2) is represented by the IR and WV peak close to 42N/13E.
|
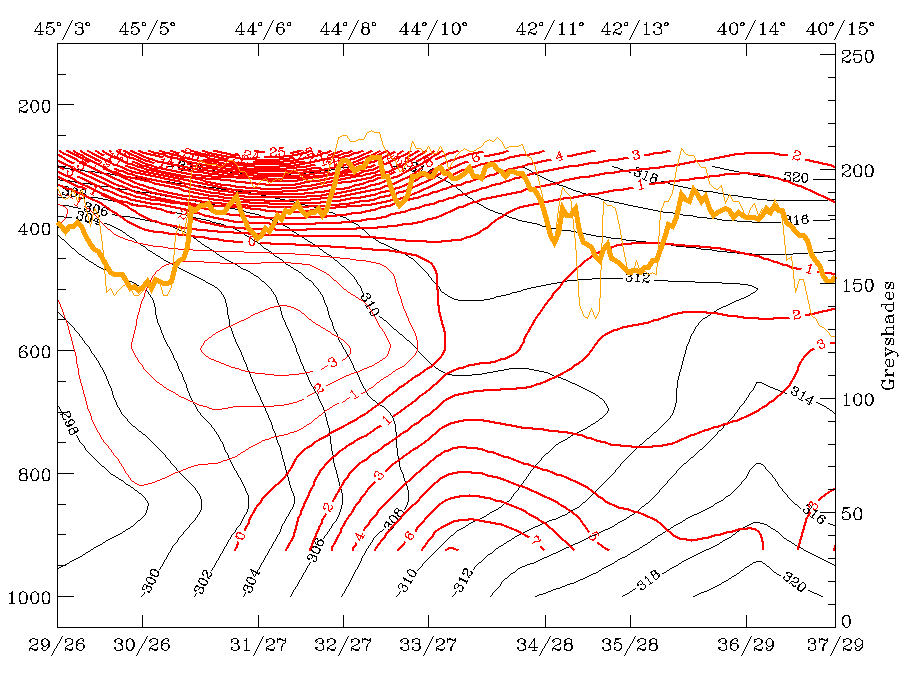
12 November 1997/06.00 UTC - Vertical cross section; black: isentropes (ThetaE), red thin: temperature advection - CA, red thick:
temperature advection - WA, orange thin: IR pixel values, orange thick: WV pixel values
|
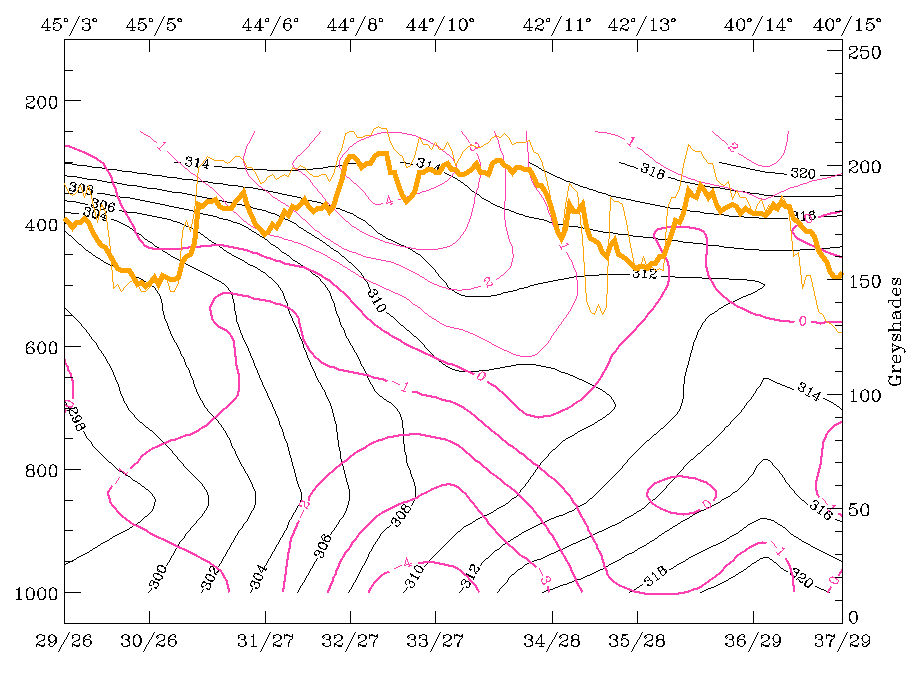
12 November 1997/06.00 UTC - Vertical cross section; black: isentropes (ThetaE), magenta thin: divergence, magenta thick: convergence,
orange thin: IR pixel values, orange thick: WV pixel values
|
|
|
|
|
|
12 November 1997/06.00 UTC - Vertical cross section; black: isentropes (ThetaE), green thick: vorticity advection - PVA, green thin:
vorticity advection - NVA, orange thin: IR pixel values, orange thick: WV pixel values
|
|
There are a lot of similarities between the two areas but also differences in the details:
- A rather thick superadiabatic layer which is more extended for the thickness ridge cell Th2;
- WA (left image top) but with differences in the vertical TA distribution: the frontal thunderstorm area Th1 is accompanied by WA below and CA above, while for the thickness ridge thunderstorm Th2, WA exists in the whole troposphere;
- Notable convergence (right image top) which takes place within but also in front of the frontal zone; for the frontal thunderstorm Th1 convergence is more intensive in the low layer and there is divergence above 600 hPa (which is the typical frontal circulation cell) while convergence is reaching into higher levels for the thickness ridge cell Th2;
- Increase of PVA with height (left image bottom).
For the relative streams involved the following isentropic surfaces have been selected:
- 309K which can be inspected for the frontal surface from 300 hPa downward to about 650 hPa at 44N/10E which is the area of the frontal thunderstorms Th1. For the thickness ridge cell Th2 this surface is not relevant;
- 310K which is still on top of the frontal surface and can be inspected from 300 hPa downward to about 700 hPa at 42N/13E which is the area of the thickness ridge cell Th2;
- 312K an undisturbed surface which is downward inclined between 300 and 500 hPa.
|
12 November 1997/06.00 UTC - Meteosat IR image; magenta: relative streams 309K - system velocity 248° 12 m/s, yellow: isobars,
lighting reports; position of vertical cross section indicated
|
12 November 1997/06.00 UTC - Meteosat IR image; black: shear vorticity 300 hPa, magenta: relative streams 310K - system velocity
248° 12 m/s, yellow: isobars, lighting reports; position of vertical cross section indicated
|
|
|
|
|
|
12 November 1997/06.00 UTC - Meteosat IR image; magenta: relative streams 312K - system velocity 248° 12 m/s, yellow: isobars,
lighting reports; position of vertical cross section indicated
|
|
On the 309K surface (left image top) a rising Warm Conveyor Belt can be recognized in the area of the frontal cells Th1; at 310K (right image top) the limiting streamline between the warm conveyor belt and the upper relative stream from behind crosses the cellular area Th1; and at 312K (left image bottom) the frontal thunderstorms Th1 are completely under the upper relative stream from behind. As the upper relative stream is somewhat cooler and drier than the Warm Conveyor Belt, an unstable stratification of the troposphere develops there.
The thickness ridge cell Th2 appears on this surface within the Warm Conveyor Belt.