Synoptic situation
From the synoptic chart of July 30th 2005 a frontal system can be observed over Central Europe. From satellite this frontal system is however not so clear. Allthough the occluded part is quite enhanced and is found over the Baltic Sea, Danmark and the Northsea, the Cold and Warm Front are not easily identified. As the case continues this will change especially at the prefrontal side of the cold front. Long line of convective cells emerge and stretches all the way from the Balitic States into Northern Italy. In the following chapters the different Meteosat 8 satellite images and the RGB composites are described. To reflect the synoptic scale situation and to picture the convergence that occurs near the surface also the Geopotential height at 1000 and 500 hPa are reflected. The case was associated to relatively large amounts of rainfall. This is pictured when the surface observations are superimposed on Meteosat 8 IR10.8 images.
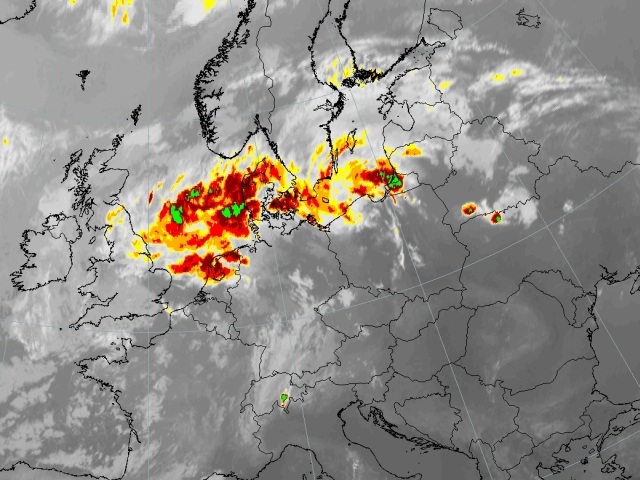
30 July 2005/06.00 UTC - Meteosat 8 Enhanced IR10.8 image
|

|
Meteosat 8 IR10.8μm: time sequence:
The first chapter dealing with the synoptic situation describes the convective developments seen over Central Europe using plain Meteosat infrared 10.8 μm. The channel is appropiate as it pictures the icing of high clouds quite clearly. In a sequence of 1 hour the relevant satellite image is presented and described.
Enhanced Meteosat 8 IR10.8μm: time sequence
In this chapter again Meteosat 8 infrared 10.8 μm is shown, but the images have been artificially colour enhanced. This will improve the discrimination of where most icing is taking place during the several convective stages. In a sequence of 1 hour the satellite images are presented and described.
Meteosat 8 WV6.2μm: time sequence
The chapter presents the several convective developments over Central Europe using Meteosat 8 WV6.2 channel. The channel is suitable as it gives an idea of the upper tropospheric humidity (UTH) and gives a view of the upper air dynamics. For the 30th and 31st July hourly images are presented.
Meteosat 8 composite WV6.2μm-WV7.3μm; IR3.9μm-IR10.8μm; NIR1.6μm-VIS0.6μm: selected time sequence
In this chapter the convective developments over Central Europe is studied using the so-called "severe convection RGB". On red the brightness temperature difference (BTD) of the two water vapour channels 6.2 and 7.3. On green the BTD of the infrared channels 3.9 and 10.8 and on blue the BTD of the two visible channels 1.6 and 0.6, respectively, are pictured.
Meteosat 8 composite WV6.2μm-WV7.3μm; IR9.7μm-IR10.8μm; WV6.2iμm: time sequence
In this chapter the convection is studied using the "Airmass RGB". Unlike the "Severe Convection RGB" discussed previously this RGB does not use any visible channels making it thus also suitable to detect nighttime convection. The receipe of this RGB is that on red the brightness temperature difference (BTD) of the two water vapour channels 6.2 and 7.3 is pictured. On blue the BTD of the infrared channels 9.7 (Ozone channel) and 10.8 and finally on green WV channel 6.2. Using this channel combination different airmass are recognised. Polar and Tropical Airmass are pictured in blue and green, resp. The WV dark stripes discussed previously are pictured in red.
Meteosat 8 IR10.8 and Geopotential Height 1000 hPa.: time sequence
In the following chapter the cloud configurations seen in satellite images are related to the basic field of surface pressure represented by geopotential height at 1000 hPa. 6-hourly sequences are shown.
Meteosat 8 IR10.8 and Geopotential Height 300 hPa.: time sequence
In this chapter the cloud configurations seen in satellite images are related to the basic field of the upper level height at 300 hPa., 6-hourly sequences are shown.
Meteosat 8 IR10.8 and Wind at 925 hPa: time sequence
The convection as a result of the rising motion from the surface are pictured using a LAM model (Aladin), in this case 925 hPa.
Meteosat 8 IR10.8 and Surface observations: time sequence
In the following set of images observations of rain, hail and thunderstorms are related to the cloud configurations seen in satellite images. The images are in 3-hourly sequences.
Summary of the investigations in this chapter
The set of satellite images showed some severe convective development during the second half of July 30th as a long prefrontal convergence line forms that stretched from the Baltic States over Poland and Austria into Northern Italy. This form of convergence was clearly connected to the diurnal cycle as later that day as night set in, most of the cells dissolved. By that time the convection embedded within the cold front had already taken over and a large MCS was seen covering Poland. Further north a second large convective scale system covered the Baltic States bringing with it rain. The cell slowly moved into Russia and died out overnight. The set of Airmass images and WV6.2 images showed that most of the convective cells developed on the boundary of dark stripes.
The Severe convection RGB showed the contents of the cells by the different colours which tell whether the cell is consist of large ice particle or small ice particles. This made it easier to discriminate if the cells would further enhance or not.
In the next chapter the development will be studied using derived parameters.