Droughts, Floods and Landslides - Event Week 2014

EUMeTrain organised an event week with presentation related to "Droughts, Floods and Land Slides" from 1st to 5th December 2014. During this event week, an overview on large scale weather regimes causing these natural hazards was provided. Moreover the online presentations focussed on the monitoring, prediction and early warnings of these notable extremes, with emphasis on the use of remote sensing data
Session 1: Evapotranspiration and Drought Monitoring
Water resource is a major concern for sustainable development in many semi-arid areas. Early detection of drought and monitoring water consumption by agriculture are highly important for adaptation in water use regional policy. As a crucial component of the water cycle, land evapotranspiration is a primary source of information for such water resources assessments, and remote sensing from geostationary satellites offers the possibility to monitor it over large areas at relatively high temporal and spatial resolutions. The Satellite Application Facility on Land Surface Analysis (LSA-SAF) of EUMETSAT proposes an operational evapotranspiration product based on data from the SEVIRI instrument of the Meteosat Second Generation (MSG). This SESSION will focus on the evapotranspiration process and the role of satellite-based remote sensing to its observation over land. More particularly, the strategy adopted by LSA-SAF to produce the evapotranspiration maps will be unveiled, with an overview of the quality and characteristics of the operational products. At last, some examples of the product utility in drought monitoring will be given.
Recording Nicolas GhilainThe European Drought Observatory (EDO) (http://edo.jrc.ec.europa.eu) is an initiative of the European Commission’s Joint Research Centre that aims to integrate drought information at European level in a platform accessible to everyone. This information consists mainly in indices based in meteorological and remote sensing data that are produced in near real time.
During this lecture, the different indicators produced operationally at EDO will be firstly introduced. Secondly, a study developed at EDO assessing the LSA-SAF Evapotranspiration (ET) product for drought monitoring in Europe will be detailed. In this analysis, two case studies will be presented; corresponding to the drought episodes of spring/summer 2007 and 2011. For these two cases, the drought indicators previously introduced (Including ET) will be compared and analyzed, considering in the analysis, different drought effects as it is the decrease of the agricultural production.
Finally, the main limitations of the ET as drought indicator will be discussed, as well as the potential for drought assessment and monitoring of other LSA-SAF products like the Land Surface Temperature (LST) and the fraction of Absorbed Photosynthetic Active Radiation (fAPAR).
Recording Guadalupe Sepulcre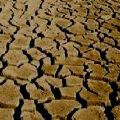
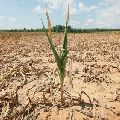
Session 2: Vegetation and Drought Monitoring
Currently the determination of the ecological, agricultural and environmental impacts of climatic change is considered to be a scientific priority. In the present context of climate change and increasing land degradation and desertification, the evaluation of drought impacts is crucial in determining the environmental consequences of a hypothetical change in climatic conditions.
In the last decade special attention was devoted to the development of new indices particularly suited for drought analyses, quantification and monitoring, namely the ones that are using evapotranspiration data.
On the other hand remote sensing data allows to analyse vegetation activity and to estimate different biophysical parameters such as the area index, the vegetation biomass, the net primary production and photosynthetic activity. Given the spectral properties of vegetation, vegetation indices can be calculated and used to analyse vegetation dynamics and climate impacts, namely to determine the impact of droughts.
Recording Célia GouveiaDrought is one of the most adverse environmental disasters. It affects countries’ economies, environment and population wellbeing. Drought occurs every year somewhere in the world and is very costly disaster. Only in the USA, the country of high technology, drought costs taxpayers nearly $6 billion each year. Unlike other environmental disaster drought is a very unusual phenomenon because it starts unnoticeably, develop cumulatively, the impact is also cumulative and by the time when the effect of drought is observable it is too late to mitigate the consequences. Drought was traditionally monitored by weather data. However, since global weather station network is limited, satellite data were used for drought detection, monitoring, prediction and impact assessment. NOAA has developed new method for drought detection and monitoring from reflectance measured by the Advanced Very High Resolution Radiometer flown on NOAA polar-orbiting operational environmental satellites. The method calculates Vegetation Health (VH) indices, which estimate vegetation condition (health) on a scale from extreme stress to favorable conditions based on intensity of greenness, vigor and hotness of vegetation canopy. The VH is estimated every week for each 4 by 4 km earth surface since 1982 and is delivered to the NOAA/NESDIS web site in digital, color-coded and time series from http://www.star.nesdis.noaa.gov/smcd/emb/vci/VH/index.php. In addition to drought and vegetation health monitoring, the VH indices are applied to model and predict agricultural production, wild fire risk, mosquito-borne diseases, climate & land cover changes, invasive species and others. This presentation provides some principals of the method, current drought situation, example of global and regional early drought detection, estimation of its intensity, duration & impact, modelling & prediction of crop production, and explains possible climate services. Some attention will be devoted to drought impacts on food security and how the new generation of NOAA operational satellites (S-NPP/JPSS) will improve drought detection and monitoring.
Recording Felix Kogan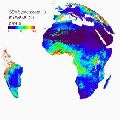
Session 3: Vegetation and Drought Monitoring
The LSA SAF generates and disseminates Fractional Vegetation Cover (FVC), the Leaf Area Index (LAI) and the Fraction of Absorbed Photosynthetically Active Radiation (FAPAR) products derived from SEVIRI/Meteosat BRDF data for the whole Meteosat disk on a daily and 10-day basis. The high rate of acquisition provided by the SEVIRI instrument guarantees the availability of spatially consistent cloud-free data for adequately monitoring both the seasonality of vegetation and the long-term trends in the state of vegetation. This presentation is structured in two parts. Firstly, it is provided an overview of the algorithms, and main characteristics of the VEGA products, including some details about the continuous validation. Secondly, insights about the utility of the products for different applications related with land cover dynamics are also provided, particularly for near real time drought monitoring.
Recording Javier GarciaVarious sources of vegetation indices data (EUMETSAT LSA SAF, Copernicus Land Monitoring Service and MODIS) are available for drought monitoring in Slovenia. Each source has its advantages and disadvantages; the EUMETSAT LSA SAF data is updated daily (it is based on 15 minutes measurements), however it has relative coarse ground resolution (approx. 5x5 km over Slovenia). On the other hand Copernicus Land Monitoring service uses data from low orbital satellites which allow finer ground resolution (500 m - 1 km), but data are refreshed only every 10 days (similar frequency is valid also for MODIS data).
Regarding indices, vegetation signal from Fraction of vegetation cover (FVC) and Leaf area index (LAI) have been found to be a very good indicators of vegetation condition. FAPAR based on LSA SAF data gave us less accurate information on vegetation status. Our main focus is devoted to selected location with relative homogeneous vegetation and intense agriculture. Interpretation of drought signals deduced from indices time series is done with help of the reference period data and drought is interpreted as departure of current condition from reference values. However, drought influence can be masked with signals of damaged vegetation due to severe weather, e.g., hail; therefore much more effort needs to be invested in analysis that a drought signal can be recognized and isolated.
Recording Gregor Gregorič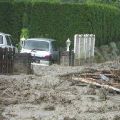
Session 4: Precipitation and Landslides Warning Systems
Extreme rain fall events leading to land slides in torrent catchment areas in Austria will be analysed due to their intensity, extent and duration using weather maps, satellite images, data from weather stations, INCA analysis and thunder cell tracking algorithms. And a meteorological early warning system concerning land slides will be introduced. This system uses short term precipitation forecasts and predefined thresholds for sending a SMS or Email to the user.
Recording Claudia RiedlSession 4: Floods Monitoring
A Global Flood Monitoring System (GFMS) has been developed and tested to provide real-time flood detection and streamflow estimates using NASA multi-satellite precipitation data calibrated by TRMM and, in the near future, by the GPM core satellite. Images and output data are available for use by the disaster relief and science communities with updates available every three hours (http://flood.umd.edu). The system currently uses the TRMM Multi-satellite Precipitation Analysis [TMPA]) and a hydrological and routing combination model, the Dominant river Routing Integrated with VIC Environment (DRIVE) system. The land surface and runoff calculations are carried out at 0.125 latitude-longitude resolution with routing and streamflow calculations done at that resolution and also at 1km resolution. Examples of results for recent flood events will be presented, including calculated inundation maps compared to those estimated from MODIS data. Results from a system to estimate landslide potential are also available at (http://trmm.gsfc.nasa.gov/publications_dir/potential_landslide.html). Landslide examples will also be shown.
Evaluation of the flood system against a global flood event archive indicates skill for longer duration floods in terms of Probability of Detection (POD) [~ 0.8] and False Alarm Rates (FAR) [~0.6]. False alarms are often associated with the presence of dams (not accounted for in the system at present), but sometimes with overestimates of rainfall or artifacts (false rain) related to surface conditions (e.g., cold/wet ground). Failures of detection are often related to underestimation of rainfall, frequently due to shallow, orographic systems unseen or underestimated due to lack of a strong scattering signal in the passive microwave observations.
Recording Bob Adler
Session 5: Extreme Floods and Landslides Events
The monitoring of weather characteristics over the equatorial and tropical regions is well covered with both polar and geostationary satellites hence the satellite becomes a very important instrument on severe weather monitoring and forecasting. The application of multispectral data of MSG in the monitoring the microphysics of clouds such as deep convective clouds with RGB composites provides in-depth understanding in the identification of regions where extremely active storms are located. The use of Multi sensor Precipitation estimete (MPE) also helps in the estimation total of accumulated rainfall on each region during the storm period. Such areas can easily be monitored and the possibility of excess rainfall within a day can be evaluated and such information is used to issue a warning for evacuation, or for support to the potential victims on these areas.
In short RGB composites, MPE Estimates, and the accumulated rainfall on daily basis becomes effective tools of landslide forecasting.
We also add the NWP products particularly the High resolution (7 km) COSMOS data and NCEP CPC data as it gives a forecast with indications of
possibily of heavy storms. However with satellite data you are able to ascertain which areas would the forecast show excess impact on the ground.
The NWP products are used to help in creating accumulated rainfall values (estimates) necessary in establishing the thereshold values for remote
areas where station gauge data is not available.
In the last decade devastating floods occurred in Europe every year taking lives and causing great damages. In this presentation synoptic situations leading to the largest floods affecting Europe in the last 5 years will be analized. The main idea is to pinpoint the similarities and differences in synoptic patterns in order to improve the forecast of such events.
Recording Natasa Strelec Mahovic
Session 6: Extreme Floods and Landslides Events
During early morning and morning on 20th February 2010 an extreme and rare flash flood event has occurred in the Portuguese island of Madeira in the North Atlantic, causing 42 casualties, 600 homeless and an estimated loss of around 1000 millions euros. In this presentation, the synoptic environment will be presented and the precipitation producing systems affecting the island will be discussed. The analysis will be mainly performed using satellite imagery from Meteosat 9, both from singles channels and RGB images, as well as from objective estimates of rain and water vapor content. Results from following studies on the precipitation regime of this mountainous island will also be presented.
Recording Nuno MoreiraSession 6: The European Flood Awareness System
The disastrous floods in Elbe and Danube rivers in 2002 confronted the European Commission with non-coherent flood warning information from different sources and of variable quality, complicating planning and organization of aid. In response to this event, the European Commission initiated the development of a European Flood Awareness System (EFAS) to increase the preparedness for floods in Europe.
The aim of EFAS is to gain time for preparedness measures before major flood events strike particularly for trans-national river basins both in the Member States as well as on European level. This is achieved by providing complementary, added value information to the National hydrological services and by keeping the European Response and Coordination Centre informed about ongoing floods and about the possibility of upcoming floods across Europe. Since 2012 EFAS is running fully operational as part of the COPERNICUS Emergency Management Services.
This presentation will provide an overview of the following basic principles employed in EFAS: (1) the use of ensemble predictions in flood forecasting, (2) employing model climatology to derive return period statistics and (3) communication and visualization of uncertain results for decision making. Furthermore, the flash flood predictions as computed in EFAS will be presented.
Further information on EFAS can be found on www.efas.eu.
Recording Peter Salamon
Session 7: Satellite Precipitation Products and Applications
Within the EUMETSAT Satellite Application Facility on support to Operational Hydrology and Water Management (H-SAF), different precipitation products have been developed. The products exploit either measurements from passive microwave (PMW) radiometers on board polar orbiting satellites, or combination of Meteosat Second Generation (MSG) IR observations with the available PMW precipitation estimates. Some of the products are currently operational (http://hsaf.meteoam.it), and are available for near-real time precipitation monitoring and hydrological applications. Others are being improved and extended to satellites that have become recently operational [i.e., the polar orbiting Core Observatory of the Global Precipitation Measurement mission, (GPM), or the NPP Advanced Technology Microwave Sounder, ATMS)] or that will be operational in the near future (i.e, Meteosat Third Generation. MTG). The H-SAF precipitation products will be presented, focusing on the strengths, weaknesses, and potentials of the current products, and future perspectives offered by the products in development will be outlined.
Recording Giulia Panegrossi (Part 1)In this presentation some applications of H-SAF precipitation products will be shown.
Recording Giulia Panegrossi (Part 2)
Session 8: Landslides Management
Research during the past decade has documented the importance of satellite precipitation products to the overall workings of the tropical landslide susceptibility. Several types of satellite precipitation products are used for landslide assessment but the area they see, and the frequency of observations, varies. Two complementary types are particularly relevant to landslide management. Polar-orbiting satellites fly in a relatively low orbit (often at around 1000km above the ground), providing relatively high spatial resolution. But they only collect data over the same point once every few days. Geostationary satellites are positioned at a much higher altitude (about 36,000km). They orbit the Earth at the same speed as the Earth rotates on its axis, in effect remaining stationary above the ground and viewing the whole earth disk below. Their spatial data is much coarser, but is collected at the same point every 15 minutes. Moreover, rainfall-triggered landslides tend to be local-scale features, but ground conditions are also very important. When they destroy people's lives and livelihoods, they become natural disasters. Thus, Understanding the nature of spatial and temporal variability of rainfall events in developing countries is important to improve the landslide-prediction science. This seminar will present an overview of recent landslide examples in Brazil and applications of satellite precipitation products. A key satellite input dataset for the integrated applications is the EUMETSAT’s Satellite Application Facility on Support to Operational Hydrology and Water Management.
Recording Humberto Barbosa
Session 9: Floods Management
The Flood Forecasting Centre (FFC) is a successful working partnership between the Environment Agency and the Met Office. We bring together the sciences of hydrology and meteorology in a jointly staffed specialist centre.
The winter of 2013-14 was the wettest for 250 years across England and Wales, with a succession of storms bringing sustained flooding from all natural sources, coastal, fluvial, surface water and groundwater. The presentation will start with an overview of the meteorological conditions that led to the largest coastal surge down the East Coast of England since 1953. The hydrometeorological conditions and flooding through late December 2013 to March 2014 will then be considered, along with examples and mechanisms of communicating the high impact conditions to emergency responders and Central Government. This included two briefings directly to our Prime Minister. Meteorological drivers and the possible teleconnections behind the exceptional conditions will also be considered.
Recording Gavin Robbins