Synoptic and Mesoscale Analysis of Satellite Images - 2018
The EUMeTrain - Eumetcal course on Synoptic and Mesoscale Analysis of Satellite Meteorology is teaching you how to operationally parse a satellite image into conceptual models. Analysing a satellite image in terms of conceptual models is the best way to learn to retrieve a 3D or even a 4D (with time being the fourth dimension) mental weather picture.
The course was designed for operational forecasters and meets the requirements of the WMO.
The online course was co-organised by EUMeTrain, EUMETSAT and EUMETCAL.
Conceptual Models and the manual on synoptic satellite meteorology (same as in 2016)
Getting a good, actual weather picture within short time is essential for a forecaster who has to react quickly and adequately on weather changing's.
The huge amount of weather data which are available makes it almost impossible for a human being to handle. Thinking in conceptual models is
the only way to deal with this problem
Within 20 years of the project fifty-three different conceptual models were described in a manual: Sat Manu. Also for the southern hemisphere, we have already fifteen CM's described.
Frontal and sub-frontal structures
Fronts as described in the "Bergen school" by Vilhelm Bjerknes are early conceptual models. Parameters typical for the changing of air masses were named and used by forecasters to recognize transition zones (fronts) between air masses. For nearly a century the method from the Bergen school is applied in the majority of weather rooms all over the world. Satellite information expressed how right Bjerknes was in his CM thinking, but this information showed also that fronts can have a much more complicated structure and live cycle Bjerknes could imagine.
In the lecture we concentrate on warm- and cold fronts and show how we can analyze them with help of CM thinking.
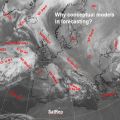
It's not only fronts that forecasters should always keep an eye on, but also the frontal sub-structures like upper waves, front intensifications or newly developing systems. NWP models sometimes catch the situation, sometimes not. Especially for rapid or small scale developments, model performance may leave a lot of gaps in the processes.
Cyclogenesis and occlusion cloud bands part I
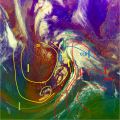
Cyclogenesis and occlusion cloud bands are common meteorological phenomena which are tightly connected. While “cyclogenesis” is a process, describing the development of a low centre, which can last from few hours to several days, the occlusion cloud bands are the result of this cyclogenesis process. Occlusion cloud bands differ from cold and warm front bands because of their history as well as their physical status.
The two lectures start from the classical cyclogenesis (occlusion) processes which are related to the classical polar front theory and introduce then the conveyor belt view of these processes culminating in the warm and cold conveyor belt occlusion types.
The occlusion cloud band types are described and compared to cold and warm front types in their horizontal as well as vertical depiction.
Also special subtypes of occlusion processes like “instant occlusion” and "cold air development" are mentioned.
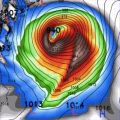
Cyclogenesis and occlusion cloud bands part II
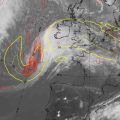
In this second part of the Cyclogenesis and Occlusion Cloud Bands lecture, a special form of cyclogenesis is treated in detail: the “rapid cyclogenesis” which is connected with very severe and often catastrophic weather events.
All processes and weather systems are presented from the aspect of “Conceptual Model thinking”; that means the typical appearance in satellite images is connected to the physical background which is responsible for the cloud configurations; then these results are connected to relevant numerical parameters in horizontal and vertical presentation. And all of the presented CMs are connected to the typical connected weather events. This combination of different meteorological material is especially important in forecasting and nowcasting.
Mesoscale Precipitation Bands within Cyclones (same as in 2016)
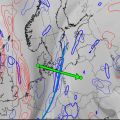
Precipitation within extratropical cyclones often organizes into mesoscale substructures known as precipitation bands. The purpose of this presentation is to better understand how precipitation organizes into bands. We will discuss about Shapiro-Keyser and the Norweigan models of cyclones, why do they form, the differences between them, also where in cyclones precipitation bands form, their structures and evolutions, what controls their locations and intensities, and techniques to diagnose precipitation bands. In the end we will discuss about occlusion bands and how do they actually form considering latest researches.
Go to Webcast..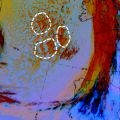
Mesoscale features in Cold Air
There are a number of structures and processes happening after a cold front has passed an area, e.g. enhanced cumuli, commas, instant occlusions, etc. Commas, for example are meso-scale structures developing within cold air, often behind frontal cloud bands. They occur mainly during the cold season and are a common feature for Northern and Western Europe - nevertheless commas can also be found in the south. As commas can cause severe weather this conceptual model is of high interest for forecasters. In this lecture life cycles of commas will be shown, what do commas form from, what can they form into, how they are connected to other mentioned phenomena and how they appear in satellite imagery - seen by MSG and polar orbiting satellites.
Go to Webcast..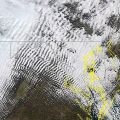
Gravity waves, lee waves and turbulence
Gravity waves are omnipresent in the atmosphere. In this presentation you will hear more about the different wave types, their appearance in satellite imagery and about their physical background.
Most gravity waves are generated by orographic elevations and in this case we call them lee waves. They can present a serious threat to aircrafts when the air flow changes from laminar to turbulent or when rotor clouds are generated. When this happens without accompanying condensation processes, the phenomenon is called "Clear Air Turbulence" (CAT). In many cases, waves in the atmosphere are accompanied by a characteristic cloud pattern visible in the IR and VIS imagery that helps in identifying regions potentially hazardous for aircrafts.
Gravity waves can however also result from internal friction/shear processes when two layers of air with different physical properties (e.g. temperature, density, wind speed ...) are acting one on the other. This wave type is called Kelvin-Helmholtz wave. Turbulence caused by velocity and directional shear are relatively common in the upper Troposphere in the regions of jet streaks.
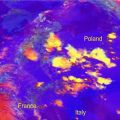
Convective cloud features in typical synoptic situations (same as in 2016)
Convection can be found everywhere on the planet. However in meteorological way of thinking in mid-latitudes there is convection in different airmasses and also at the boundary of these airmasses. Convection at the boundaries belongs to the sub-features of frontal systems and we won’t deal with convection in the frontal systems.
In this lecture a few examples of unstable air Conceptual models will be shown, for instance: Cumulonimbi, Enhancement of convection by PV, Spanish Plume, etc. The typical environment is one part and the organization modes is the second part of the lecture.
Shallow clouds and related weather phenomena
Satellite image interpretation of shallow clouds and related weather phenomena is a very important task for nowcasting because NWP-models and statistical methods exhibit still deficiencies in simulating these phenomena in a proper way. Especially over oceans but also over land observation networks are often too coarse meshed for nowcasting.
The theory and the most suitable satellite products will be explained first. In combination with other data (e.g., observations, radio soundings, radar products) examples will be discussed for the following application areas:
1) Diagnosing shallow clouds in respect to water content and related weather, e.g., drizzle of different intensities;
2) Identifying fog and low stratus and how to estimate the fog/stratus layer's thickness. The likelihood of dissolving and connected weather phenomena (e.g., freezing drizzle) will be covered, too.
Access the material
Some of the recordings are the same as they were in 2016 edition, but many new materials that had been used in the course are still kept and sorted out on the course website. The website is hosted on Eumetcal's Learning Management System (LMS) and can be accessed here
The next edition of the Synoptic and Mesoscale Analysis of Satellite Images (SMASI) will be held in 2020 and more info about it will come during that year.