Synoptic and Mesoscale Analysis of Satellite Images - 2014
The EUMeTrain - Eumetcal course on Synoptic and Mesoscale Analysis of Satellite Meteorology is teaching you how to operationally parse a satellite image into conceptual models. Analysing a satellite image in terms of conceptual models is the best way to learn to retrieve a 3D or even a 4D (with time being the fourth dimension) mental weather picture.
The course is designed for operational forecasters and meets the requirements of the WMO.
The online course was co-organised by EUMeTrain, EUMETSAT and EUMETCAL.

Lecture 1: The Manual on Synoptic Satellite Meteorology
Getting a good, actual weather picture within short time is essential for a forecaster who has to react quickly and adequately on weather changing’s.
The huge amount of weather data which are available makes it almost impossible for a human being to handle. Thinking in conceptual models is the only way to deal with this problem
Meteorological satellites opened a whole new field in the conceptual model thinking in operational meteorology. Now there was an opportunity to recognize weather systems by detecting cloud patterns and verify this first guesses with observations and numerical parameters.
Within a ten years European project fifty different conceptual models are described in a manual: Sat Manu. Last year a new project has started to describe also conceptual models which are typical for the southern hemisphere. Already eight of these CM’s are described yet.
Go to Webcast..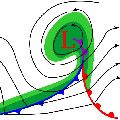
Lecture 2: Frontal Structures
Fronts as described in the “Bergen school” by Vilhelm Bjerknes are early conceptual models. Parameters typical for the changing of air masses were named and used by forecasters to recognize transition zones (fronts) between air masses. For nearly a century the method from the Bergen school is applied in the majority of weather rooms all over the world. Satellite information expressed how right Bjerknes was in his CM thinking, but this information showed also that fronts can have a much more complicated structure and live cycle Bjerknes could imagine.
In SatManu eight different types of warm- and cold fronts were recognized and described.
In this lecture we concentrate on warm- and cold fronts and show how we can analyze them with help of CM thinking.
Go to Webcast..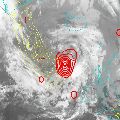
Lecture 3: Frontal Substructures
When observing the development of frontal zones in satellite imagery, forecasters should always keep an eye on frontal sub-structures like upper waves, front intensifications or newly developing systems. NWP models sometimes catch the situation, sometimes not. Especially for rapid or small scale developments, model performance may leave a lot to be desired.
In this presentation, the focus will be on comparison between model output and satellite data in relation to fontal sub-structures. Model output such as simulated satellite imagery are easily compared to the most recent satellite images and hence form a perfect tool for estimating the model performance.
Go to Webcast..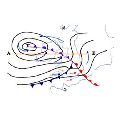
Lecture 4: Cyclogenesis and Occlusion Cloud Bands I
Cyclogenesis and occlusion cloud bands are common meteorological phenomena which are tightly connected. While “cyclogenesis” is a process, describing the development of a low centre, which can last from few hours to several days, are the occlusion cloud bands the result of this cyclogenesis process. Occlusion cloud bands differ from cold and warm front bands because of their history as well as their physical status.
The two lectures start from the classical cyclogenesis (occlusion) processes which are related to the classical polar front theory and introduce then the conveyor belt view of these processes culminating in the warm and cold conveyor belt occlusion types.
The occlusion cloud band types are described and compared to cold and warm front types in their horizontal as well as vertical depiction.
Also special subtypes of occlusion processes like “instant occlusion” and “cold air development” are mentioned.
In the second part a special form of cyclogenesis is treated in detail: the “rapid cyclogenesis” which is connected with very severe and often catastrophic weather events.
All processes and weather systems are presented from the aspect of “Conceptual Model thinking”; that means the typical appearance in satellite images is connected to the physical background which is responsible for the cloud configurations; then these results are connected to relevant numerical parameters in horizontal and vertical presentation. And all of the presented CMs are connected to the typical connected weather events. This combination of different meteorological material is especially important in forecasting and nowcasting.
Go to Webcast..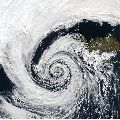
Lecture 6: Mesoscale Precipitation Bands within Cyclones
Precipitation within extratropical cyclones often organizes into mesoscale substructures known as precipitation bands. The purpose of this presentation is to better understand how precipitation organizes into bands. We will discuss where in cyclones such precipitation bands form, their structures and evolutions, what controls their locations and intensities, and techniques to diagnose precipitation bands.
Go to Webcast..
Lecture 7: Comma Clouds - Mesoscale Features in cold Air
Commas are meso-scale structures developing within cold air, often behind frontal cloud bands. They occur mainly during the cold season and are a common feature for Northern and Western Europe – nevertheless commas can also be found in the south. As commas can cause severe weather this conceptual model is of high interest for forecasters. In this lecture life cycles of commas will be demonstrated and how they appear in satellite imagery – seen by MSG and polar orbiting satellites. On the theoretical side the physics behind these developments will be explained. Different types of development exist - Within the cold air commas can grow out of EC starting as a small feature which is growing in to the typical meso-scale cloud spiral. On the other hand commas can be found in connection with occlusion when they split off the cloud spiral and becoming a separated feature on their own. The most important numerical parameters in connection with commas and their synoptic surrounding will be discussed. Typical weather events are storms and heavy precipitation (in form of showers and thunderstorms). Examples of real cases will be shown and shall illustrate life cycle and typical synoptic situations.
Go to Webcast..
Lecture 8: Polar Lows
Polar Lows are generally characterized by a severe weather in form of a strong winds, showers and occasionally heavy snow, which had sometimes resulted in lost of lives, especially on the sea area. Sometimes these systems are also connected with term Arctic Hurricane, which had been used for especially intense Polar lows. Compromising definition of Polar low is; small, but fairly intense low in maritime regions.
They are formed in cold air outbreaks, north of the polar front, mostly in the regions east of 0°E and south of 75°N. Favorable season for them is cold part of the year. By size, they are smaller than the ordinary synoptic lows (200-600 km) with the life-span typically around 18 hours, and with very intense change of weather.
In my presentation I will show you how we are forecasting Polar lows, which models we are using and of course satellite products.
Go to Webcast..
Lecture 9: Convective Cloud Features in typical synoptic Situations
Convection can be found everywhere on the planet. However in meteorological way of thinking in mid-latitudes there is convection in different airmasses and also at the boundary of these airmasses. Convection at the boundaries belongs to the sub-features of frontal systems and this lecture won’t deal with the convection in the frontal systems.
Fortunately, as forecasters we know a lot about warm and cold airmass and especially when we are using the so-called airmass-RGB.
In this lecture a few examples of the cold air will be treated. However, most time will spend about convection in the warm air. The typical environment is one part and the organization modes is the second part of the lecture.
Go to Webcast..
Lecture 10: Shallow Clouds and related Weather Phenomena
Satellite image interpretation of shallow clouds and related weather phenomena is a very important task for nowcasting because NWP-models and statistical methods exhibit still deficiencies in simulating these phenomena in a proper way. Especially over oceans but also over land observation networks are often too coarse meshed for nowcasting.
The theory and the most suitable satellite products will be explained first. In combination with other data (e.g., observations, radio soundings, radar products) examples will be discussed for the following application areas:
1. Diagnosing shallow clouds in respect to water content and related weather, e.g., drizzle of different intensities;
2. Identifying fog and low stratus and how to estimate the fog/stratus layer’s thickness. The likelihood of dissolving and connected weather
phenomena (e.g., freezing drizzle) will be covered, too.