The Impact of Upper-Level Low Bernd on Germany and Austria
Germany
In the period from 12 to 19 July 2021, the cyclone Bernd caused high rates of rainfall over many parts of Europe and especially over Germany. Precipitation rates exceeded 150 mm/24 hours in some areas. The incidence of such events ranges from once every 100 to 1000 years. These high precipitation rates caused floods particularly in the western parts of Germany. More than 180 people were killed by the floods.
Water caused severe damage to railroad infrastructure and power plants had to be switched off, thus leaving many people without electricity and telecommunications for days. A huge ecological problem was caused by petrol leakages from heating installations and cars drowned in the floods.
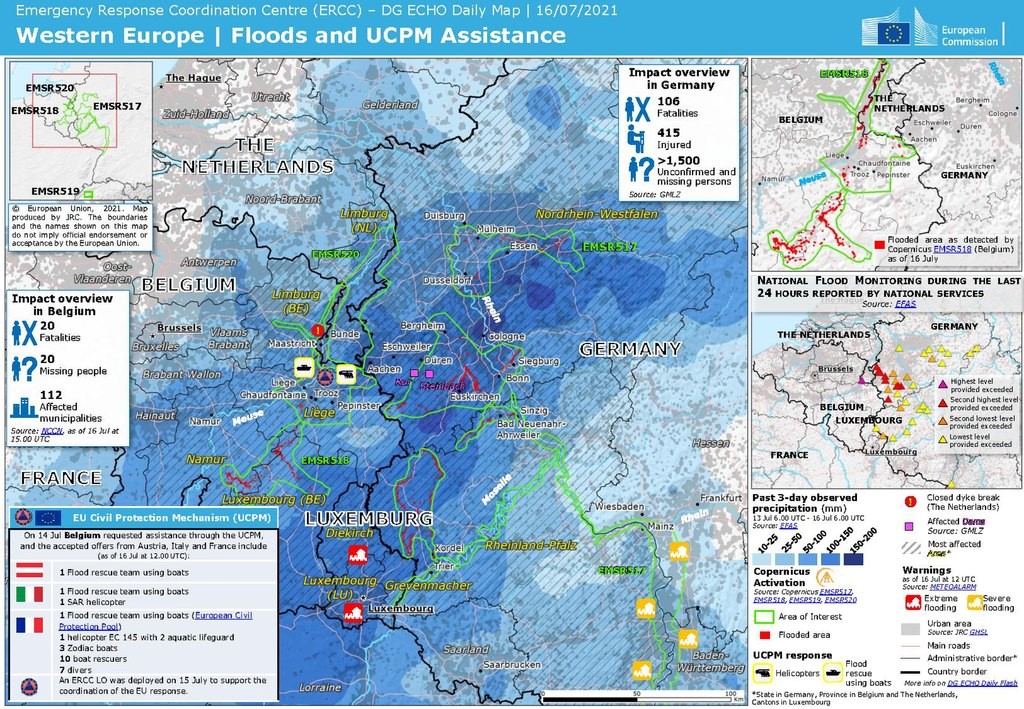
Figure 1: Western Europe | Floods and Union Civil Protection Mechanism (UCPM) Assistance chart (JRC, European Commission).
Timeline:
On 13 July 2021 rain showers were present over western Germany throughout the day and embedded thunderstorms appeared in the late evening. The air mass in this area was very humid containing around 40 mm of total precipitable water equivalent. These weather conditions caused intense local precipitation and high short term rain rates.

Figure 2: 24-hour accumulated precipitation over Germany based on radar measurements from 13 to14 July 2021 at 06:00 UTC (copyright DWD)
The ULL Bernd had a side-trough whose presence strengthened the lifting process of moist air over western Germany on 14 July. This dynamic process led to even higher precipitation rates than the day before (see Figure 3).
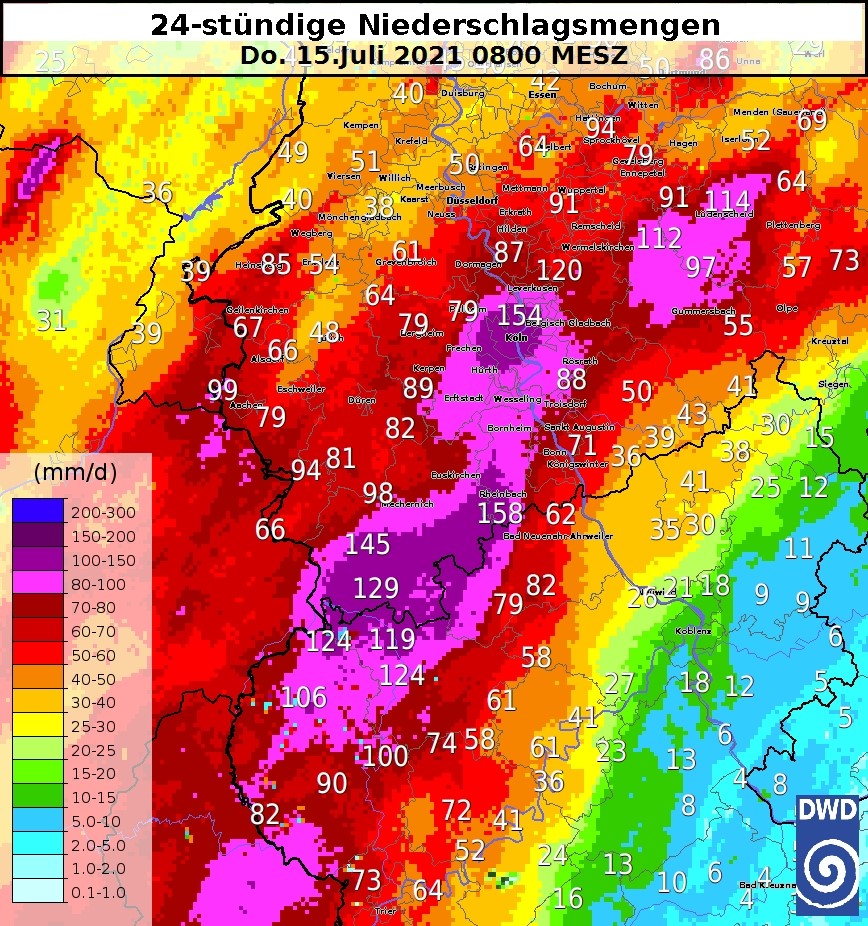
Figure 3: 24-hour accumulated precipitation measurements over western Germany from 14 to 15 July 2021 at 06:00 UTC (copyright DWD).
As a consequence of the high rain rates, the water levels of rivers increased dramatically and reached points recorded only every 50 years. Figure 4 presents an example for the river Lieser at the town of Daun in Rhineland-Palatinate. Most losses of life resulted from rivers overflowing and flooding inhabited areas, sweeping away cars, streets and houses.
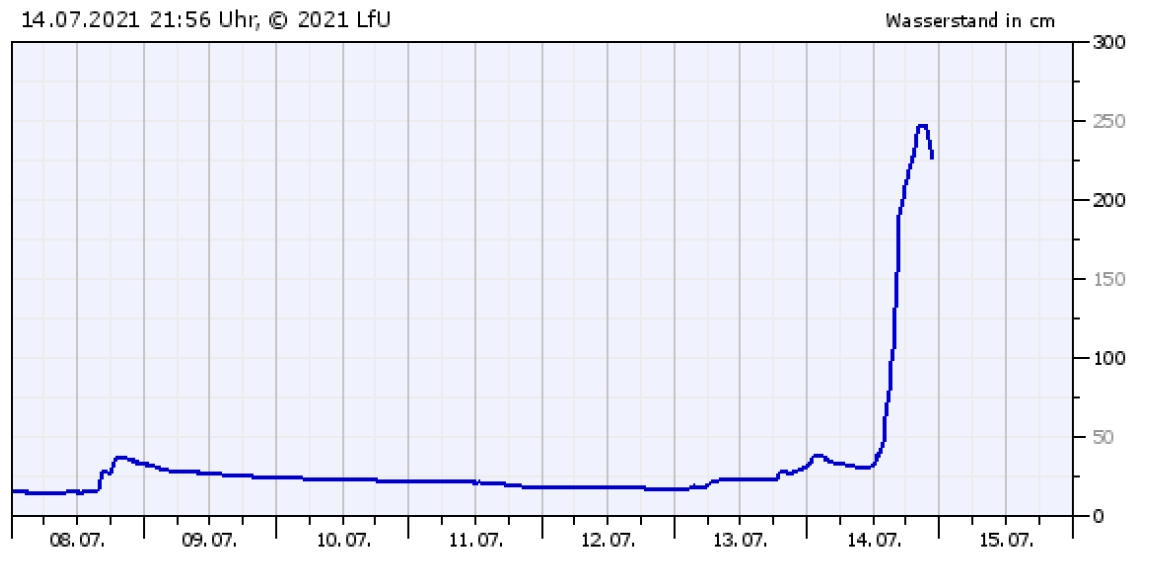
Figure 4: A rise in water level from 25 cm to 2.5 meters within a few hours was recorded for the river Lieser at the town of Daun in western Germany.
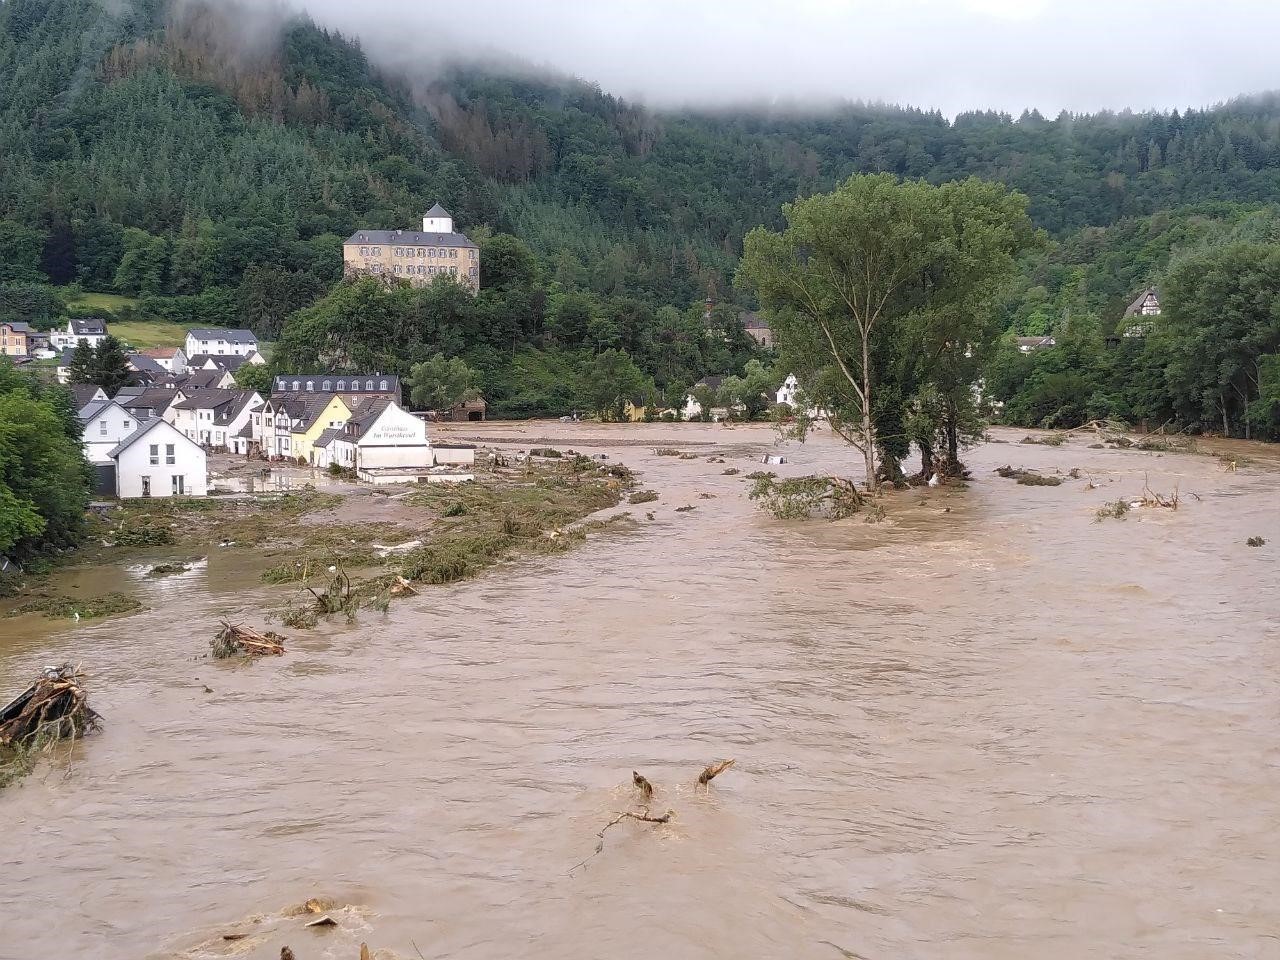
Figure 5: Flood in the town of Kreuzberg in Altenahr on 15 July 2021 (Martin Seifert).
Austria
Austria was less affected by the cyclone Bernd than Germany or the Benelux as far as loss of life and damage to property are concerned, although the 24-hour precipitation rates were only a little below those recorded in Germany. After being stationary for a few days, Bernd moved to a position south of the Alps quickly, within two days. There were no fatalities, but the economic losses were considerable. Houses and railway lines were flooded, villages had to be evacuated, a bridge was swept away and mudflows had to be cleared.

Figure 1: The flooded town of Hallein near Salzburg on 17 July 2021.
The highest precipitation rates in Austria were recorded between 17 July in the morning and late 18 July. Precipitation fell mainly along the north side of the Alps from Tyrol to Lower Austria. Continuous rain was recorded in most places, while locally the amount of precipitation varied greatly due to the presence of thunderstorms. 16 838 convective cells were detected by the Austrian radar network on 17 July and another 11 365 the next day.
In regions not affected by orographic rain caused by the barrage clouds north of the Alps, thunderstorms were the cause behind most of the measured precipitation, especially in the flatter parts of eastern Austria. The top 18 precipitation records exceeding 100 mm/48 hours were all located north of the Alps (see Table 1).
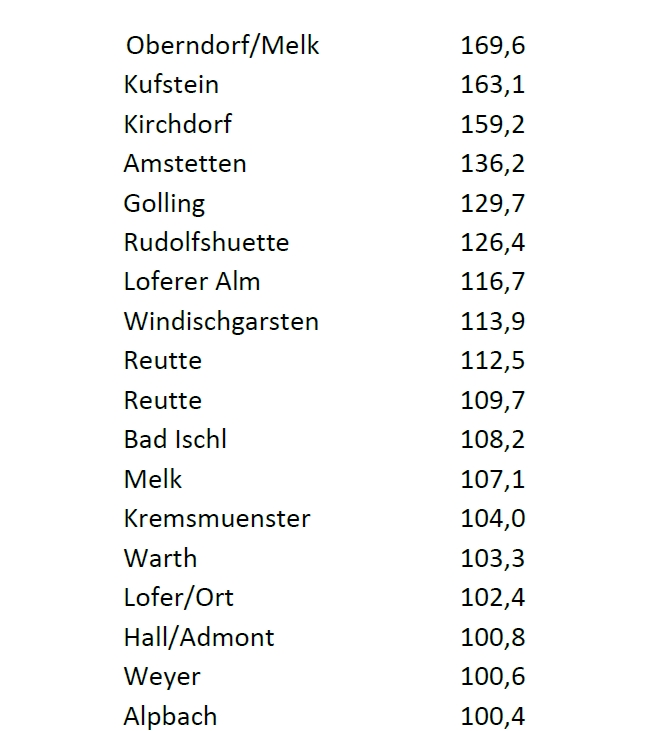
Table 1: 48-hour accumulated precipitation amounts recorded from 17 July at 00 UTC to 19 July 2021 at 00 UTC by the ZAMG-Tawes network.
These precipitation figures also stand out in terms of how often they occur. For example, Kufstein in Tyrol only experiences precipitation this heavy once in 200 years. Most of the precipitation fell between 17 July 00 UTC and 19 July 00 UTC. The graph below shows two distinct rain rate maxima that were caused by convective cells passing over Kufstein (see Figure 2).
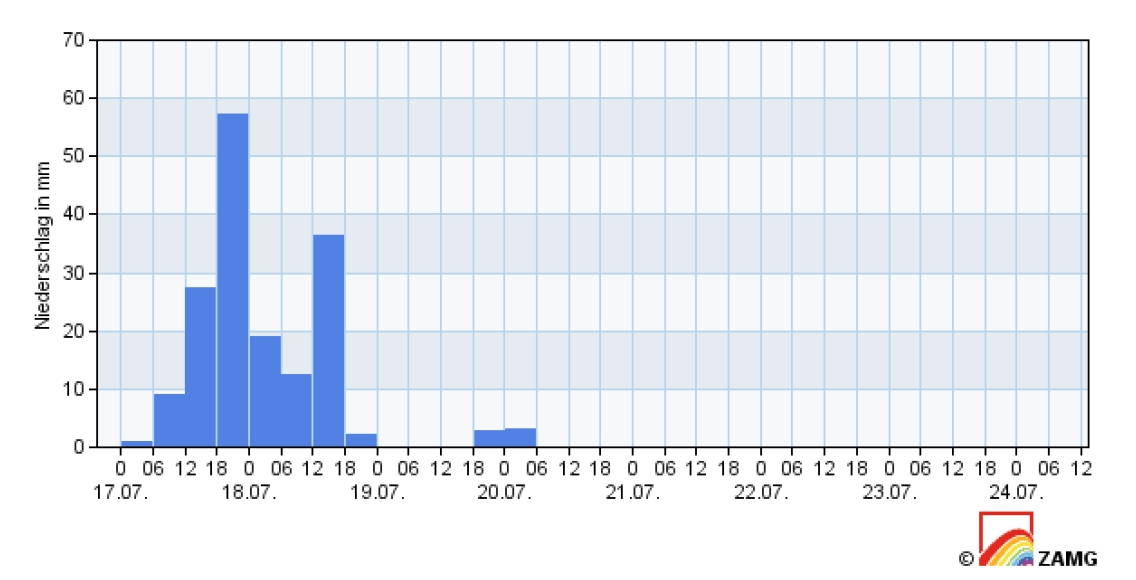
Figure 2: 6-hourly precipitation rates recorded at Kufstein (Tyrol) between 17 July at 00 UTC to 19 July 2021 at 00 UTC by the ZAMG-Tawes network.
The 24-hour accumulated precipitation charts for Austria on 18 and 19 July show the hot spots of precipitation evenly distributed along the alpine ridge (see Figure 3). Two of them, Kufstein and Hallein, are marked on the first chart.
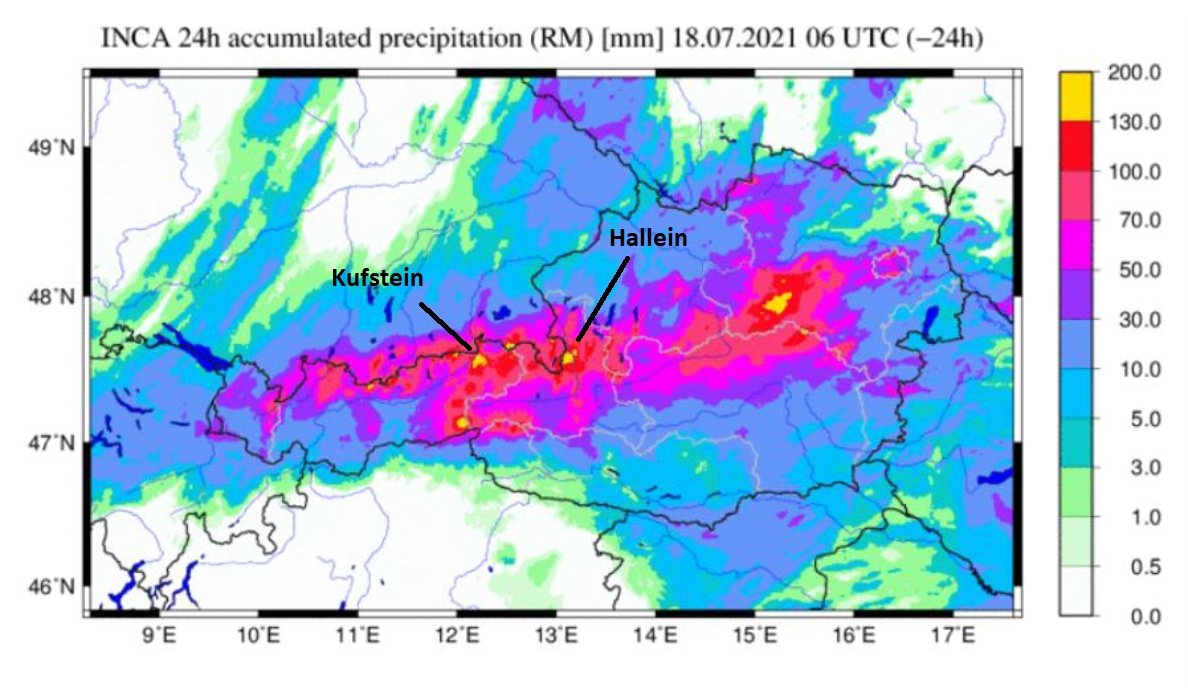
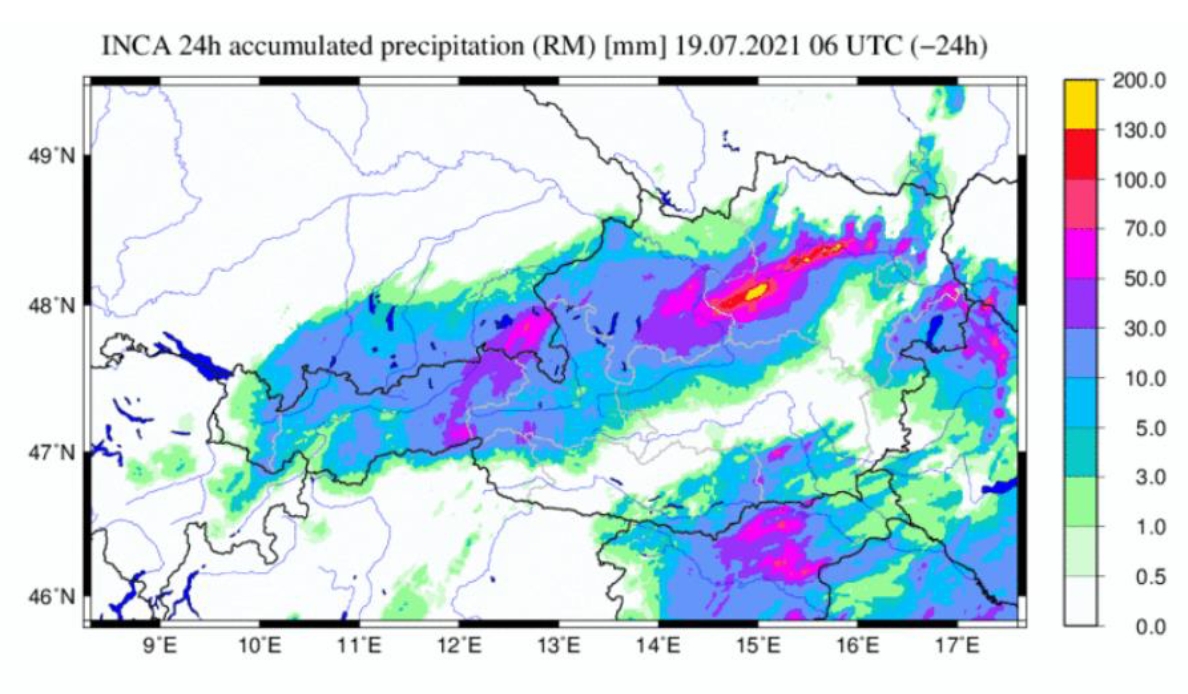
Figure 3: Accumulated 24-hour precipitation charts derived from the INCA nowcasting model on 18 and 19 July 2021 at 06:00 UTC.
The town of Hallein, located south of Salzburg, was heavily flooded due to a log jam in the Kothbach river that crosses the town. Streets and alleys were flooded and many buildings damaged. People had to be rescued by fire brigades, but luckily there were no fatalities. Follow the link below to see a short video of the flooding:
https://www.youtube.com/watch?v=Wst9rXUHFfE
The local weather station recorded a precipitation rate of 80 mm in 12 hours from 17 July at 12 UTC to 18 July at 00 UTC (Figure 4). Approximately 20 mm of this amount was due to local convection.
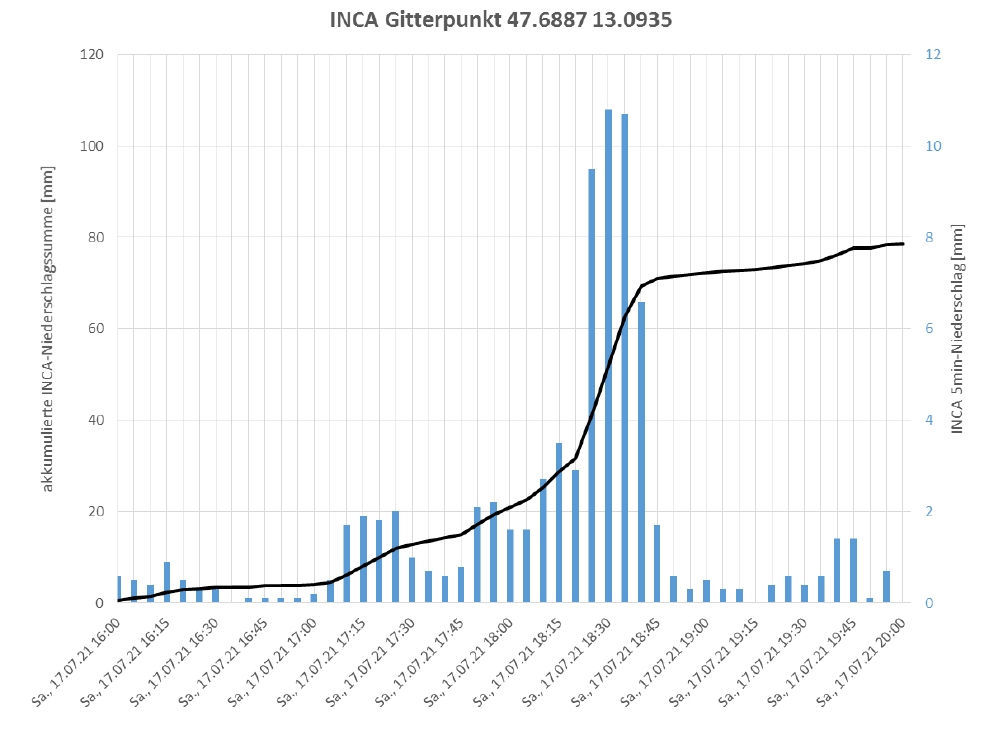
Figure 4: Cumulative precipitation chart (black line) for the grid point of Hallein. Blue bars show the precipitation amount for every 5 minutes as given by the INCA nowcasting model.