14 July 2021
On 14 July the system becomes stationary over Central Europe. The surface low over northern Germany has deepened, while high pressure prevails below the ULL core. Warm air from the Mediterranean is brought north along the eastern side of the ULL. This is seen in the Airmass RGB as an occlusion-like cloud band (see Figure 4).
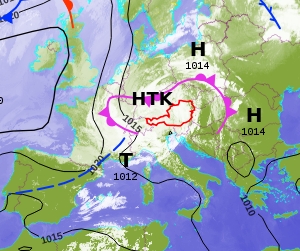
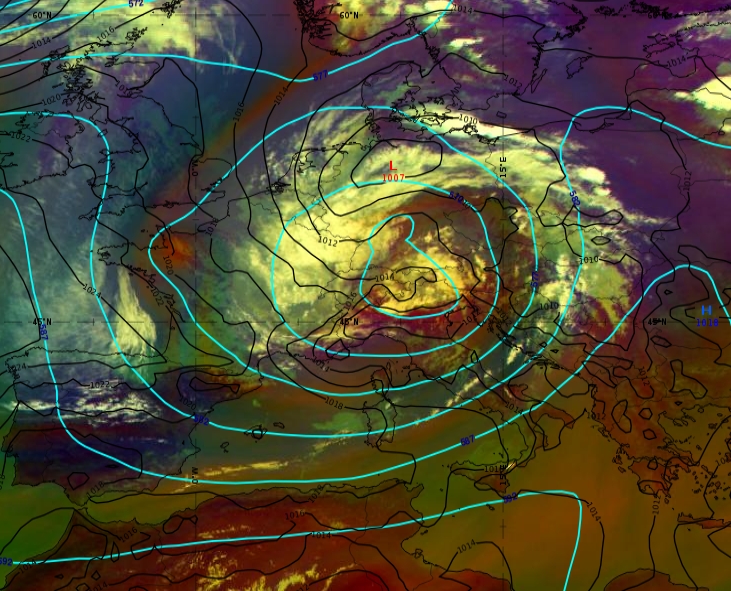
Figure 4: Left: Frontal analysis from 14 July 2021 at 12:00 UTC. H = High pressure system, T = Low pressure system (Tiefdrucksystem) and HTK = Upper-level low (Höhentiefkern).
Right: Airmass RGB from the same date. Cyan lines indicate the geopotential height at 500 hPa, black lines indicate the mean sea level pressure.
The OPERA radar composite image in Figure 5 shows the precipitation center over north-western Germany and the Benelux. The corresponding ECMWF forecast of total precipitable water amount for this area and point in time describes the situation quite well.
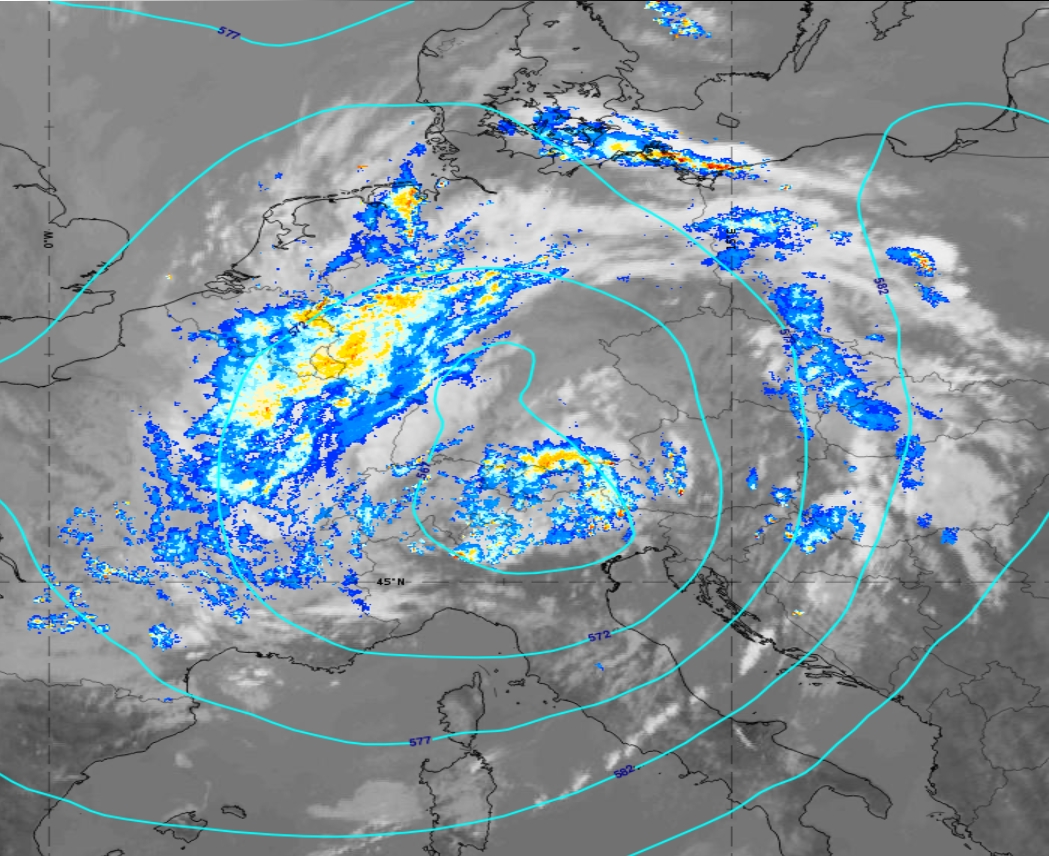
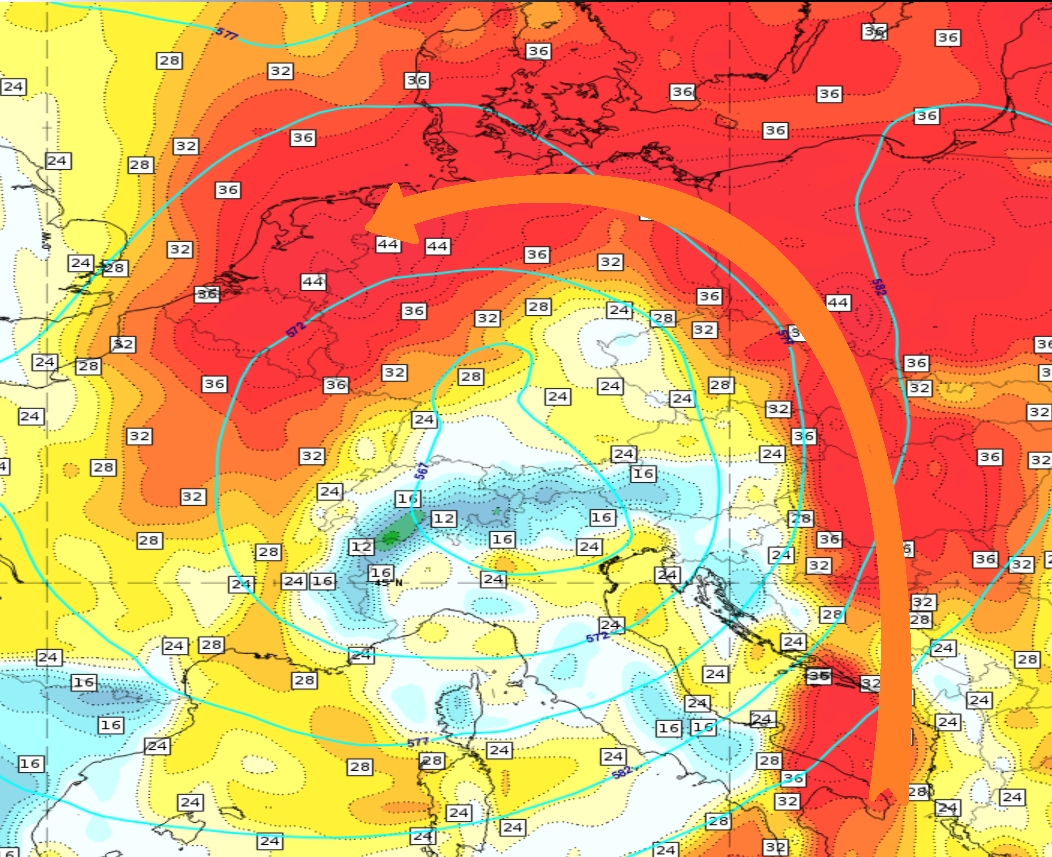
Figure 5: Left: Radar image from 14 July 2021 at 12:00 UTC.
Right: Total Precipitable Water parameter from ECMWF (12 hours forecast for 14 July 2021 at 12:00 UTC). The orange arrow symbolizes the warm conveyor belt.
A closer look inside the conveyor belt that wraps around the ULL (Figure 5, right side) by means of a vertical cross section (VCS) provides more information. The VCS starts in the center of the ULL and ends over the North Sea (Figure 6) so that it crosses the area of heavy precipitation. The equivalent potential temperature field at 850 hPa shows the tongue of warm and humid air masses advected from the southeast.
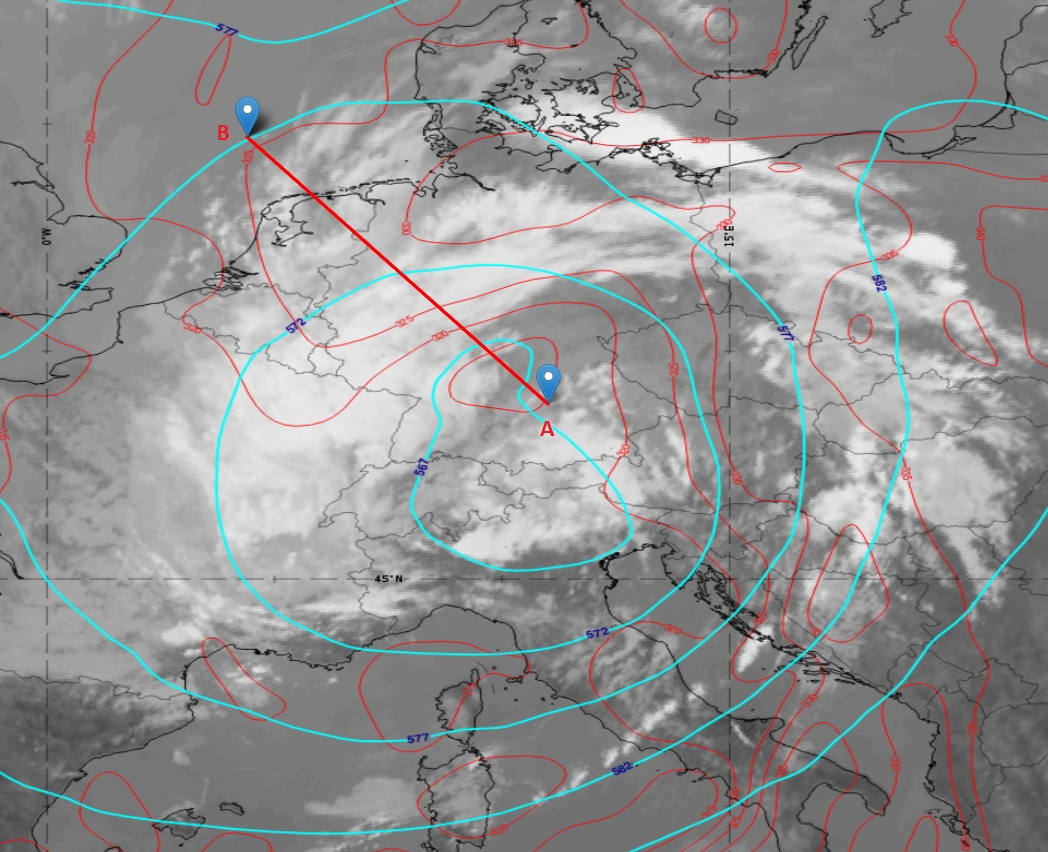
Figure 6: IR image from 14 July at 12:00 UTC. Equivalent potential temperature at 850 hPa (red) and geopotential height (cyan) at 500 hPa. The location of the VCS is indicated by the red line starting at A and ending at B.
The most striking feature the ECMWF model shows in the VCS (A -> B) is a pronounced vertical motion within the warm conveyor belt (see Figure 7). Lifted moist air is the main reason for intense precipitation over the Benelux and northwestern Germany. The VCS below shows that humidity is concentrated in the layers below 500 hPa.
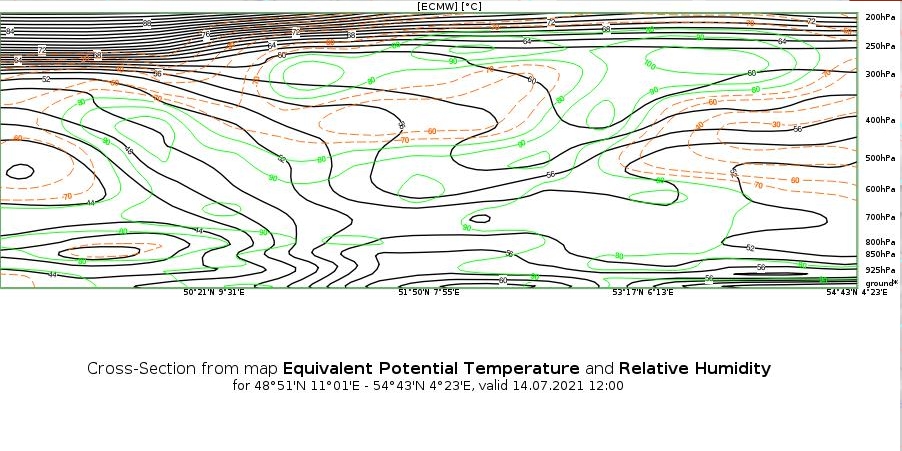
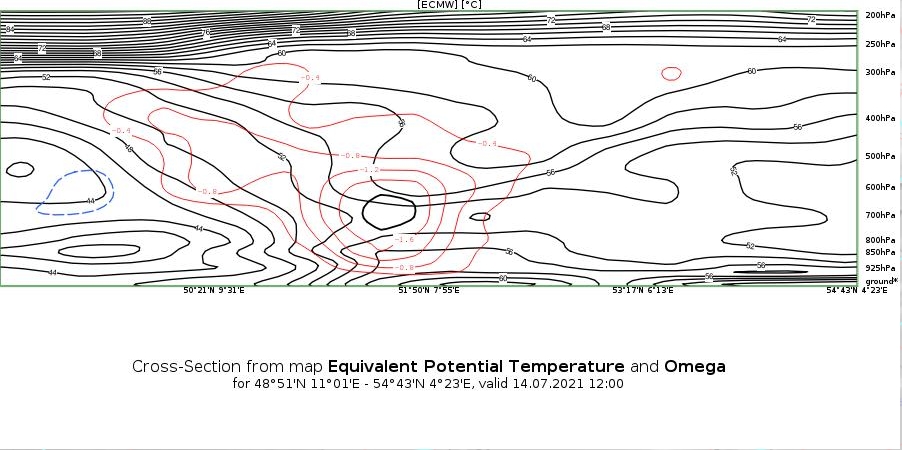
Figure 7: Vertical cross section as shown in Figure 6 for the ECMWF parameters Relative Humidity (green), Omega (red) and the Equivalent Potential Temperature (black).
Surface convergence and upper-level divergence can be seen in the next VCS (Figure 8). Both features result from the nearby low-level pressure minimum that boosts convection and precipitation (Figure 4, right side).
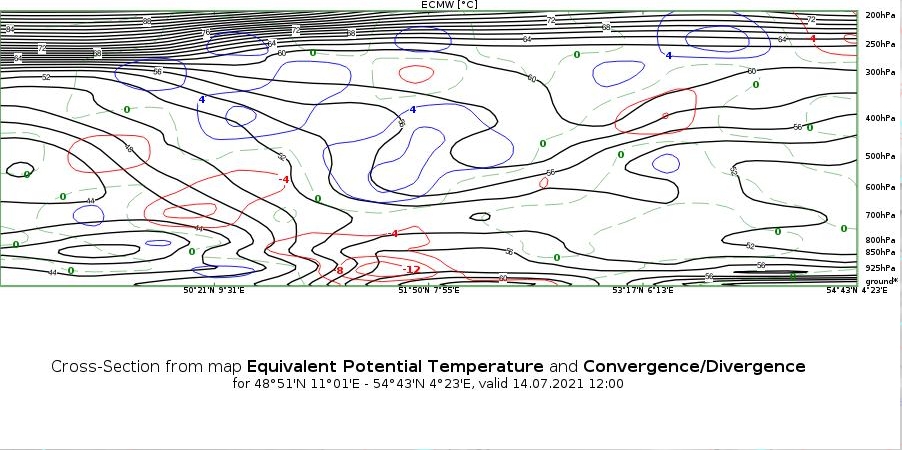
Figure 8: Vertical cross section as shown in Figure 6 for the ECMWF parameters Convergence (red), Divergence (blue) and the Equivalent Potential Temperature (black).