Special Investigation:
•Different Kinds of Warm Front Development
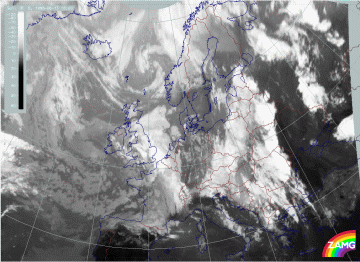
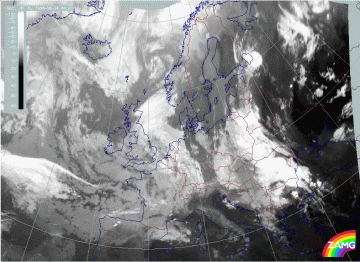
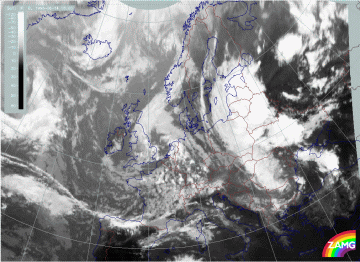
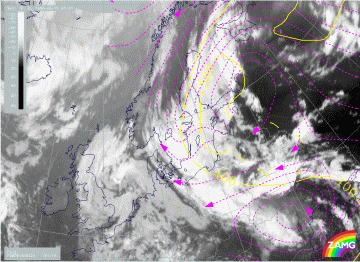
Warm Front Bands are described in this chapter as CMs standing alone. But it is especially interesting to look at the development of such weather systems.
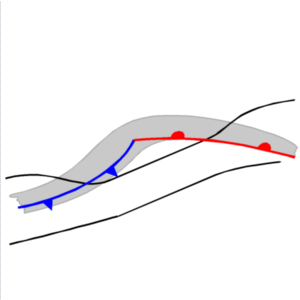
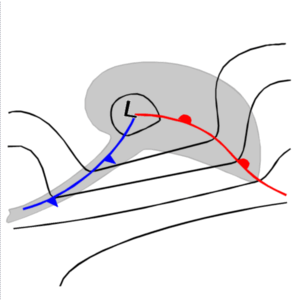
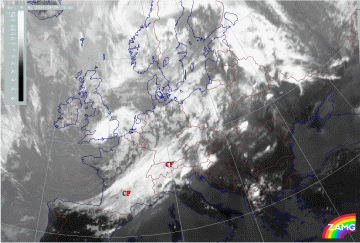
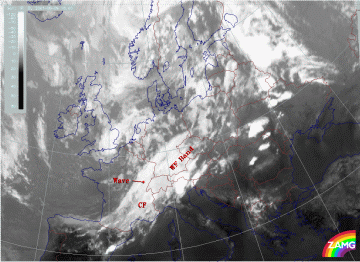
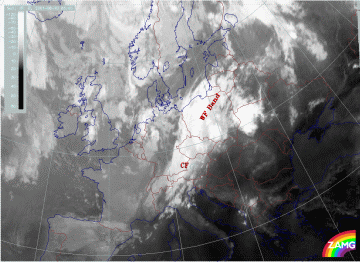
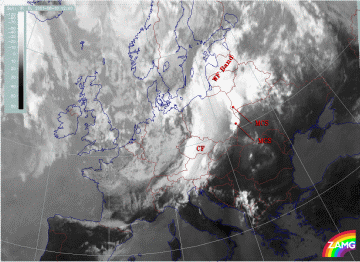
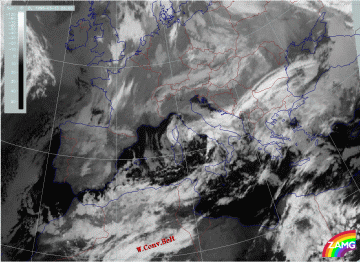
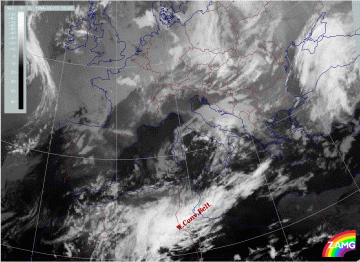
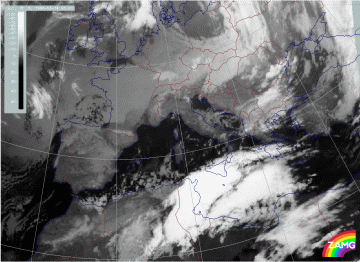
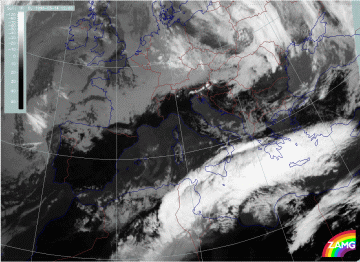
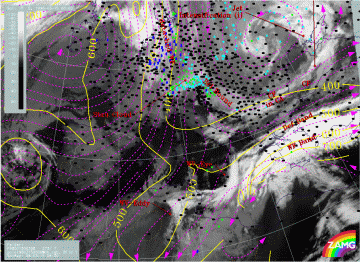
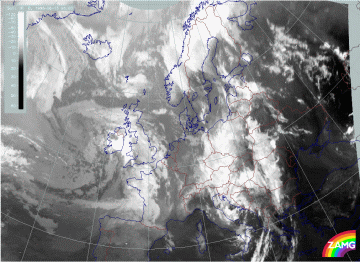
The most common development of a Warm Front Band is connected to classical Norwegian Model of the polar front theory; that means that Cold Fronts and Warm Fronts develop if a disturbance is superimposed on the (in the beginning stationary) polar front (see also Occlusion: Warm Conveyor Belt Type).
|
09 August 2001/15.00 UTC - Meteosat IR image
|
09 August 2001/18.00 UTC - Meteosat IR image
|
|
10 August 2001/06.00 UTC - Meteosat IR image
|
10 August 2001/12.00 UTC - Meteosat IR image
|
There are two examples in the "Case Study" part of this manual:
1. The case from 13 - 15 March 1998 which shows the development of a very pronounced Warm Front cloud band over the Eastern Mediterranean/Turkey. Its initial stages can be followed backwards to the Sahara where cloudiness in the typical form of a Warm Conveyor Belt can be observed.
|
13 March 2001/06.00 UTC - Meteosat IR image
|
13 March 2001/18.00 UTC - Meteosat IR image
|
|
14 March 2001/06.00 UTC - Meteosat IR image
|
14 March 2001/12.00 UTC - Meteosat IR image
|
|
15 March 1998/06 UTC - IR image; SatRep overlay: names of conceptual models; symbols: weather events (green: rain and showers, blue: drizzle, cyan: snow, purple: freezing rain, red: thunderstorm with precipitation, orange: hail, yellow: fog, black: no actual precipitation or thunderstorm with precipitation); lines: magenta: relative streams on 308 K, yellow: isobars, system velocity 273? 7 m/s
|
2. The case from 14 - 15 June 1998 (see Case Study 14 - 15 June 1998 ) which shows a Warm Front cloud band moving from SE Europe across Finland and the Scandinavian countries westward. The initial stages of cloudiness can be found over the Balkan Peninsula within a warm air mass.
|
13 June 1998/06.00 UTC - Meteosat IR image
|
13 June 1998/18.00 UTC - Meteosat IR image
|
|
14 June 1998/06.00 UTC - Meteosat IR image
|
14 June 1998/12.00 UTC - Meteosat IR image
|
|
15 June 1998/06 UTC - IR image; isobars (yellow) and relative streams (magenta) on 324K
|
