Cloud Structure In Satellite Images
The satellite image shows an anticyclonically curved synoptic-scale cloud band, connected to a cold front cloud band.
Appearance in the basic channels
- In ideal cases:
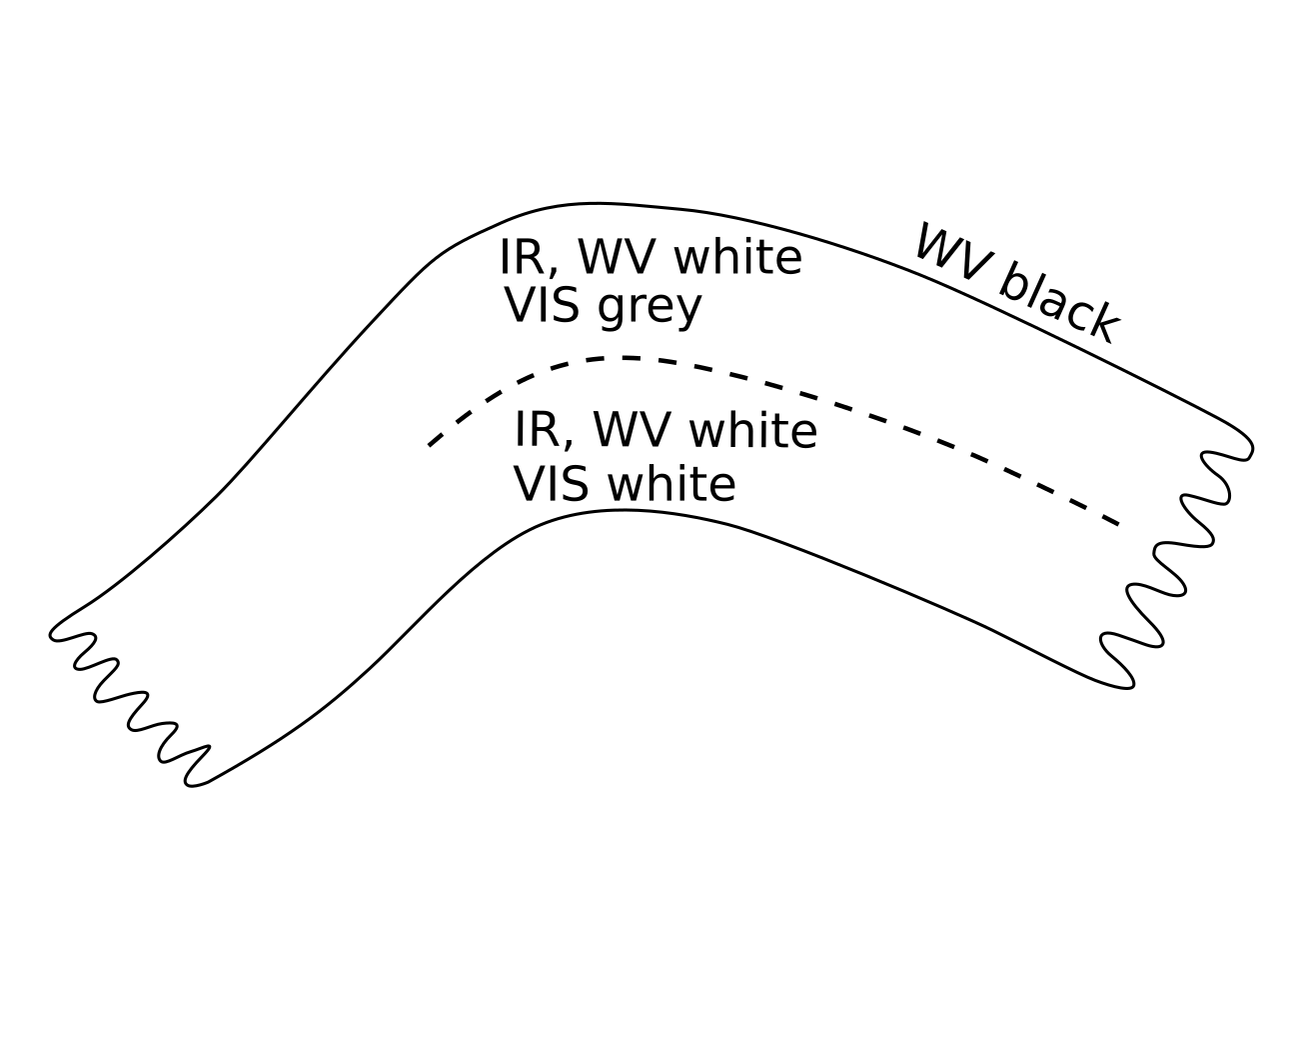
- in the VIS image the grey shades are generally bright at the rear edge becoming increasingly grey and dimmer towards the forward edge;
- in the IR image the grey shades of the cloud band are grey-white; in the ideal case, the brighter pixel values exist towards the forward and downstream cloud edge.
- In reality:
- very often no continuous cloud band exists but rather there are several cloud layers with broken clouds. Sometimes only high clouds exist;
- in the IR image several high-level white cloud areas overlay the lower, grey cloud layers (see Meteorological Physical Background).
- High and bright WV pixel values can be observed in the area of the frontal cloud band region.
- At the leading edge of the cloud band the WV image shows a sharp gradient from white to black indicating dry air along the cyclonic side of the jet.
Appearance in the basic RGBs:
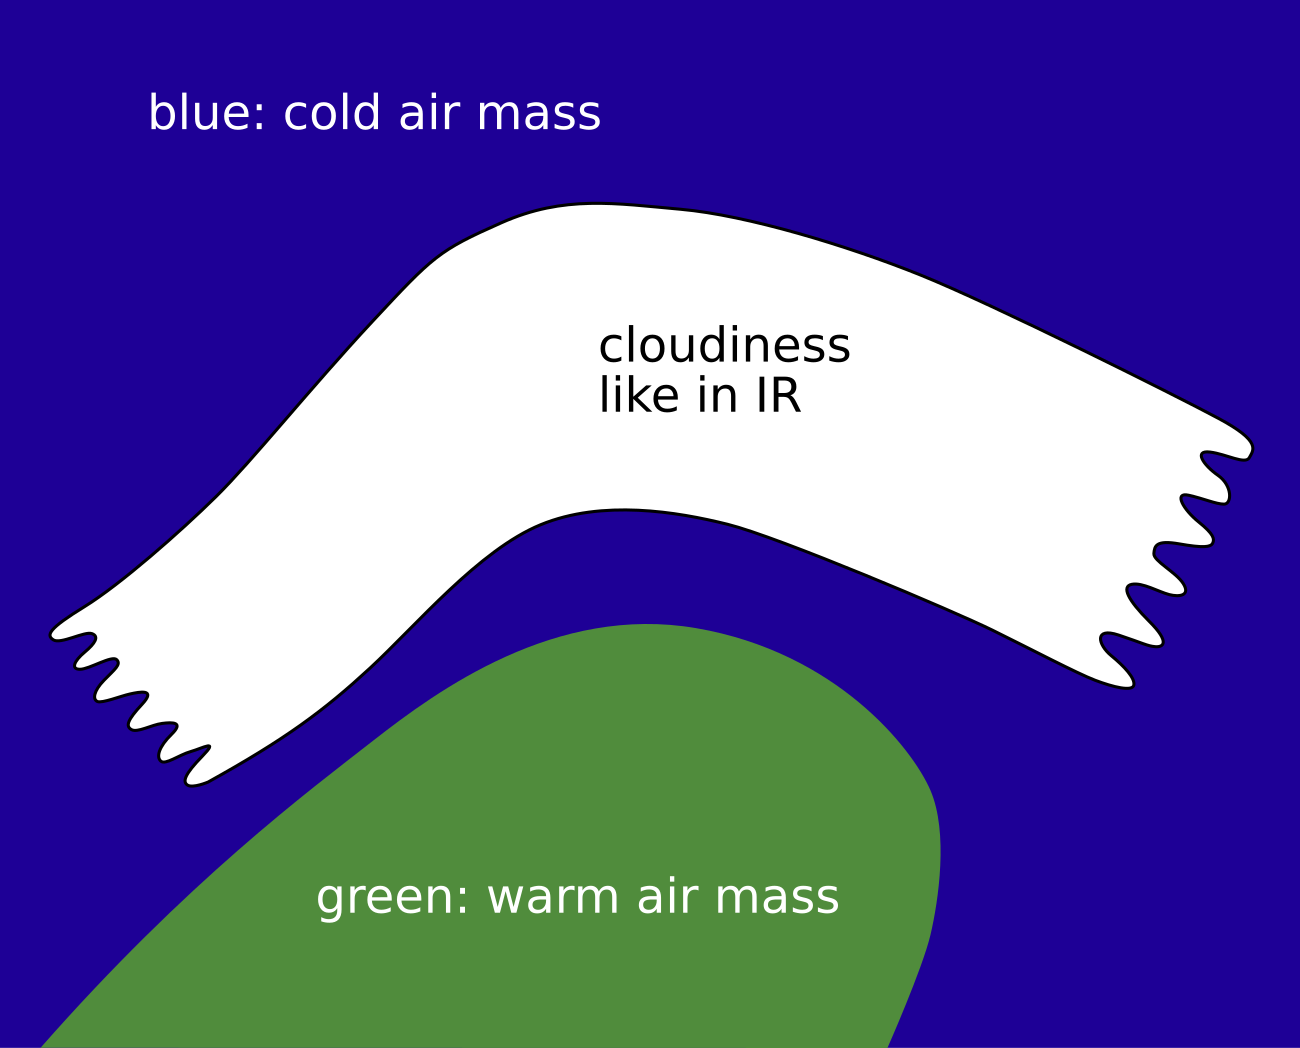
Airmass RGB
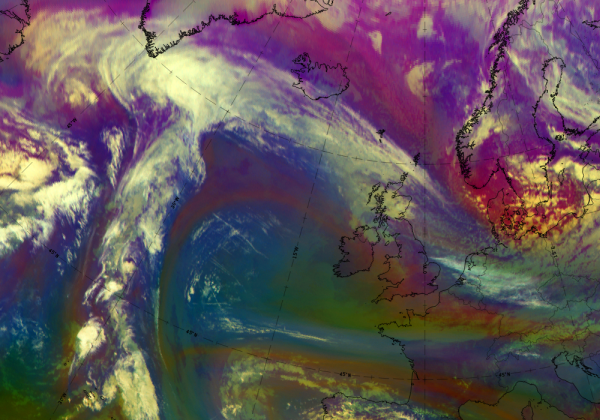
In front of the WF band blue colours indicate cold air masses and are a common feature. At the rear side, within the warm sector, the colour varies with a gentle gradient from greenish colours (representing warm air masses) to blue colours close to the rear edge of the WF band. The blue colours represent the frontal upgliding of warmer air over the originally cold air mass, as well as high humidity in upper-levels in these regions.
The texture of the clouds in the warm front band is very similar to their appearance in the IR image.
Dust RGB
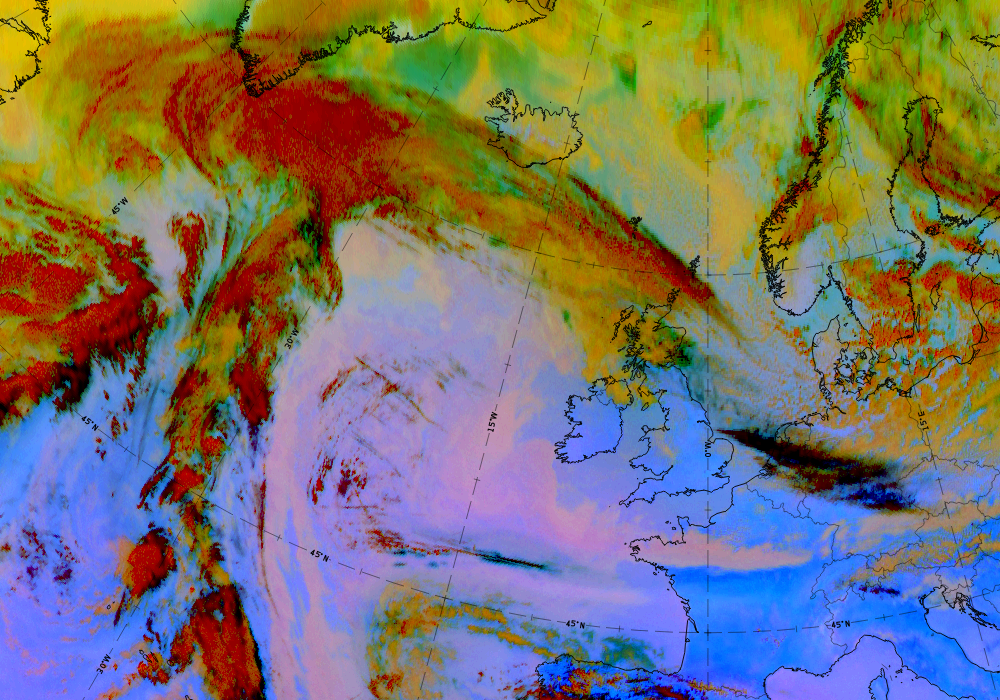
Blue to pinkish-blue colours can be seen where there is cloud free land or sea exists. There are other cloud patches, which exist in front of the cloud band and also in the warm sector. These are usually lower, especially in winter time when fog and stratus fields occur. These cloud configurations appear in different shades of ochre.
In the warm front band, the colours are dependent upon the thickness of the cloud. Thicker areas appear dark red (indicating thick ice cloud), lower cloud appear in yellow to ochre. Quite often the leading edge of the warm front cloud band is accompanied by a black filament or fibres which accompany the jet axis region.
 |
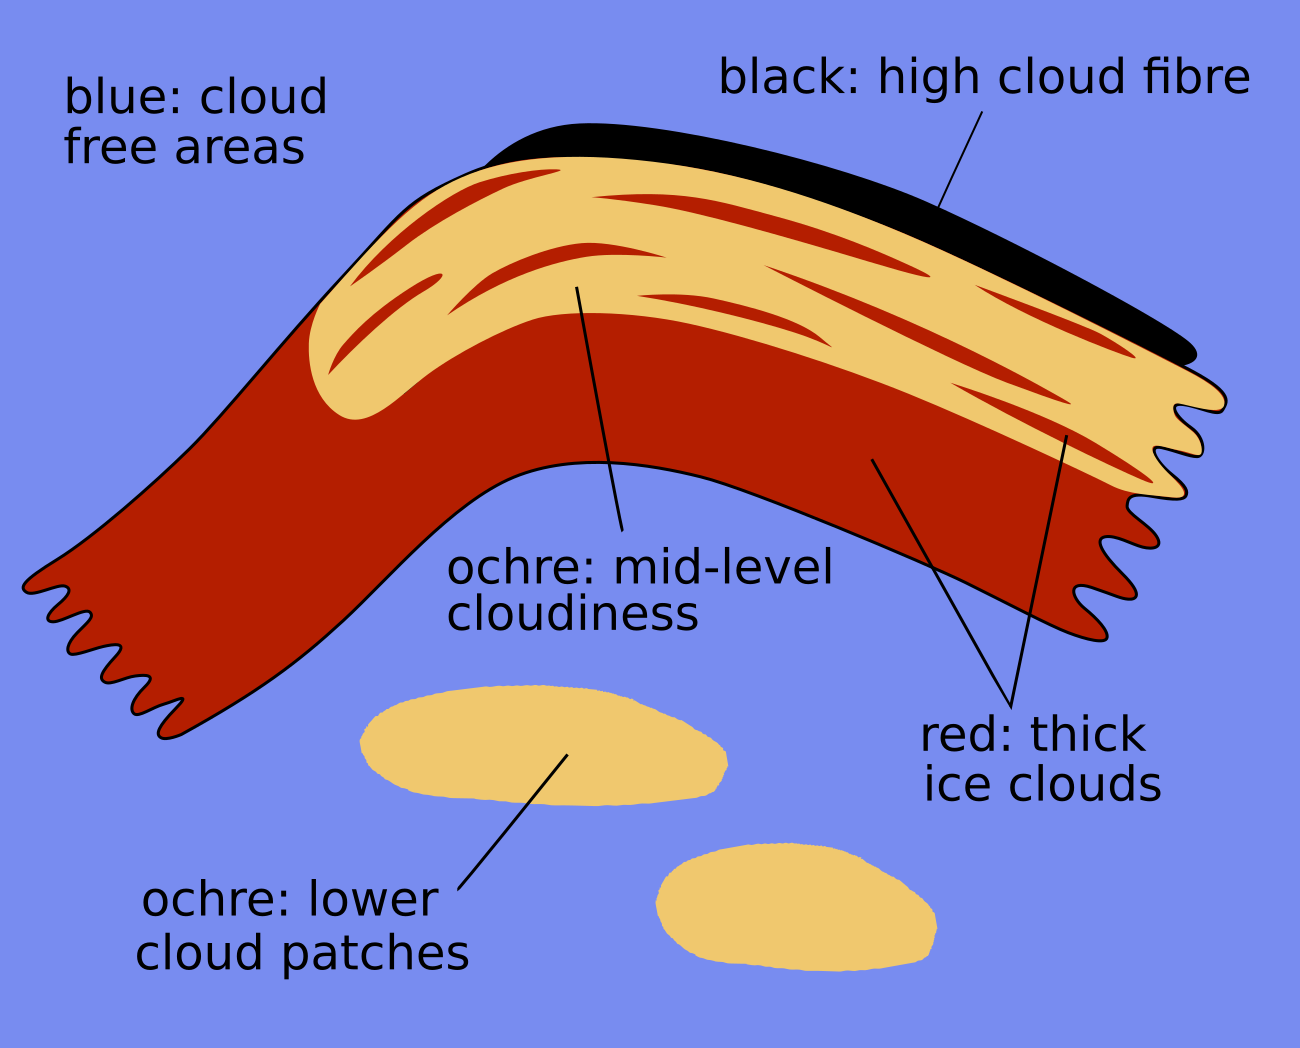 |
Legend: schematics for basic RGBs; Left: airmass RGB; right: dust RGB.
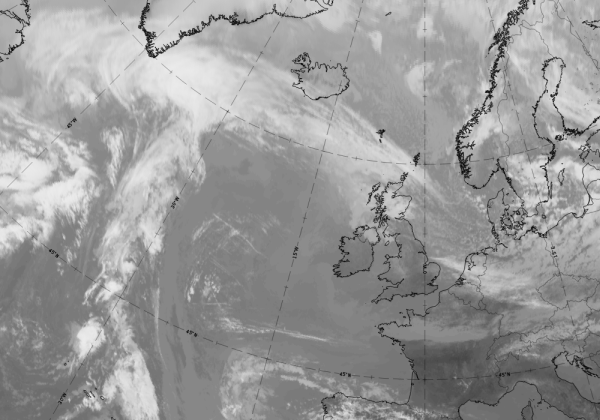
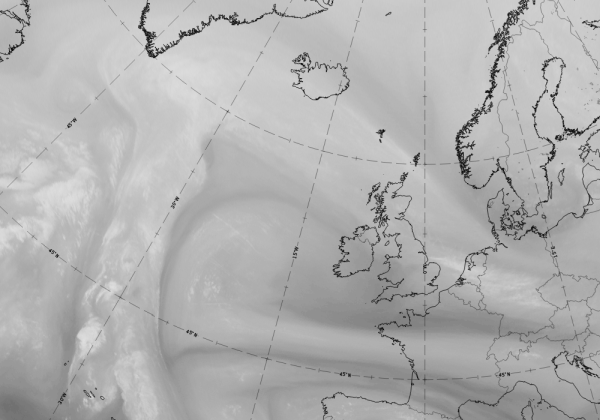
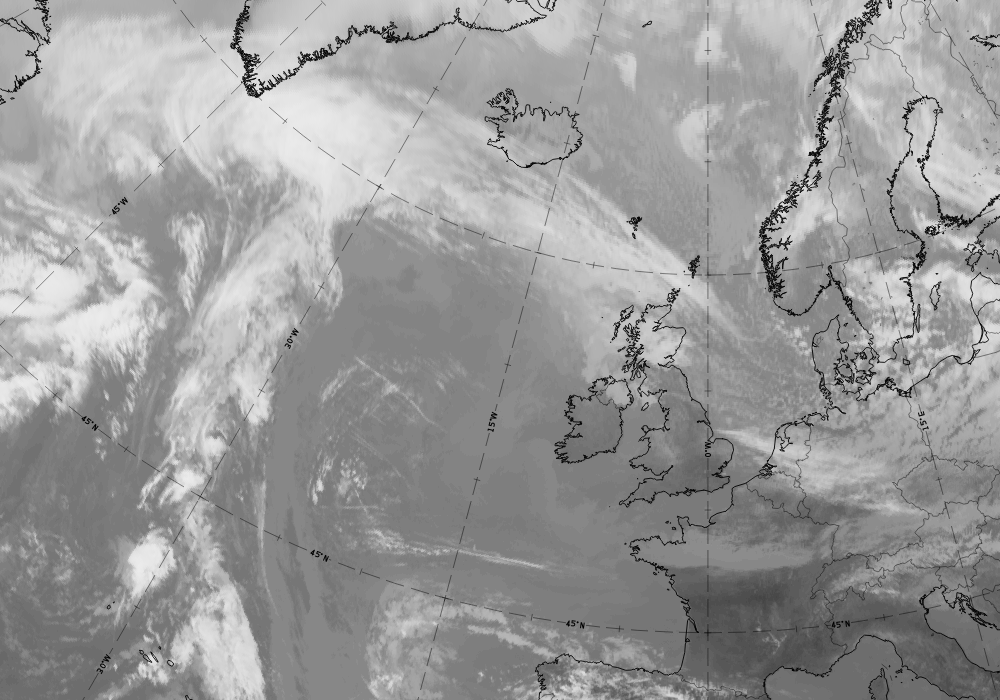
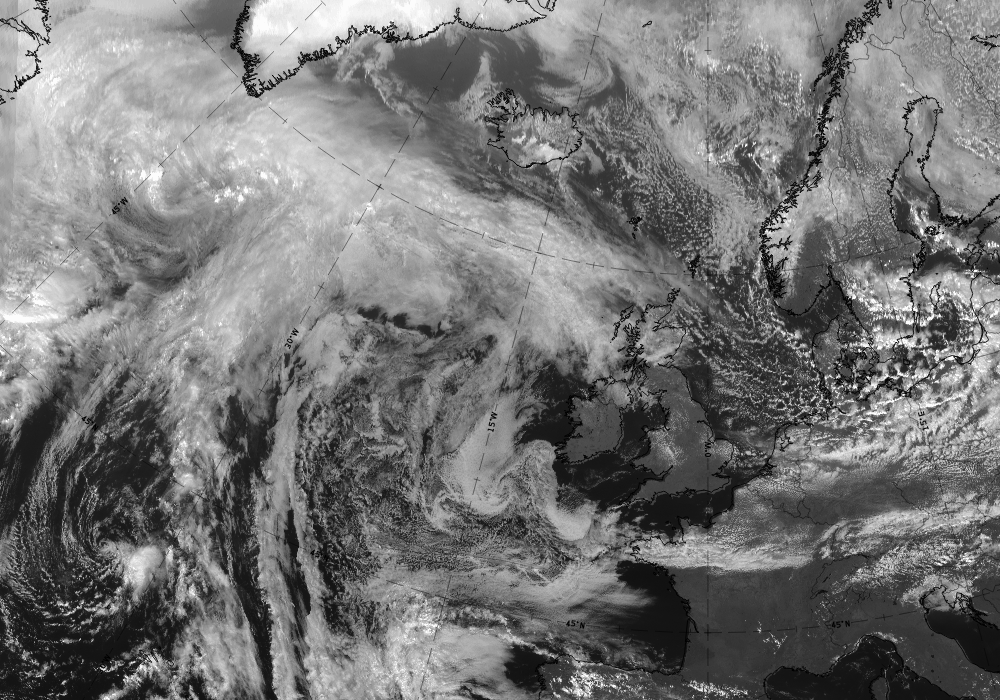
The case from 17 September 2019 at 12 UTC demonstrates a good example of a WF cloud band extending from the Atlantic, just south of Greenland and Iceland over to Northern Scotland.
|
|

|
|
Legend: 17 September 2019 at 12UTC: 1st row: IR (above) + HRV (below); 2nd row: WV (above) + Airmass RGB (below); 3rd row: Dust RGB + image gallery.
*Note: click on the Dust RGB image to access image gallery (navigate using arrows on keyboard).
| IR | Bright colours; a bright cloud filament or fibres at the leading edge. |
| HRV | Bright colours at the rearward edge of the cloud band. |
| WV | Bright band of high humidity with the bright cloud fibre at the leading edge; a dark stripe in advance of the cloud fibre. |
| Airmass RGB | Blue colours within and around the cloud band which indicate cold air; cloud patterns and textures similar to IR. |
| Dust RGB | Ochre colours indicate mid-level clouds; red stripes overlay thicker ice clouds; the stripe at the leading edge appears darker, almost black, indicating thin translucent high cloud. |