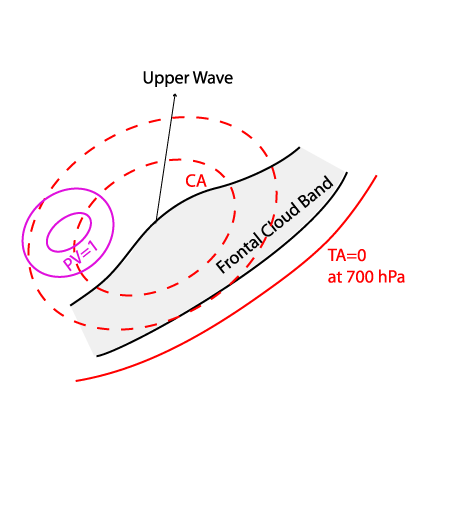
Key Parameters
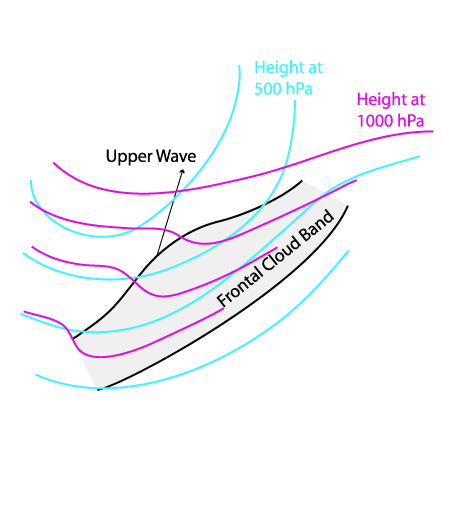
- Height contours at 500 and 1000 hPa:
- Surface and mid level height contours: similar appearance to a CF (see Cold Front ), no separate pressure minimum or deepening trough, normally associated with a "classical" Wave (see Wave )
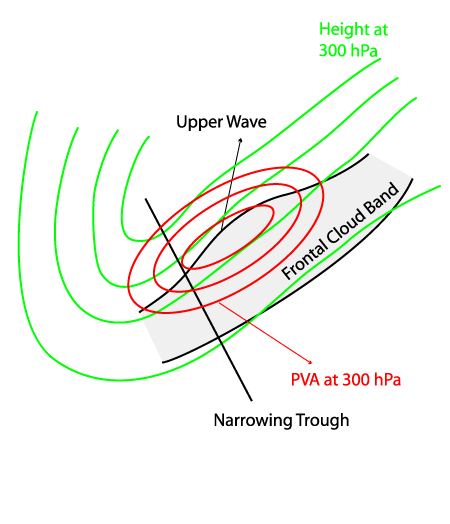
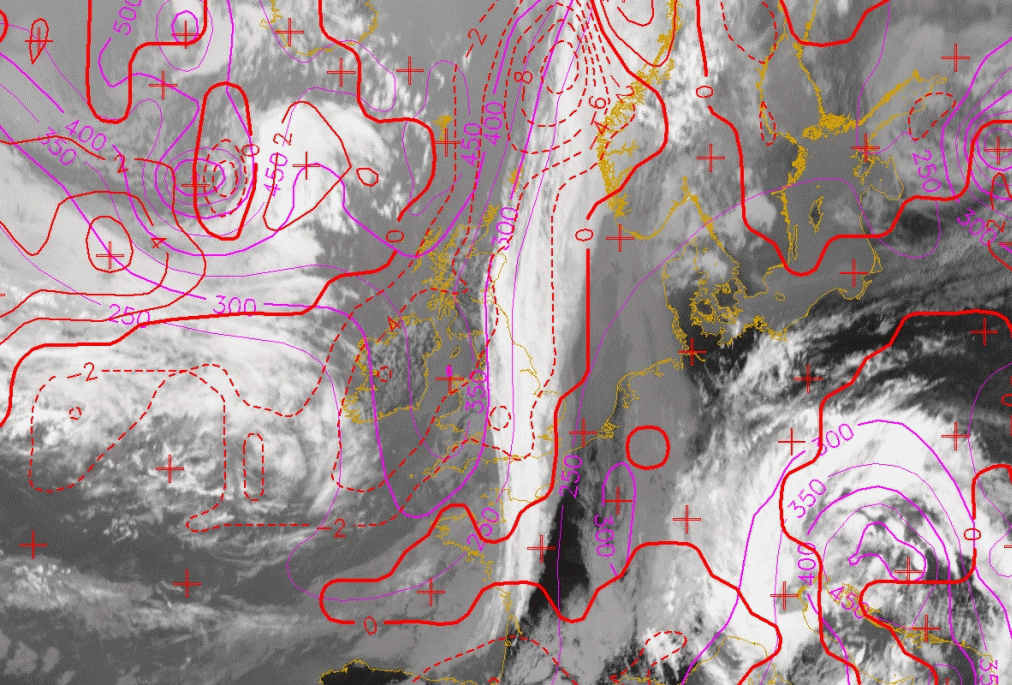
- Height contours at 300 hPa:
- Significantly sharp and deepening trough to the rear of the cloud band
- Vorticity Advection at 300 hPa:
- Distinct maximum caused by the advection of shear and curvature vorticity
- Also resulting from sharp trough to the rear
- Distinct advection of curvature vorticity through the stream field
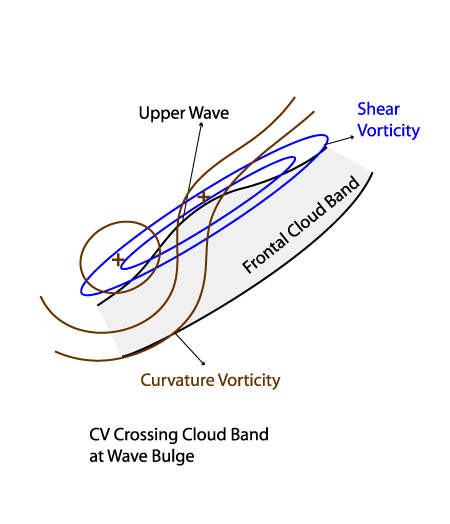
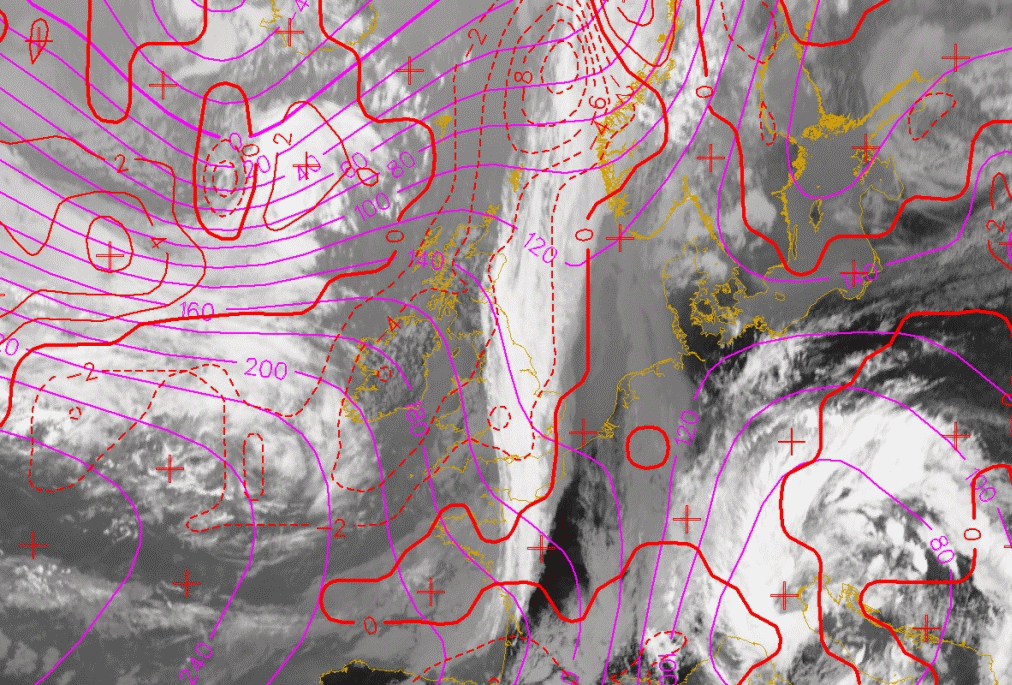
- Shear and Curvature Vorticity at 300 hPa:
- Isolines of Curvature Vorticity cross the cloud band at the Wave point at an acute or nearly right angle
- Shear vorticity: as in Cold Fronts, associated with a strong jet
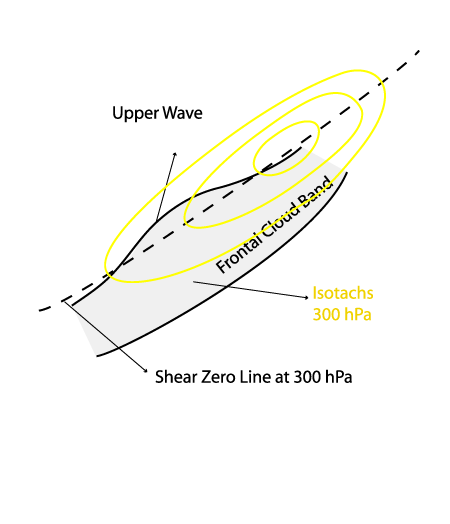
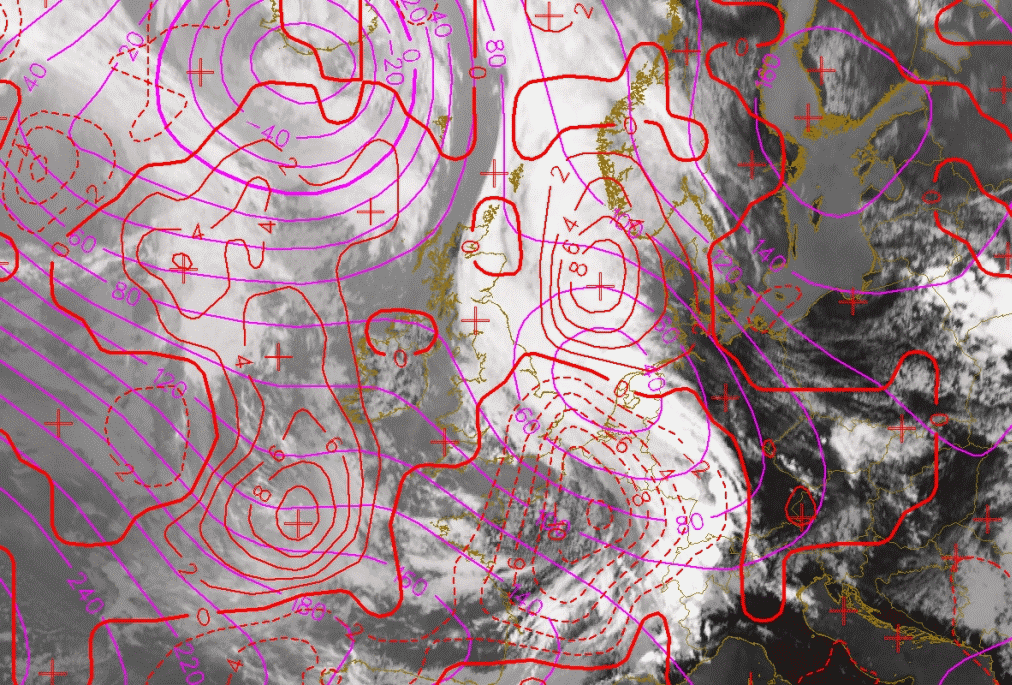
- Isotachs and Shear - Zero - Line at 300 hPa:
- Position of the Wave bulge relative to the Isotachs depends on the stage in its life cycle: during the initial stage the Upper Wave forms at the entrance region of the jet, later the Upper Wave bulge propagates towards the exit region
- The majority of Upper Waves studied show an extension of the cloud bulge into the side of cyclonic shear
- Potential Vorticity:
- Tropopause folding to the rear of the cloud band upwind of the Wave bulge (PV anomaly)
- PV=1 has protruded downward to about 500 to 400 hPa during the initial stage
- PV anomaly slightly weakening during life cycle (no further development of Upper Wave)
- Temperature Advection at 700 hPa:
- Cold Advection is associated with the Upper Wave during the whole life cycle
Height contours at 1000 and 500 hPa
|
22 August 2005/12.00 UTC - Meteosat 8 IR 10.8 image; cyan: height contours 500 hPa, magenta: height contours 300 hPa
|
|
|
|
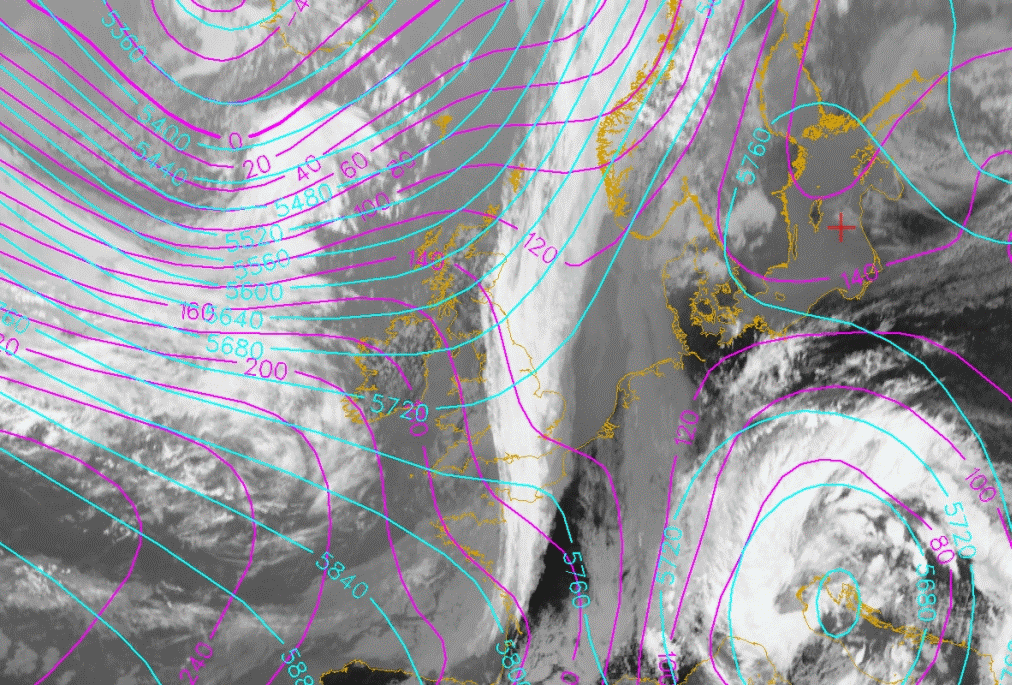
Height contours at 300 hPa and PVA 300 hPa
|
22 August 2005/12.00 UTC - Meteosat 8 IR 10.8 image; green: height contours 300 hPa, red: positive vorticity advection (PVA) 300 hP
|
|
|
|
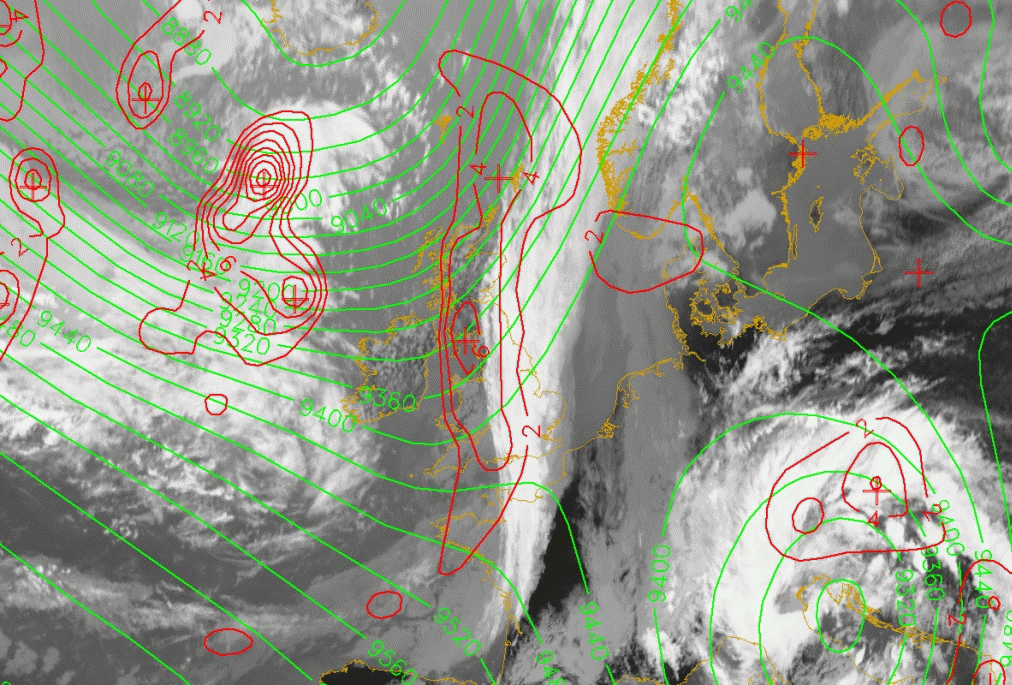
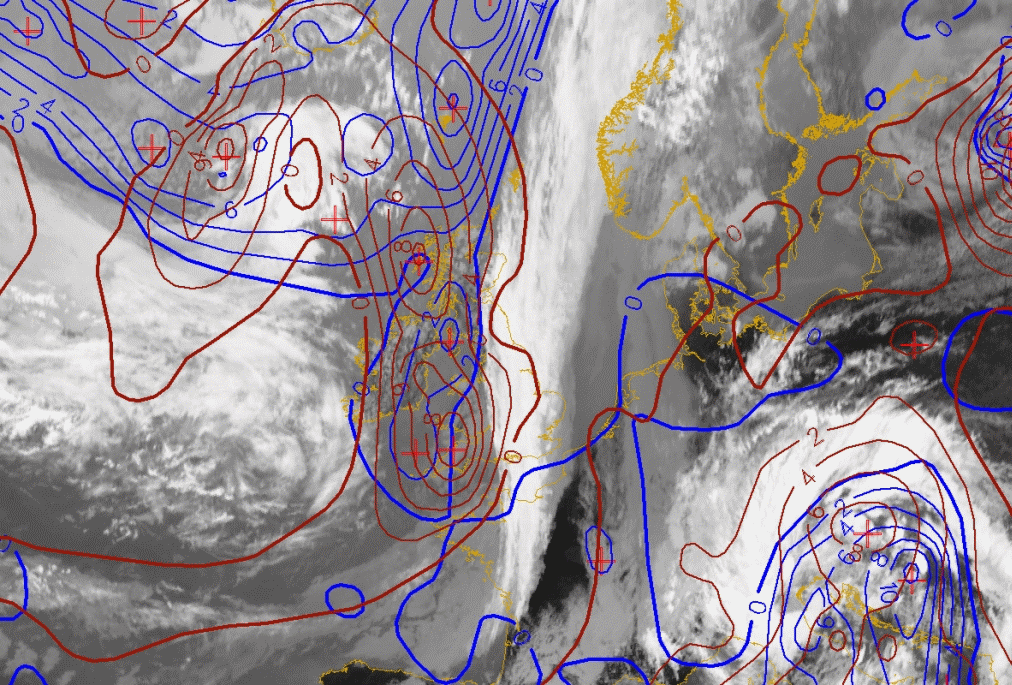
Shear and Curvature Vorticity at 300 hPa
|
22 August 2005/12.00 UTC - Meteosat 8 IR 10.8 image; blue: shear vorticity 300 hPa, brown: curvature vorticity 300 hPa
|
|
|
|
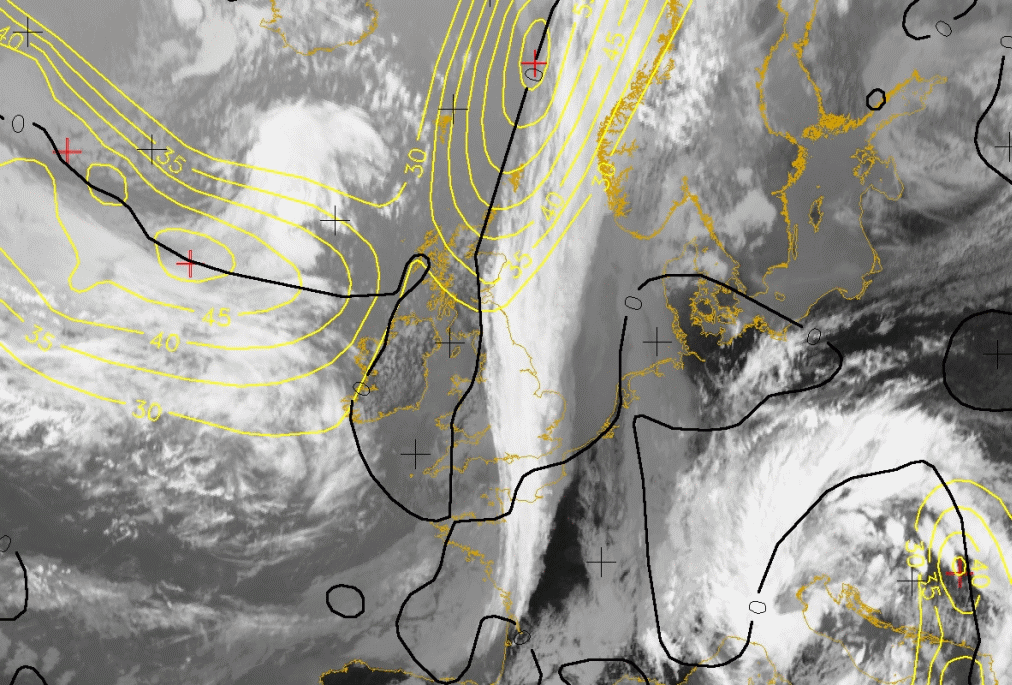
Isotachs and Shear - Zero - Line at 300 hPa
|
22 August 2005/12.00 UTC - Meteosat 8 IR 10.8 image; black: zero line of shear vorticity 300 hPa, yellow: isotachs 300 hPa
|
|
|
|
Potential Vorticity and TA 700
|
22 August 2005/12.00 UTC - Meteosat 8 IR 10.8 image; magenta: potential vorticity, red: temperature advection 700 hPa
|
|
|
|
Distinction between Wave and Upper Wave according to the key parameters
Most parameters show similar distribution and characteristics, except:
| Upper Wave | Wave |
|
|
|
|
|
|
|
|
The set of IR images below show the differences described in the above table. Below left is the case of an Upper Wave, below right the case of a Wave. While the Upper Wave has no separate surface trough superimposed, the Wave case from 4 July 2005 shows a distinct surface low as well as maximum of warm advection superimposed upon the Wave bulge.
|
22 August 2005/12.00 UTC - Meteosat 8 IR 10.8 image; red: temperature advection 700 hPa, magenta: height contours 1000 hPa
|
04 July 2005/12.00 UTC - Meteosat 8 IR 10.8 image; red: temperature advection 700 hPa, magenta: height contours 1000 hPa
|
|
|