Table of Contents
Cloud Structure In Satellite Images
An Upper Wave is a smooth Wave feature accompanied by a rather flat convex bulge of clouds on the rearward side of a frontal cloud band.
At first sight, the upper wave seems to look similar to a classical wave - but a more detailed examination reveals some differences (see Wave ):
- often the Upper Wave bulge as seen in satellite imagery is less pronounced than the "classical" Wave;
- there is generally less amplification than with a "classical" Wave;
- an Upper Wave propagates rapidly along the rear side of the frontal cloud band;
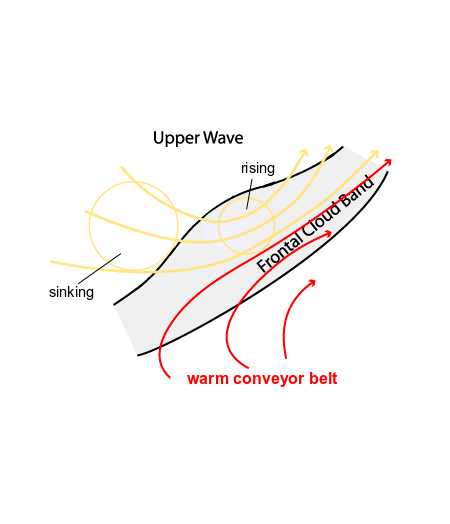
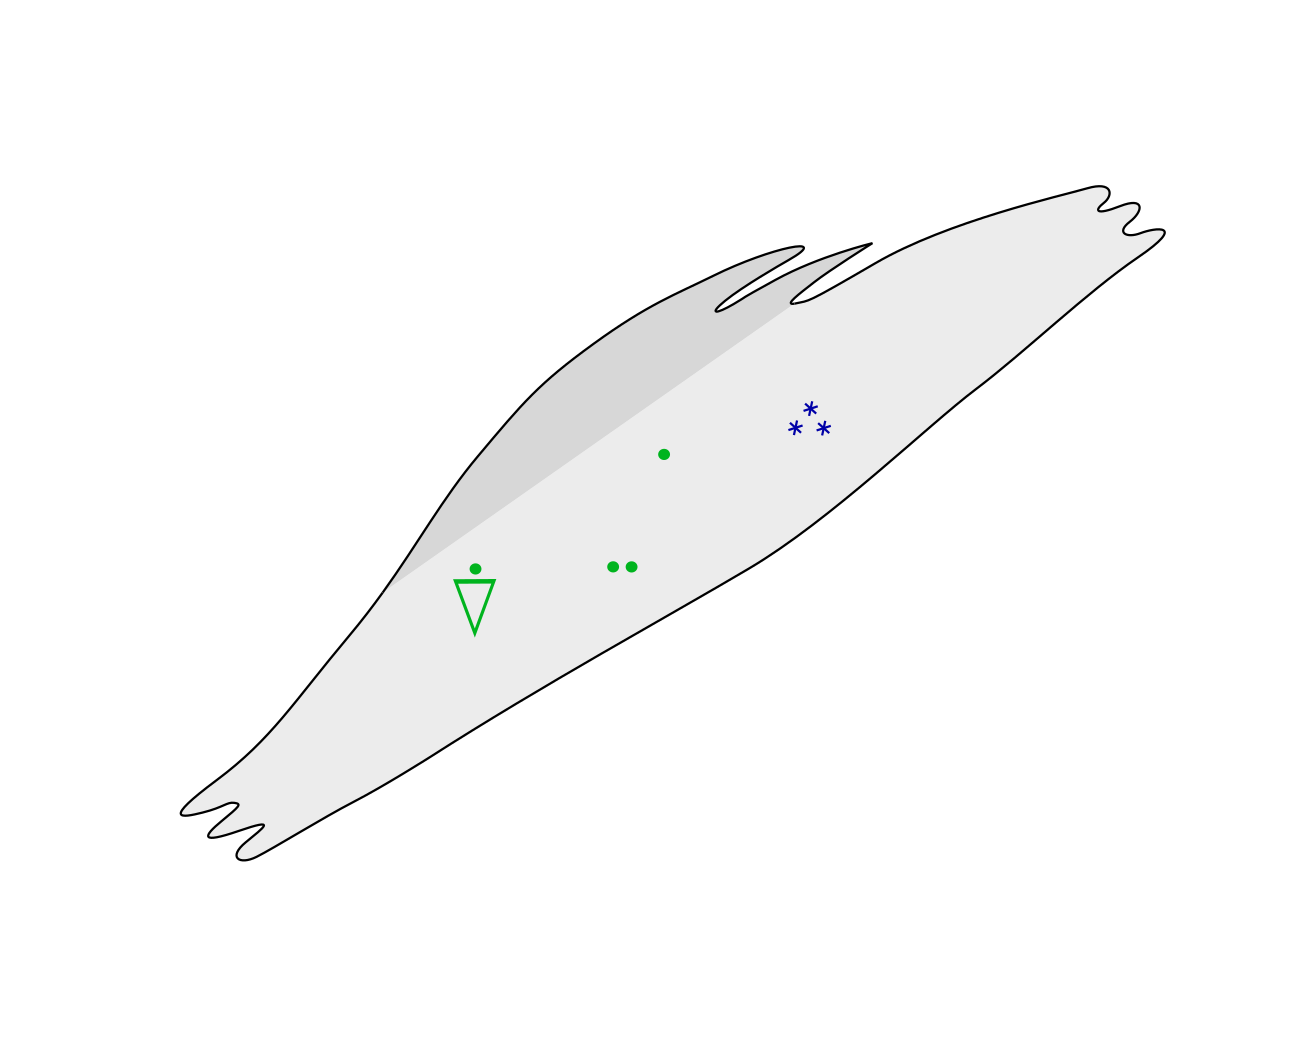
- in an Upper Wave there is often a fibre cloud, indicating strong upper level winds (schematic below).
Appearance in the basic channels
- IR 10.8 imagery
- Convex cloud bulge at the rear of a frontal cloud band, often large elongation of the cloud bulge
- Grey to white regions due to high level clouds. The wave bulge appears brighter than the surrounding frontal clouds
- Sharp edges to the cold air cloud behind the front
- Fibres indicating strong upper winds or a jet streak
- WV 6.2 imagery:
- Bright grey or white due to the height of the cloud bulge, which appears more enhanced (brighter) in relation to the surrounding frontal cloud band
- Sharp edges to the black dry zone to the rear of the front
- WV dark zone at the rear, indicating sinking of dry air from the stratosphere
- VIS 0.6 imagery:
- White due to the thickness of the cloud bulge
- Fibrous characteristics due to the high-level clouds
Appearance in the basic RGBs:
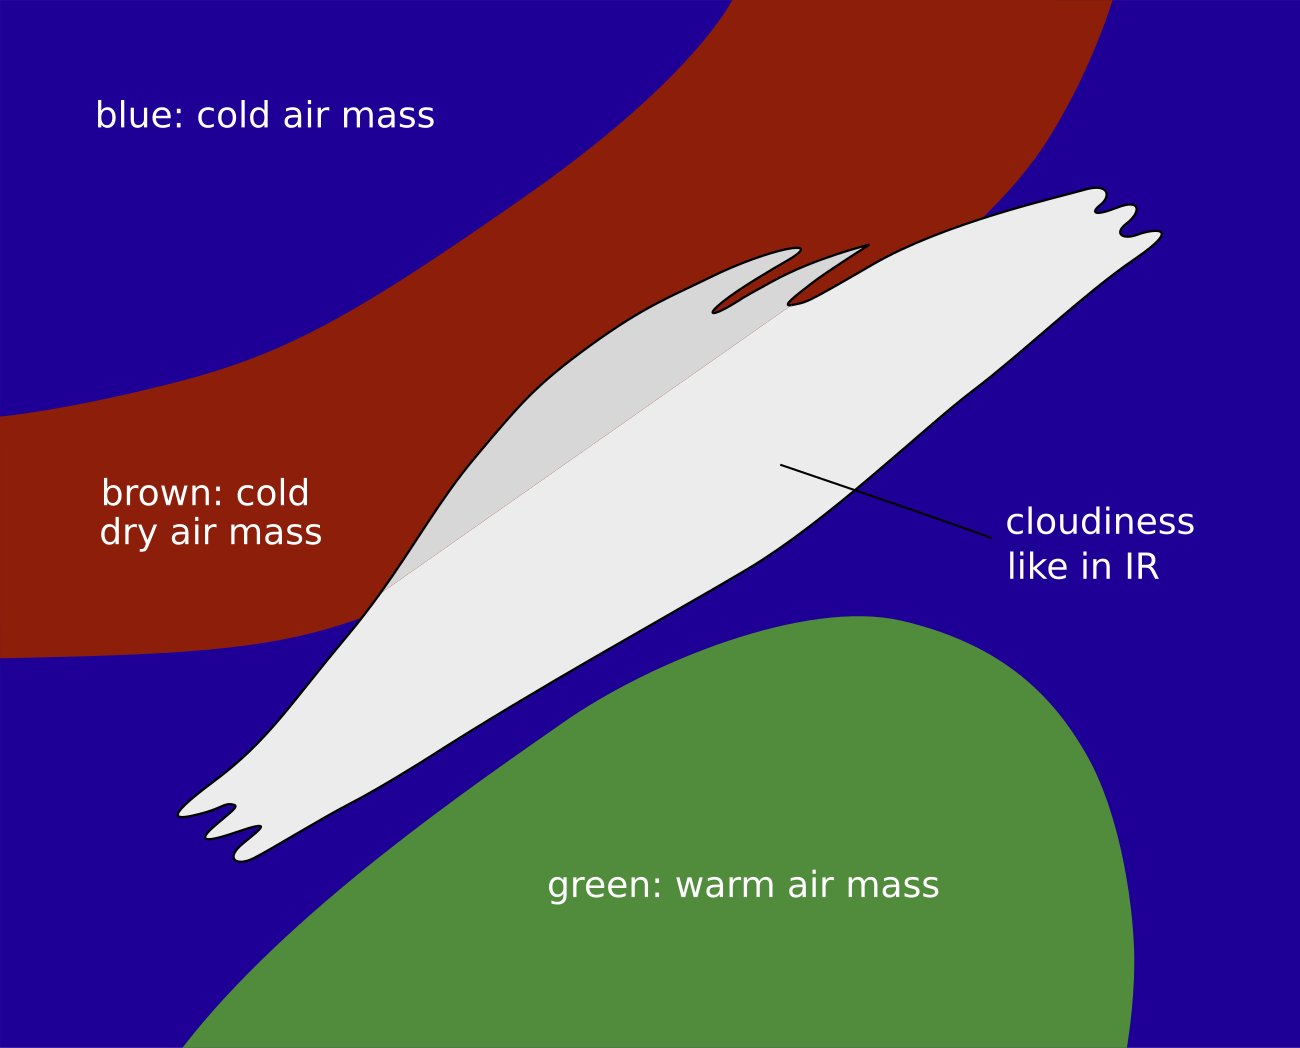
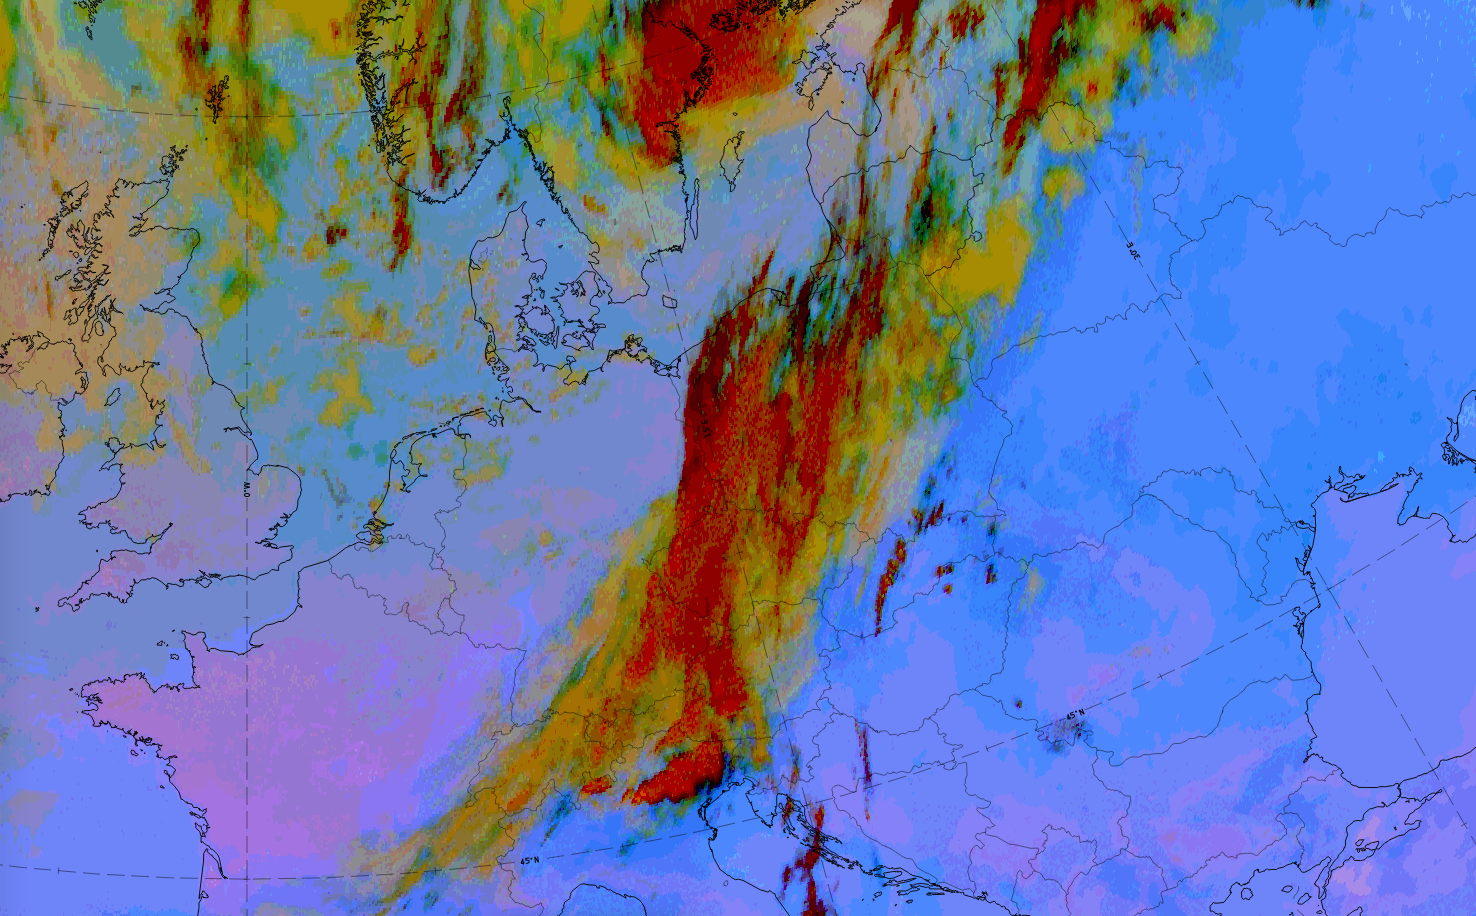
Airmass RGB
The most striking features around the cloud band of the cold front and the upper wave is the dark-red stripe along the rearward edge. It indicates cold, dry air which is sinking. Further westward and to the north, blue colours overwhelm the image, indicating the cold air present in that region. In the southern and south-eastern regions, greenish colours indicate the warmer air masses that exist there.
The clouds look very similar to the appearance in the IR image.
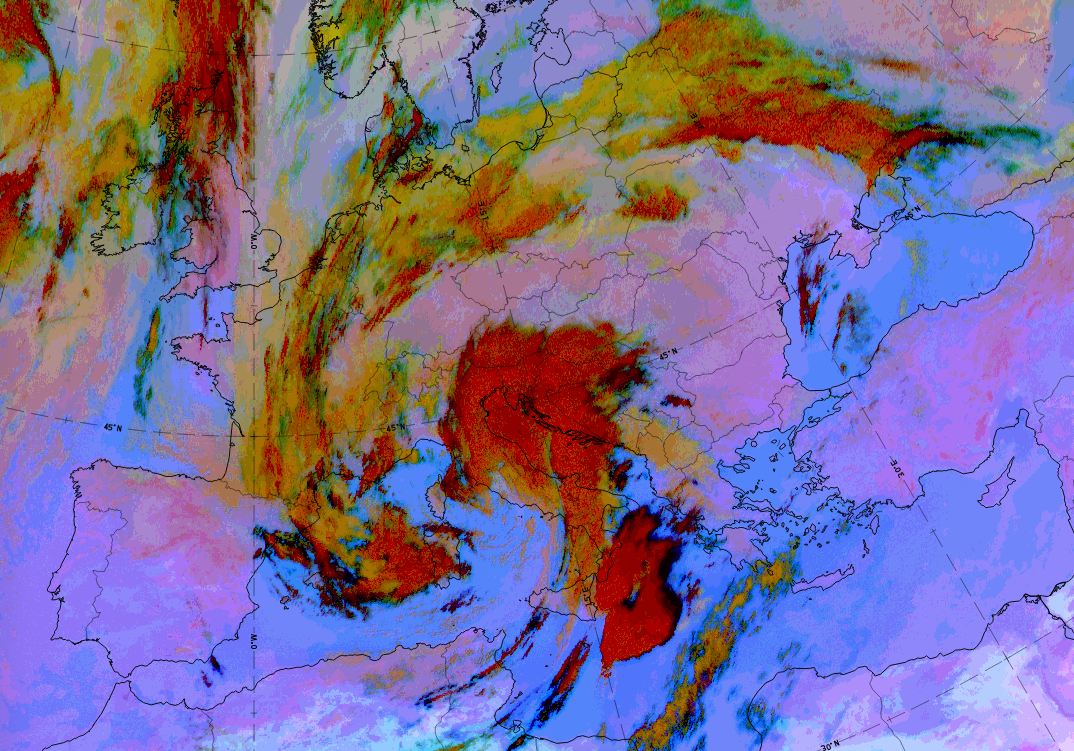
Dust RGB
Around the cold front cloud band and the cloud bulge of the upper wave there are blue colours where there is cloud free ground. Embedded cloud systems in that region are mostly ochre.
The cloud bulge of the upper wave is mostly dark-red or dark-red above ochre colours. This indicative of thick ice cloud above the mid-level cloud, belonging to the frontal cloud band. In most cases the rearward edge of the cloud bulge is accompanied by a black cloud fibre which represents the cloud fibre at the jet axis.
 |
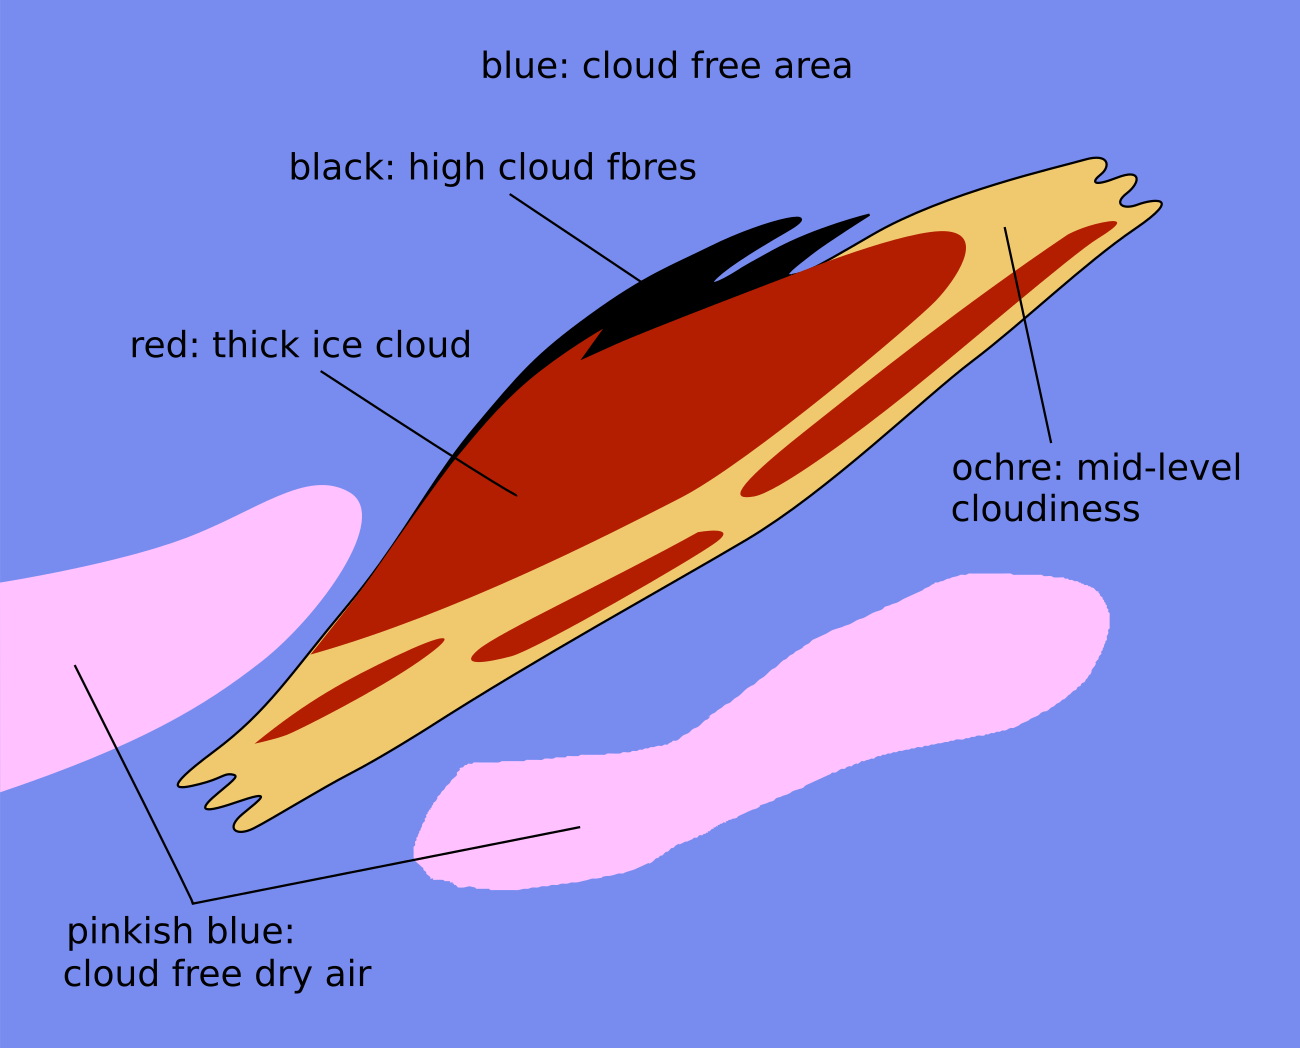 |
Legend: Basic RGB schematics.
Left: Airmass RGB; right: Dust RGB.
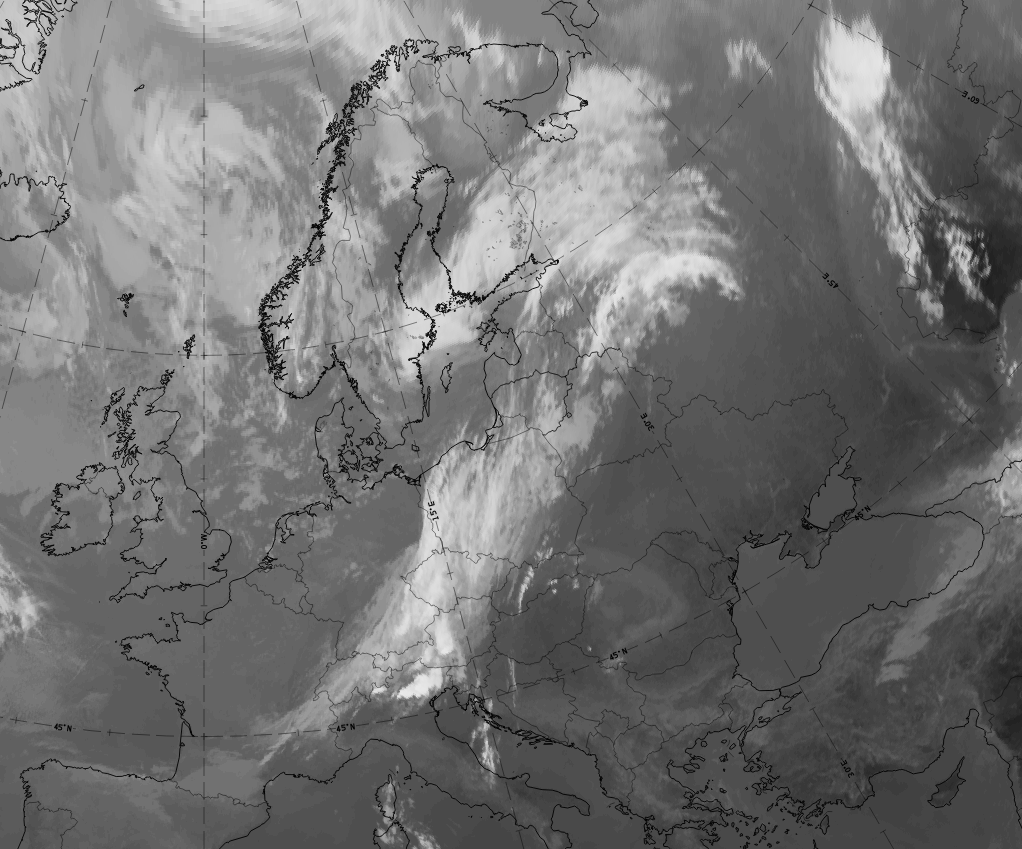
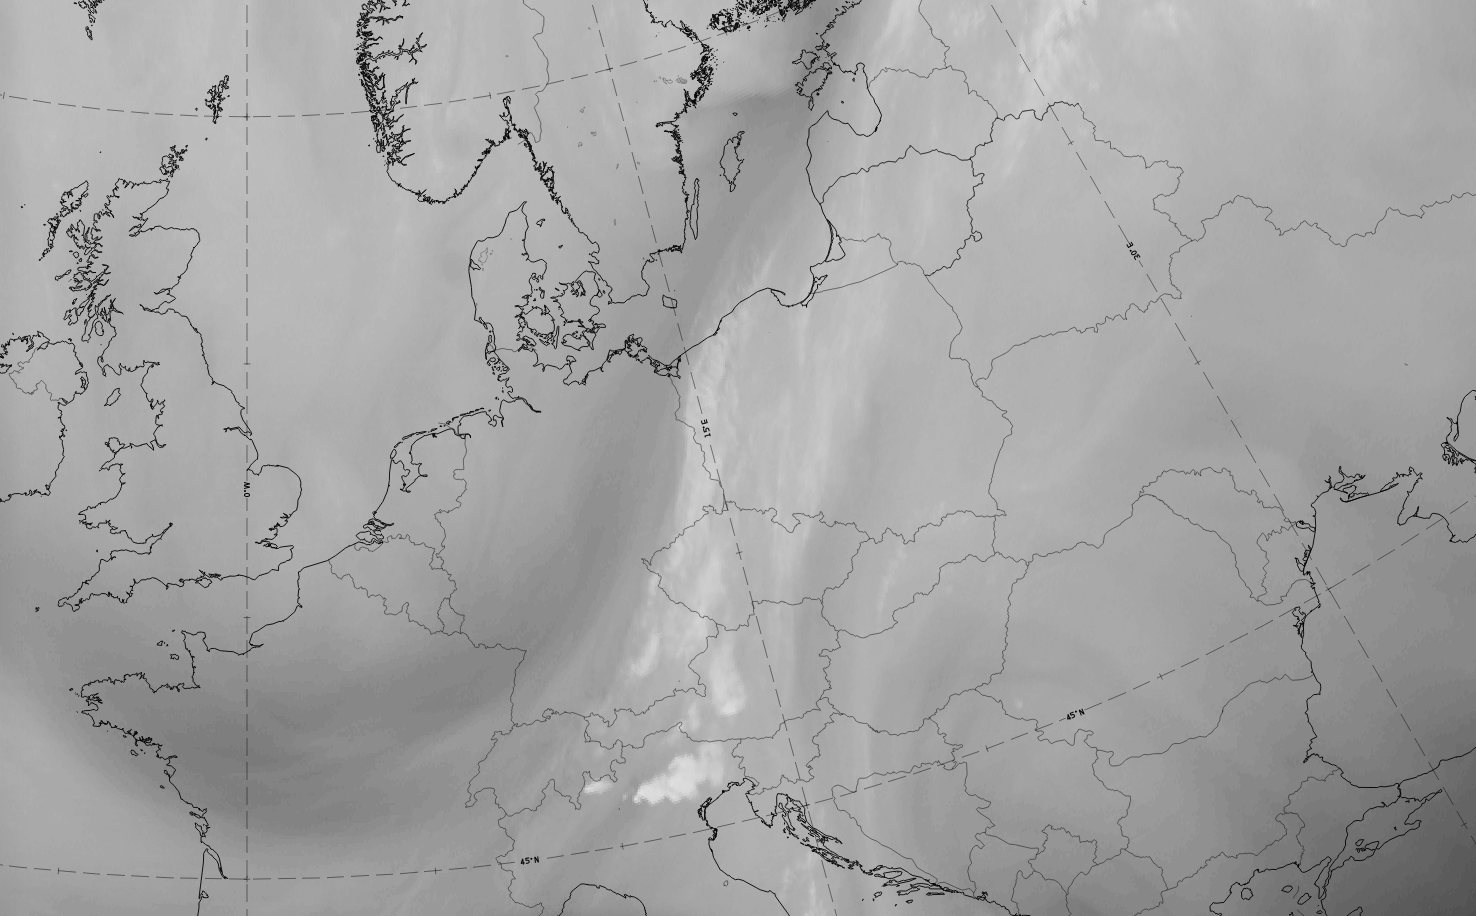
The case from 11 July 2020 at 06 UTC is an example of an Upper Wave in a late development stage.
|
|


|
|

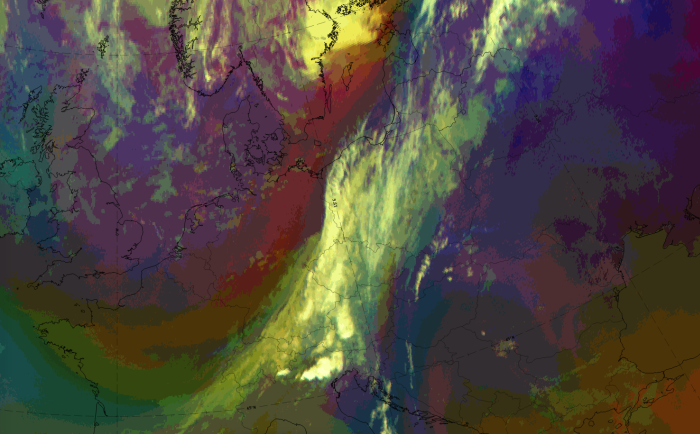
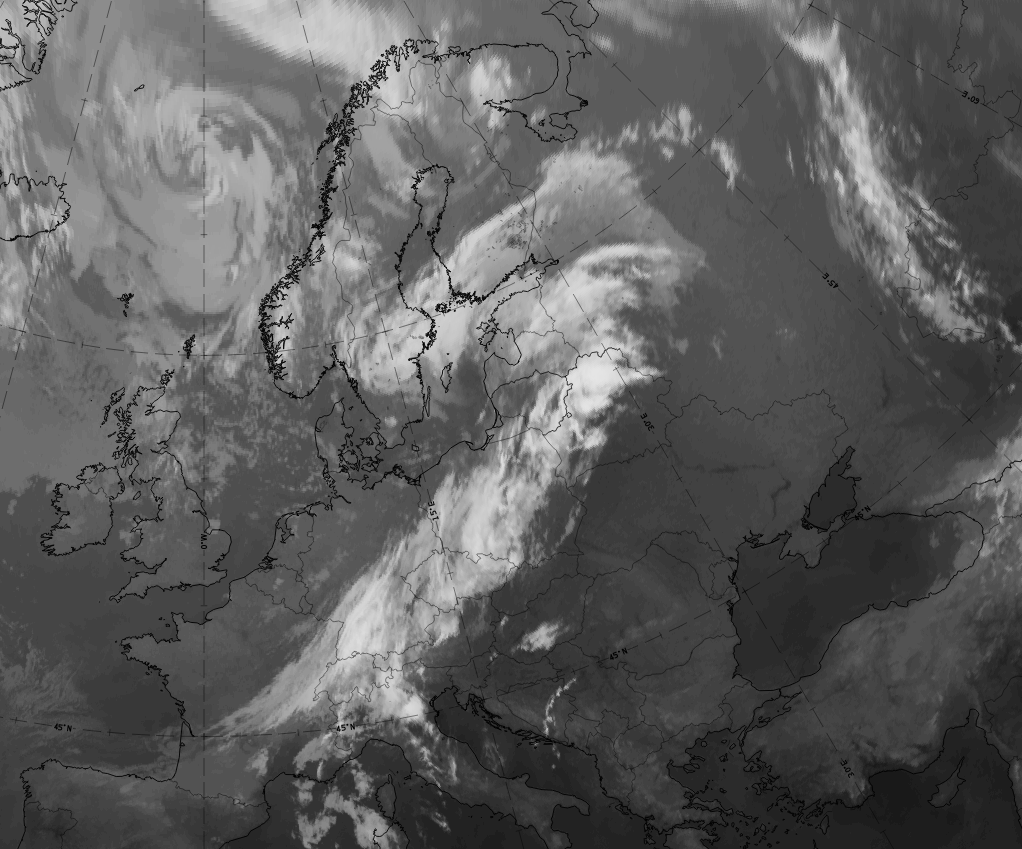
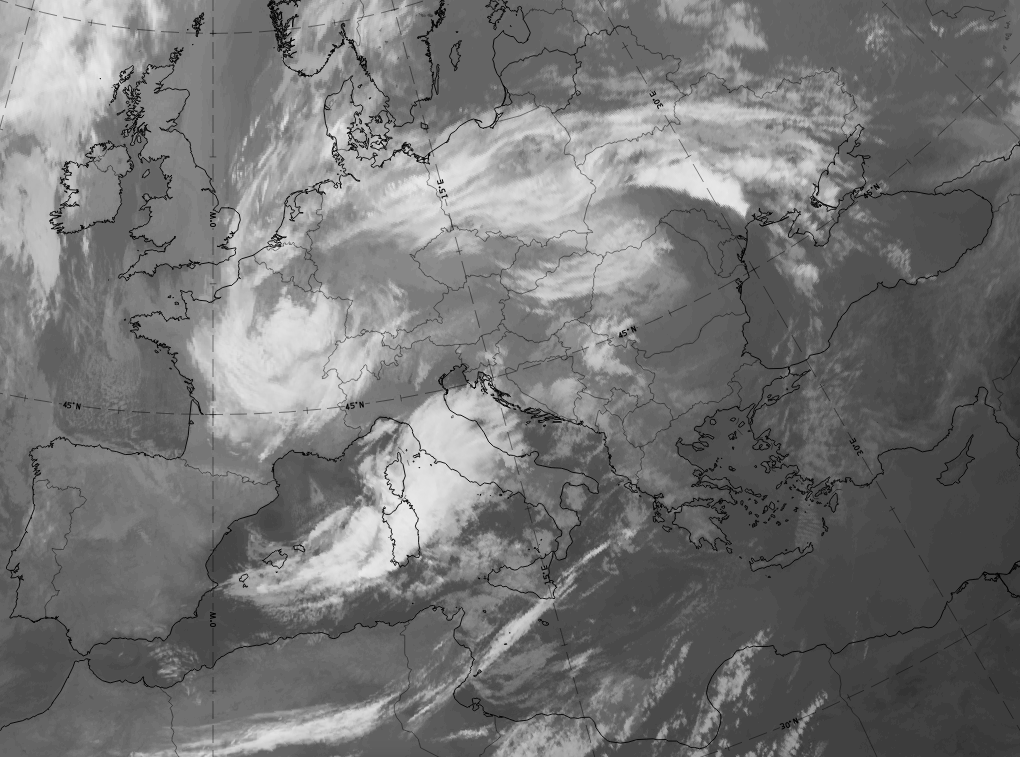
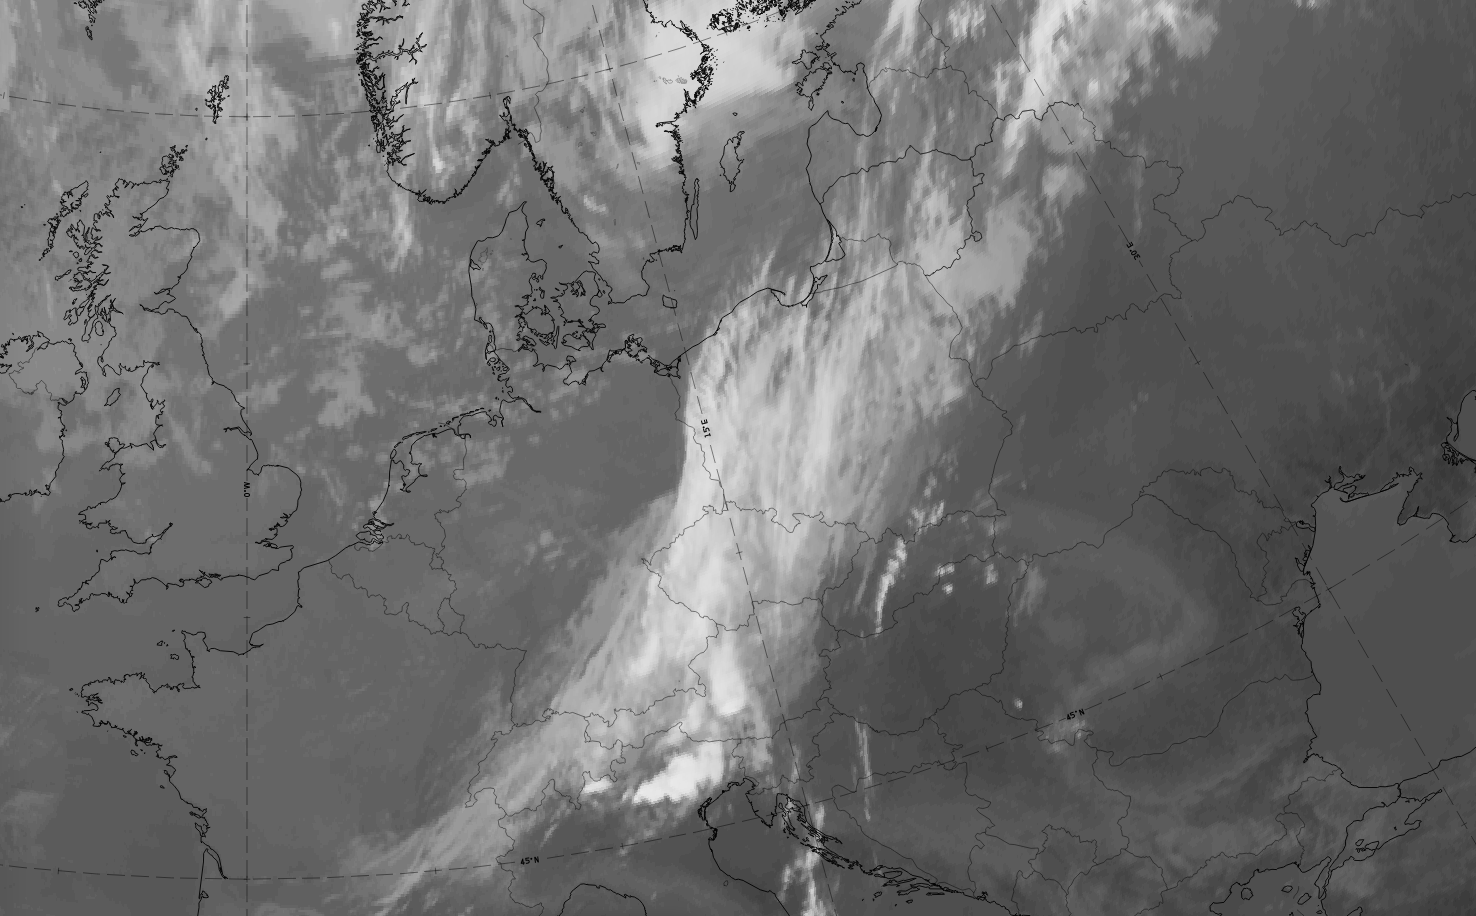
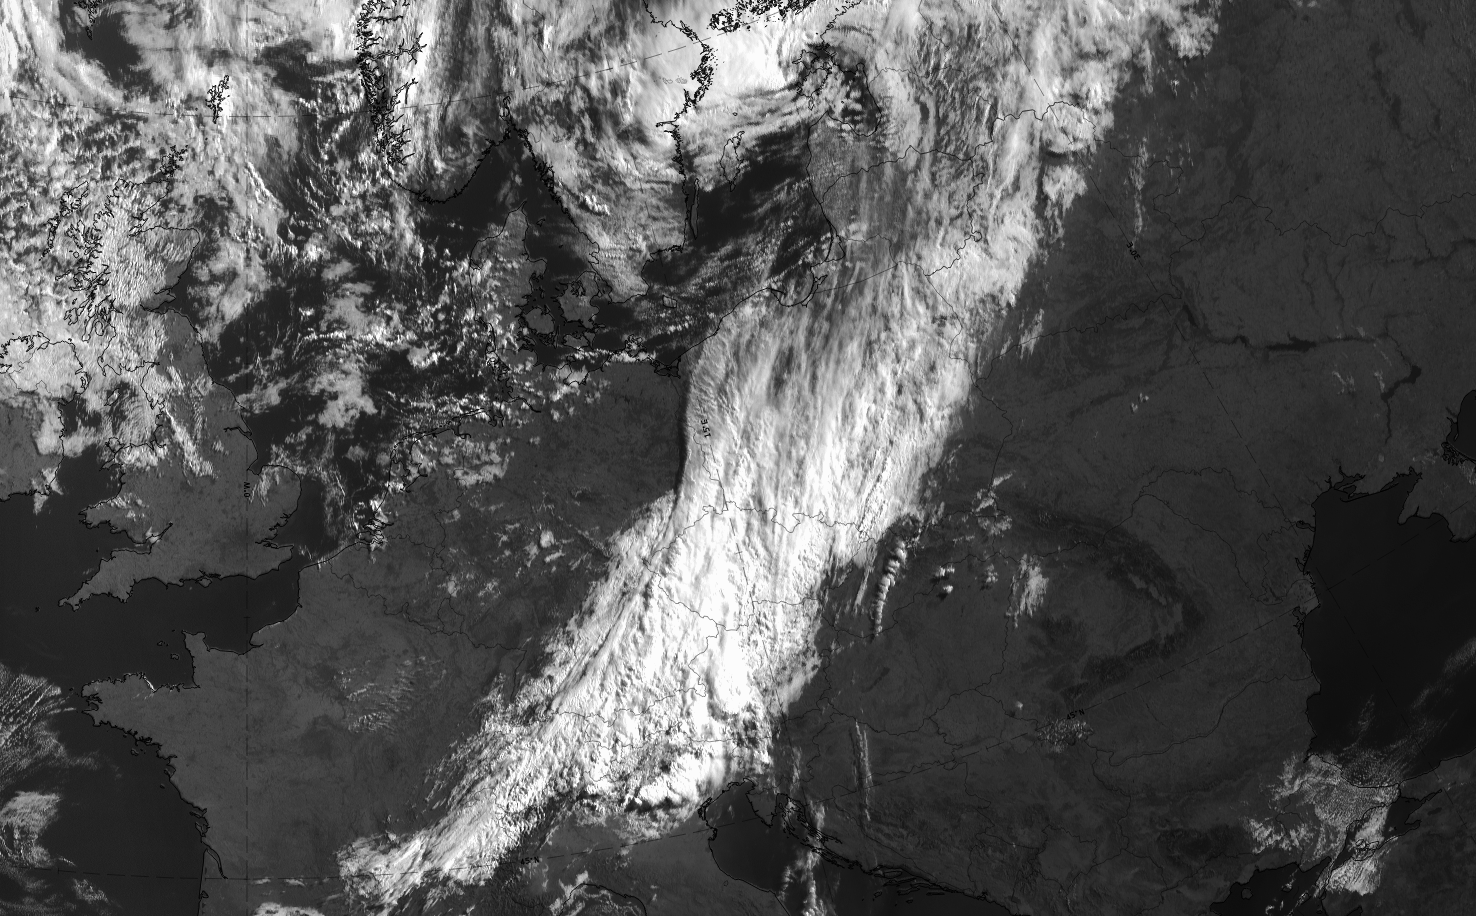
11 July 2020 at 106 UTC: 1st row: IR (above) + HRV (below); 2nd row: WV (above) + Airmass RGB (below); 3rd row: Dust RGB + image gallery.
*Note: click on the image to access the image gallery (navigate using arrows on keyboard).
| IR | White to light grey cloud bulge; lumpy in appearance; cloud fibre at rearward edge extending from Czech Republic northward to northern Poland; frontal cloud band to the east with grey colours. |
| HRV | Cloud bulge of upper wave is mostly grey. White colours in the frontal cloud band to the east. |
| WV | Light grey colours in the cloud bulge of the upper wave; dark stripe along rearward edge of cloud band and upper wave indicating sinking dry air. |
| Airmass RGB | Cloud band and cloud bulge of the upper wave appears similar to IR; dark-brown stripe along the rearward edge of the cloud band and cloud bulge, corresponding to the dark stripe in WV that indicates sinking dry air. |
| Dust RGB | In the cloud bulge of the upper wave, dark-red colours dominate and indicate thick ice cloud. The frontal cloud band is mostly ochre for mid-level clouds. |
 Loop: 22 August 06.00 - 00.00 UTC hourly image loop Loop: 22 August 06.00 - 00.00 UTC hourly image loop
|
Distinction between Wave and Upper Wave according to appearance in satellite images
A Wave and an Upper Wave often look similar in satellite imagery. In order to distinguish between them one can highlight and recognise a number of differences.
| Upper Wave | Wave |
|---|---|
| More elongated flat cloud bulge. | Distinct, more amplified cloud bulge. |
| Sharp edge to the rear, fibre cloud common. | Fibre cloud less common. |
| Multi-layered or high non-convective cloud. | Multi-layered cloud, convective cells often embedded. |
| Distinct, relatively fast propagation along the rearward side of the frontal cloud band. | Slow propagation; possible further cyclogenesis. |
 |
 |
| Distinct, relatively fast propagation along the rearward side of the frontal cloud band. | Slow propagation; possible further cyclogenesis. |
 11 July 2020 at 00 |
 27 September 2020 at 06 UTC |
 11 July 2020 at 06 UTC |
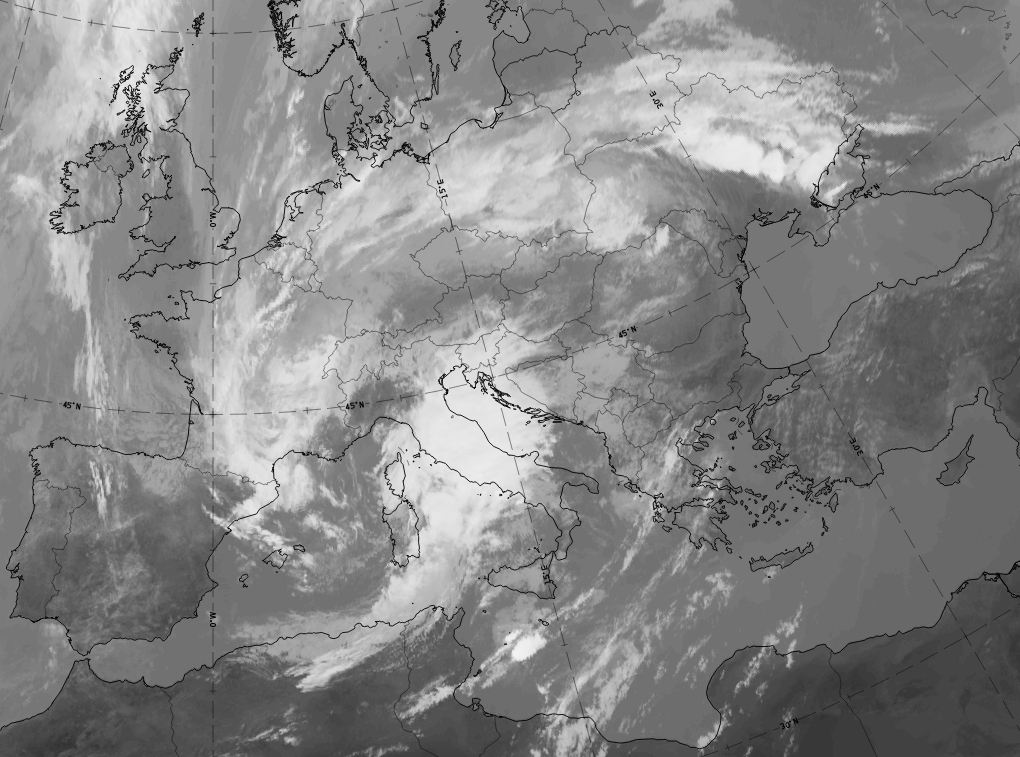 27 September 2020 at 12 UTC |
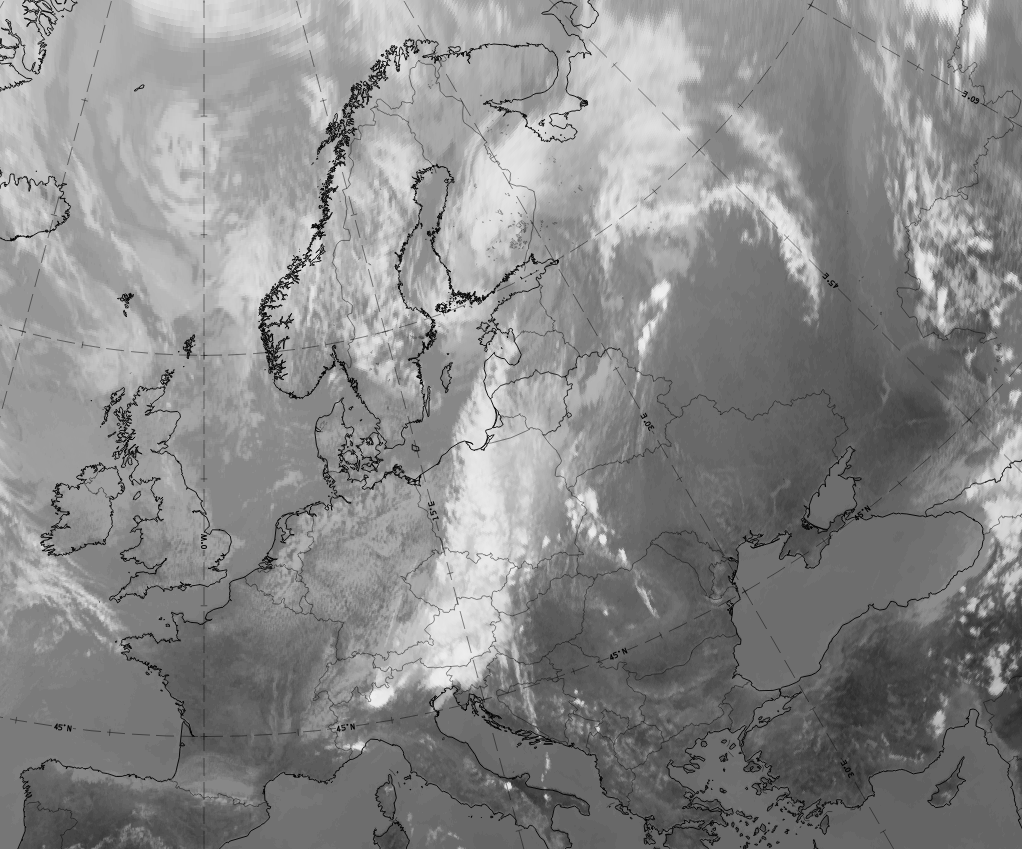 11 July 2020 at 12 UTC |
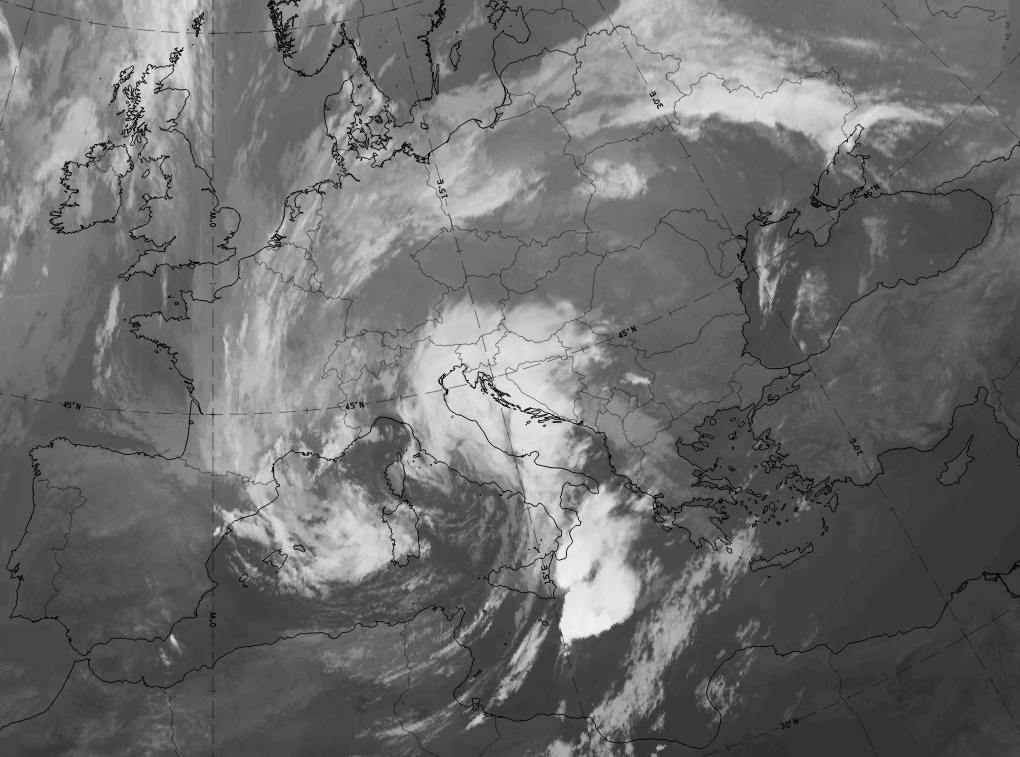 27 September 2020 at 18 UTC |
| In the case from 11 July 2020 a cloud bulge and the cloud fibre of an upper wave can be followed from 00 UTC till 18 UTC from South Germany to Poland and finally to the western parts of the Baltic States. The cloud bulge does not grow remarkably in size and the fibre can be followed in all three points of time. | On the case from 27 September 2020 a bright cloud bulge indicating a classical wave can be followed from 06 UTC till 18 UTC from north and central Italy to the north Adriatic sea, North Italy and Croatia. The cloud bulge becomes much larger developing from a wave stage to an early occlusion stage. |
Meteorological Physical Background
The term "upper level" refers to heights that are below the tropopause, but generally above 500 hPa. Wave developments in general take place within a Cold Front. According to the polar front theory a low pressure area in the lower levels of the troposphere can develop if a small-scale disturbance is superimposed on the stream field, causing an ageostrophic circulation within the baroclinic zone of the frontal cloud band. A Wave bulge is an indication of such a process. This circulation causes a fall in surface pressure, convergence, a maximum in temperature advection and an increase in cyclonic vorticity within the lower levels of the troposphere.
However, in the physical background of an Upper Wave some processes can be distinguished from "classical" theory:
- The observed cloud bulge of an Upper Wave is a sign of a disturbance in the upper stream, but there is no corresponding and deepening pressure minimum at the surface.
- The dominating driving mechanisms in the upper levels can also be seen from:
- A sharp and pronounced trough at 300 hPa, leading to an increase of curvature vorticity. An additional reason for the release of relative vorticity is the right entrance region of the associated jet streak, supporting ageostrophic circulation at upper levels within the stream field.
- The dark zone in WV 6.2 imagery to the rear of the Wave bulge is a clear sign of significant tropopause folding to the rear of the cloud band, also reflected in high values of potential vorticity lower down in the troposphere.
Seen in terms of conveyor belts, the dominating mechanism of the "classic" Wave is a Warm Conveyor Belt superimposed on the Wave bulge. In contrast, the cloud bulge of an Upper Wave usually lies completely within cold advection at lower levels, caused by the intrusion of cold air within this layer. At upper levels (above 500 hPa) regions of more or less warm advection can be seen, associated with ageostrophic circulation. At 300 hPa and higher strong warm advection appears associated with the bulge of the Upper Wave. This maximum can be related to the stable air from the tropopause which is sinking to the rear of the Wave point.
|
|
The mechanisms described above are well indicated in relative streams:
- An upper relative stream, which is sinking behind the Wave bulge and rising along the Upper Wave.
- A rising part of the dry intrusion dominates the Wave bulge at upper levels. The Warm Conveyor Belt is not involved in the process and the limiting streamline appears within the frontal cloud band, ahead of the Wave feature.
The case of 22 August 2005 at 12.00 UTC shows such a distribution of relative streams. In the image below left the Cold Front can be seen in the vertical cross section. The relative streams on the 310K isentrope displays sinking motion to the rear, and rising above the Upper Wave feature (below upper right).
|
22 August 2005/12.00 UTC - Vertical cross section; black: isentropes (ThetaE), orange thin: IR pixel values, orange thick: WV pixel values
|
22 August 2005/12.00 UTC - Meteosat IR 10.8 image; magenta: relative streams 310K - system velocity: 222° 2 m/s, yellow: isobars 310K, position of vertical cross section indicated
|
|
|
|
|
|
22 August 2005/12.00 UTC - Meteosat IR 10.8 image; magenta: relative streams 316K - system velocity: 222° 2 m/s, yellow: isobars 316K
|
22 August 2005/12.00 UTC - Meteosat IR 10.8 image; magenta: relative streams 324K - system velocity: 222° 2 m/s, yellow: isobars 324K
|
At 316K, representing levels around 500 hPa, the sinking to the rear is still visible and the limiting streamline appears at the front edge of the cloud band (above left). At 324K an upper relative stream over the Wave bulge is still gently rising and the Warm Conveyor Belt can be seen ahead (to the east) of the cloud band and not part of the circulation of the Upper Wave.
Distinction between Wave and Upper Wave according to the physical background
| Upper Wave | Wave |
|
|
|
|
|
|
|
|
|
|
The IR10.8 images below show the differences described above:
Below left is the case of an Upper Wave with relative streams at upper levels, below right is the case of a "classical" Wave. The case of the 16 April 2005 displays a pronounced Wave bulge over France. The relative streams at upper levels are clearly dominated by a Warm Conveyor Belt, which is contrary to the upper relative streams associated with an Upper Wave.
|
22 August 2005/12.00 UTC - Meteosat 8 IR 10.8 image; magenta: relative streams 322K - system velocity: 222° 2 m/s, yellow: isobars 316K
|
16 April 2005/00.00 UTC - Meteosat 8 IR 10.8 image; magenta: relative streams 304K - system velocity: 181° 13 m/s, yellow: isobars 304K
|

|
|
Key Parameters
- Height contours at 500 and 1000 hPa:
- Surface and mid level height contours: similar appearance to a CF (see Cold Front ), no separate pressure minimum or deepening trough, normally associated with a "classical" Wave (see Wave )
- Height contours at 300 hPa:
- Significantly sharp and deepening trough to the rear of the cloud band
- Vorticity Advection at 300 hPa:
- Distinct maximum caused by the advection of shear and curvature vorticity
- Also resulting from sharp trough to the rear
- Distinct advection of curvature vorticity through the stream field
- Shear and Curvature Vorticity at 300 hPa:
- Isolines of Curvature Vorticity cross the cloud band at the Wave point at an acute or nearly right angle
- Shear vorticity: as in Cold Fronts, associated with a strong jet
- Isotachs and Shear - Zero - Line at 300 hPa:
- Position of the Wave bulge relative to the Isotachs depends on the stage in its life cycle: during the initial stage the Upper Wave forms at the entrance region of the jet, later the Upper Wave bulge propagates towards the exit region
- The majority of Upper Waves studied show an extension of the cloud bulge into the side of cyclonic shear
- Potential Vorticity:
- Tropopause folding to the rear of the cloud band upwind of the Wave bulge (PV anomaly)
- PV=1 has protruded downward to about 500 to 400 hPa during the initial stage
- PV anomaly slightly weakening during life cycle (no further development of Upper Wave)
- Temperature Advection at 700 hPa:
- Cold Advection is associated with the Upper Wave during the whole life cycle
Height contours at 1000 and 500 hPa
|
22 August 2005/12.00 UTC - Meteosat 8 IR 10.8 image; cyan: height contours 500 hPa, magenta: height contours 300 hPa
|
|
|
|
Height contours at 300 hPa and PVA 300 hPa
|
22 August 2005/12.00 UTC - Meteosat 8 IR 10.8 image; green: height contours 300 hPa, red: positive vorticity advection (PVA) 300 hP
|
|
|
|
Shear and Curvature Vorticity at 300 hPa
|
22 August 2005/12.00 UTC - Meteosat 8 IR 10.8 image; blue: shear vorticity 300 hPa, brown: curvature vorticity 300 hPa
|
|
|
|
Isotachs and Shear - Zero - Line at 300 hPa
|
22 August 2005/12.00 UTC - Meteosat 8 IR 10.8 image; black: zero line of shear vorticity 300 hPa, yellow: isotachs 300 hPa
|
|
|
|
Potential Vorticity and TA 700
|
22 August 2005/12.00 UTC - Meteosat 8 IR 10.8 image; magenta: potential vorticity, red: temperature advection 700 hPa
|
|
|
|
Distinction between Wave and Upper Wave according to the key parameters
Most parameters show similar distribution and characteristics, except:
| Upper Wave | Wave |
|
|
|
|
|
|
|
|
The set of IR images below show the differences described in the above table. Below left is the case of an Upper Wave, below right the case of a Wave. While the Upper Wave has no separate surface trough superimposed, the Wave case from 4 July 2005 shows a distinct surface low as well as maximum of warm advection superimposed upon the Wave bulge.
|
22 August 2005/12.00 UTC - Meteosat 8 IR 10.8 image; red: temperature advection 700 hPa, magenta: height contours 1000 hPa
|
04 July 2005/12.00 UTC - Meteosat 8 IR 10.8 image; red: temperature advection 700 hPa, magenta: height contours 1000 hPa
|
|
|
Typical Appearance In Vertical Cross Sections
- Isentropes:
Isentropes show mainly frontal character. No impact from Upper Wave - Temperature Advection:
Maximum at 300 hPa or at higher levels, connected to tropopause folding (related to potential vorticity), cold advection below the Wave bulge at lower levels - Vorticity Advection:
Significant maximum of positive vorticity advection at upper levels connected to the sharpening of the upper level trough at 300 hPa - Vertical motion:
Vertical motion indicates rising air, with the maximum at upper levels, due to a rising upper relative stream
|
22 August 2005/12.00 UTC - Meteosat 8 IR 10.8 image; position of vertical cross section indicated
|
|
|
|
Temperature Advection
|
22 August 2005/12.00 UTC - Vertical cross section; black: isentropes (ThetaE), red thin: temperature advection - CA, red thick: temperature advection - WA, orange thin: IR pixel values, orange thick: WV pixel values
|
|
|
|
Vorticity Advection
|
22 August 2005/12.00 UTC - Vertical cross section; black: isentropes (ThetaE), green thin: vorticity advection - NVA, green thick: vorticity advection - PVA, orange thin: IR pixel values, orange thick: WV pixel values
|
|
|
|
Vertical Motion
|
22 August 2005/12.00 UTC - Vertical cross section; black: isentropes (ThetaE), cyan: vertical motion (omega) - upward motion, orange thin: IR pixel values, orange thick: WV pixel values
|
|
|
|
Potential Vorticity
|
22 August 2005/12.00 UTC - Vertical cross section; black: isentropes (ThetaE), dark green thin: potential vorticity <1 unit, dark green thick: potential vorticity >=1 unit, orange thin: IR pixel values, orange thick: WV pixel values
|
|
|
|
Distinction between Wave and Upper Wave according to vertical cross sections
| Upper Wave | Wave |
|
|
|
|
|
|
Below left is the case of an Upper Wave, below right is the case of a Wave (2nd row below left shows vertical cross section over Wave bulge). While the Upper Wave has no separate maximum of PV>=1 unit at low levels, the Wave case from the 4 July 2005/12.00 UTC shows a distinct maximum at low levels, which is usually more intense and can exceed PV>=2 units.
|
22 August 2005/12.00 UTC - Vertical cross section; black: isentropes (ThetaE), dark green thin: potential vorticity <1 unit, dark green thick: potential vorticity >=1 unit, orange thin: IR pixel values, orange thick: WV pixel values
|
04 July 2005/12.00 UTC - Vertical cross section; black: isentropes (ThetaE), dark green thin: potential vorticity <1 unit, dark green thick: potential vorticity >=1 unit, orange thin: IR pixel values, orange thick: WV pixel values
|

|
|
|
|
|
04 July 2005/12.00 UTC - Meteosat 8 IR 10.8 image; position of vertical cross section indicated
|
Weather Events
An Upper Wave is indicative of various processes occurring at the upper levels of the troposphere. There are no weather events at the surface associated with the Upper Wave bulge. The example below shows an Upper Wave over England.
| Parameter | Description |
| Precipitation |
|
| Temperature |
|
| Wind (incl. gusts) |
|
| Other relevant information |
|
 |
|
|
Legend:
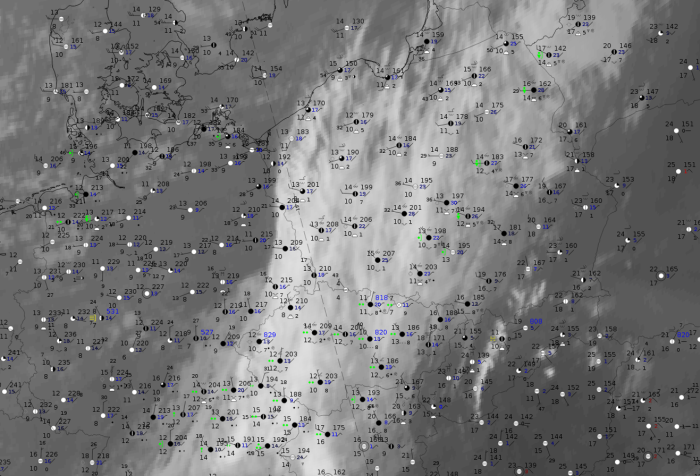
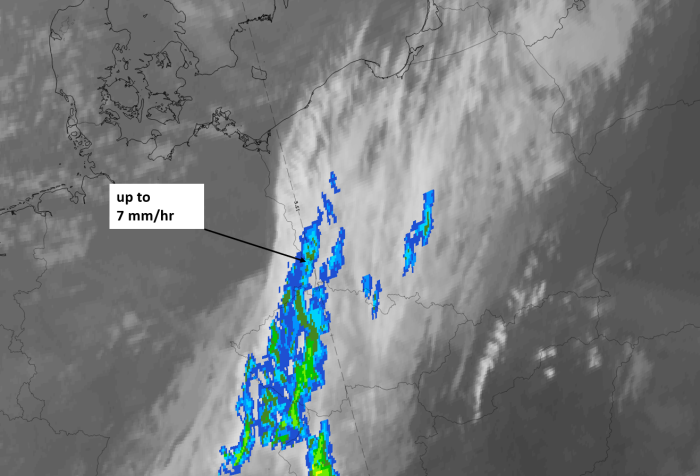
11 July 2020 at 12UTC: IR + synoptic measurements (above) + probability of moderate rain (Precipitting clouds PC - NWCSAF).
Note: for a larger SYNOP image click this link.
Reports of persistent precipitation can be found within the cold front cloud band to the south and of intermittent precipitation to the northeast of the upper wave cloud bulge. In this cloud bulge there are no precipitation reports, only overcast with multi-layered cloud. In the probability of moderate precipitation computed from the NWCSAF there are values from 0-15 %.
|
|
|
|
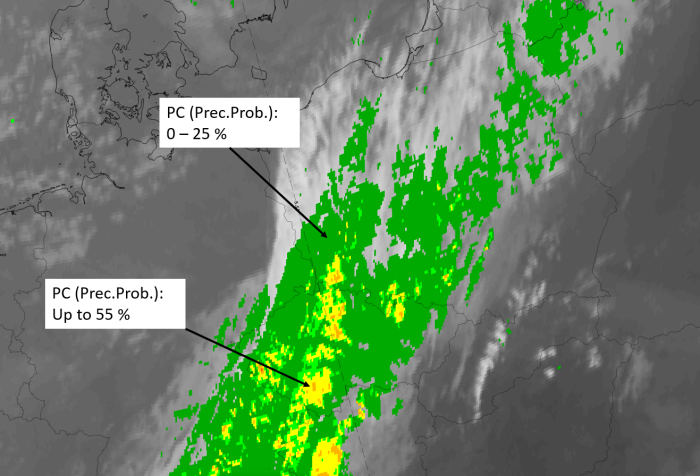
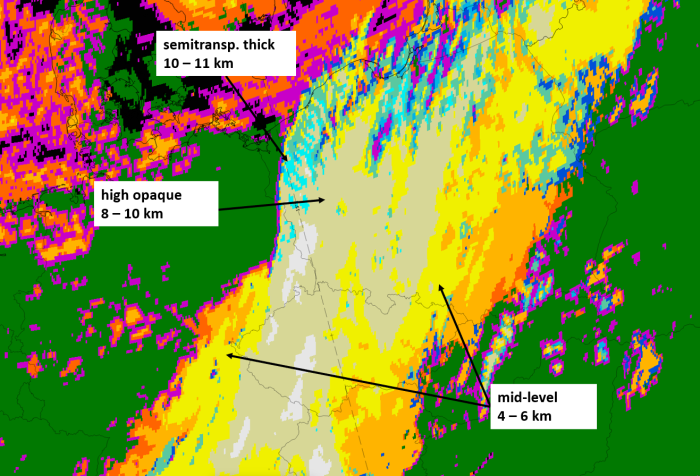
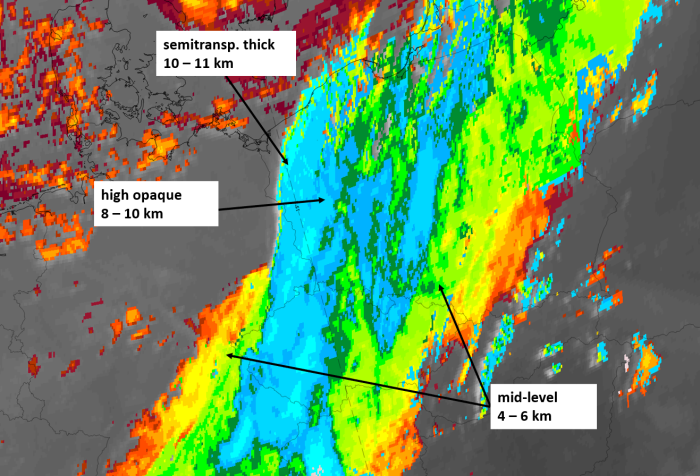
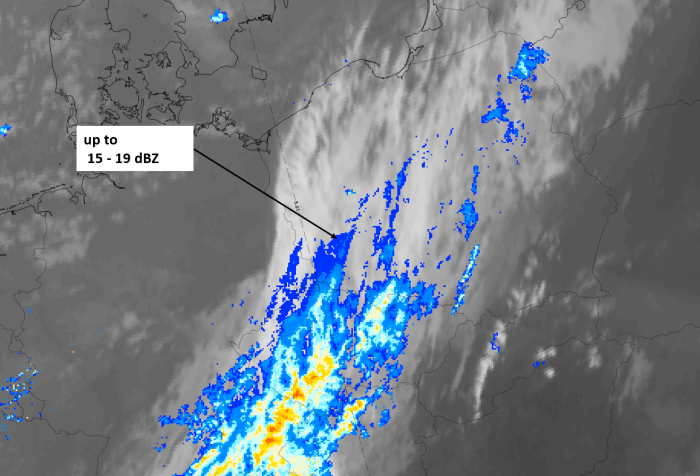
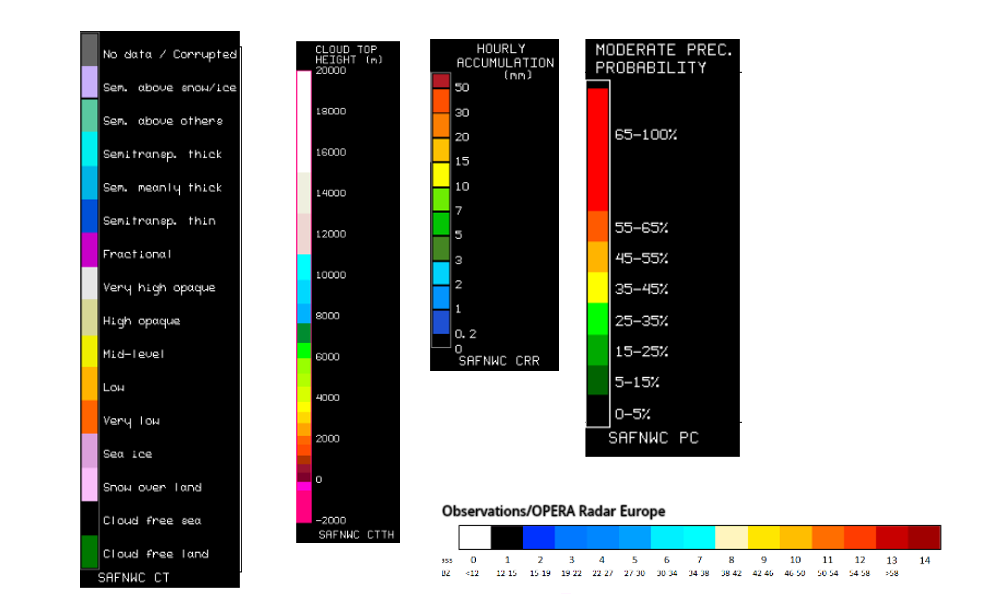
Legend:
11 July 2020, 06 UTC, IR; superimposed:
1st row: Cloud Type (CT NWCSAF) (above) + Cloud Top Height (CTTH - NWCSAF) (below); 2nd row: Convective Rainfall Rate (CRR NWCSAF) (above) + Radar intensities from Opera radar system (below).
For identifying values for Cloud type (CT), Cloud type height (CTTH), precipitating clouds (PC), and Opera radar for any pixel in the images look into the legends. (link).
Special Investigation: Can An Upper Wave Develop Into A Wave?
When applying the conceptual model of an CM Upper Wave in operational forecasting, it is important to know if an Upper Wave can develop into a "classical" Wave and even further, to an Occlusion. Out of all cases studied about 25% show some indications of development from an Upper Wave to a Wave. But only very few cases show significant development, let alone development into true cyclogenesis.
From the point of view of key parameters and vertical cross sections, only a few parameters show a complete change into a "classic" Wave. That means that Upper Waves tend to adopt single Wave - like characteristics, e.g. amplification of the Wave bulge, but are most do not completely become "classical" Waves.
In the following example, dated 16 March 2005, there is modification of an Upper Wave when seen from the CM point of view:
Cloud structure in satellite images
Satellite images show at least an amplification of the cloud bulge and a retardation of the propagation of the wave along the frontal cloud band (i.e. the Wave becomes "slower"). The character of the cloud bulge is then similar to a "classic" Wave, but there is no further development of the Wave bulge.
|
In the IR image for loop 16 March 2005 shown below, such a development can be seen over the North Sea, Danmark and the Baltic Sea. At the end of the loop a Wave like feature can be seen over Russia.
|
Loop: 6 March 2005 16/18.00 - 17/15.00 UTC 3-hourly image loop
|
|
16 March 2005/18.00 UTC - Meteosat 8 IR 10.8 image
|
|
Though the case of 16 March 2005 shows a distinct amplification of the Wave bulge during its lifecycle, the Upper Wave is still dominated by upper relative streams. The limiting streamline between the Upper Relative Stream (u.r.s.) and the Warm Conveyor Belt (w.c.b.) is situated far in front (see schematic below).
|
In the IR10.8 image loop, below right, the relative streams on the 312K surface can be observed during the development phase. It can be seen that at this layer, which is situated in the middle of the troposphere, the Warm Conveyor Belt has minimal influence on the circulation over the Wave bulge during the following 18 hours. This pattern fits well with the CM of the Upper Wave. The processes described by relative streams do not support a transformation from an Upper Wave to a "classic" Wave.
|
Loop: March 2005 16/18.00 - 17/12.00 UTC 6-hourly image loop
|
|
|
16 March 2005/18.00 UTC - Vertical cross section; black: isentropes (ThetaE), orange thin: IR pixel values, orange thick: WV pixel values
|
16 March 2005/18.00 UTC - Meteosat 8 IR 10.8 image; magenta: relative streams 312K, yellow: isobars; position of vertical cross section indicated
|
|
|
|
Key Parameters
The most important parameters to distinguish between an Upper Wave and a Wave are the height contours at 1000 hPa and the temperature advection field at 700 hPa. By 17 March 2005 at 12.00 UTC a flat surface trough connected to the Cold Front can be seen over the cloud band. No distinct separate surface low has yet developed in the region of the Wave bulge of the Upper Wave over Estonia, although the Wave bulge has amplified significantly during the life cycle (seen in the IR10.8 loops above). A maximum of temperature advection is observed in the vicinity of the cloud bulge, but the Wave bulge itself is still under cold advection (see schematic and image below).
|
17 March 2005/12.00 UTC - Meteosat 8 IR 10.8 image; red: temperature advection 700 hPa; magenta: height contours 1000 hPa
|
|
|
|
Typical appearance in vertical cross section
Usually the parameters do not change much during the life cycle of an Upper Wave but, as mentioned before, single parameters show a tendency to develop Wave - like characteristics. If there is an amplification of an Upper Wave, the PV=1 unit, which can only be seen initially at levels higher than 500 hPa, will expand down to lower levels. In most of the cases a single maximum of PV=0.8 units develops at middle levels. This resembles the appearance of potential vorticity associated with a classic Wave, but the PV values are much less than those within a maximum of potential vorticity in a "classic" Wave.
The case of 16 March 2005 shows such a development. In the IR10.8 image loop below the vertical cross sections for each time step (6 hours) are indicated.
|
Loop: 16 March 2005 16/18.00 - 17/12.00 UTC 6-hourly image loop
|
|
16 March 2005/18.00 UTC - Meteosat 8 IR 10.8 image; position of vertical cross section indicated
|
|
The sequence of cross sections (see below) displays the development of a single maximum of potential vorticity at middle levels for the same period of time as in the IR 10.8 loop above (cross sections are indicated in the IR loop above). A tear - off into a secondary maximum of potential vorticity which is typical for this type of development can be seen during the loop. The numerical values of the PV maximum at low and middle levels (about 0.8 PVU) are less than those associated with a "classic" Wave. Usually values much greater than PV = 1 unit can be observed below the bulge of a Wave.
|
Loop: March 2005 16/18.00 - 17/12.00 UTC 6-hourly image loop
|
|
16 March 2005/18.00 UTC - Vertical cross section; black: isentropes (ThetaE), dark green thin: potential vorticity <1 unit, dark green thick: potential vorticity >=1 unit, orange thin: IR pixel values, orange thick: WV pixel values
|
|
References
General Meteorology and Basics
- HOSKINS B. J., MCINTYRE M. E. and ROBERTSON A. L. W. (1985): On the use and significance of isentropic potential vorticity maps; Quart. J. R. Meteor. Soc., Vol. 111, p. 877 - 946
- KURZ M. (1990): Synoptische Meteorologie - Leitfäden für die Ausbildung im Deutschen Wetterdienst; 2. Auflage, Selbstverlag des Deutschen Wetterdienstes
- BLUESTEIN, H.B., 1993: Synoptic Dynamic Meteorology in Midlatitudes, Volume I, Oxford Univ. Press
General Satellite Meteorology
- BADER M. J., FORBES G. S., GRANT J. R., LILLEY R. B. E. and WATERS A. J. (1995): Images in weather forecasting - A practical guide for interpreting satellite and radar imagery; Cambridge University Press, chapter 4.5
Specific Satellite Meteorology
- BLUESTEIN, H.B., 1993: Synoptic Dynamic Meteorology in Midlatitudes, Volume I, Oxford Univ. Press
- BROWNING K. A. and PARDOE C. W. (1973): Structure of low-level jet streams ahead of mid-latitude cold fronts; Quart. J. R. Meteor. Soc., Vol. 99, p. 619 - 638
- HOSKINS, B.J., DRAGHICI, I., DAVIES, H.C., 1978: A New Look at the Omega Equation, Quart. J. R. Meteorol. Soc., pp31
- MARTIN J. E., LOCATELLI J. D. and HOBBS P. V. (1992): The synoptic evolution of a deep tropospheric frontal circulation and attendant cyclogenesis; 5th Conference on Mesoscale Processes, Atlanta, Georgia, 5 - 10 January 1992
- SHAPIRO M. A. (1981): Frontogenesis and geostropically forced secondary circulations in the vicinity of jet stream - frontal zone systems; J. Atmos. Sci., Vol. 38, p. 954 - 973
- UCCELLINI L. W. (1990): Process contributing to the rapid development of extratropical cyclones; in: Extratropical Cyclones, The Erik Palmen Memorial Volume, Ed. Chester Newton and Eero O Holopainen, p. 81 - 105