Meteorological Physical Background
The term "upper level" refers to heights that are below the tropopause, but generally above 500 hPa. Wave developments in general take place within a Cold Front. According to the polar front theory a low pressure area in the lower levels of the troposphere can develop if a small-scale disturbance is superimposed on the stream field, causing an ageostrophic circulation within the baroclinic zone of the frontal cloud band. A Wave bulge is an indication of such a process. This circulation causes a fall in surface pressure, convergence, a maximum in temperature advection and an increase in cyclonic vorticity within the lower levels of the troposphere.
However, in the physical background of an Upper Wave some processes can be distinguished from "classical" theory:
- The observed cloud bulge of an Upper Wave is a sign of a disturbance in the upper stream, but there is no corresponding and deepening pressure minimum at the surface.
- The dominating driving mechanisms in the upper levels can also be seen from:
- A sharp and pronounced trough at 300 hPa, leading to an increase of curvature vorticity. An additional reason for the release of relative vorticity is the right entrance region of the associated jet streak, supporting ageostrophic circulation at upper levels within the stream field.
- The dark zone in WV 6.2 imagery to the rear of the Wave bulge is a clear sign of significant tropopause folding to the rear of the cloud band, also reflected in high values of potential vorticity lower down in the troposphere.
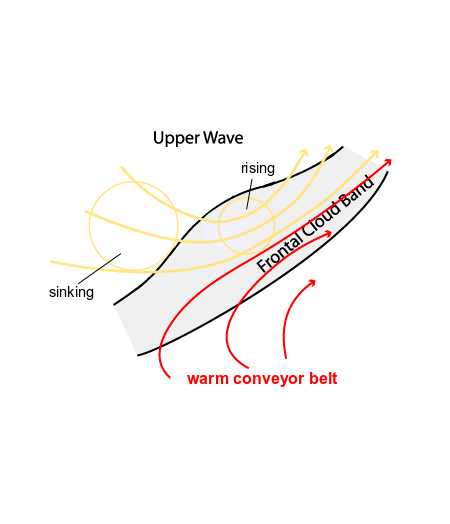
Seen in terms of conveyor belts, the dominating mechanism of the "classic" Wave is a Warm Conveyor Belt superimposed on the Wave bulge. In contrast, the cloud bulge of an Upper Wave usually lies completely within cold advection at lower levels, caused by the intrusion of cold air within this layer. At upper levels (above 500 hPa) regions of more or less warm advection can be seen, associated with ageostrophic circulation. At 300 hPa and higher strong warm advection appears associated with the bulge of the Upper Wave. This maximum can be related to the stable air from the tropopause which is sinking to the rear of the Wave point.
|
|
The mechanisms described above are well indicated in relative streams:
- An upper relative stream, which is sinking behind the Wave bulge and rising along the Upper Wave.
- A rising part of the dry intrusion dominates the Wave bulge at upper levels. The Warm Conveyor Belt is not involved in the process and the limiting streamline appears within the frontal cloud band, ahead of the Wave feature.
The case of 22 August 2005 at 12.00 UTC shows such a distribution of relative streams. In the image below left the Cold Front can be seen in the vertical cross section. The relative streams on the 310K isentrope displays sinking motion to the rear, and rising above the Upper Wave feature (below upper right).
|
22 August 2005/12.00 UTC - Vertical cross section; black: isentropes (ThetaE), orange thin: IR pixel values, orange thick: WV pixel values
|
22 August 2005/12.00 UTC - Meteosat IR 10.8 image; magenta: relative streams 310K - system velocity: 222° 2 m/s, yellow: isobars 310K, position of vertical cross section indicated
|
|
|
|
|
|
22 August 2005/12.00 UTC - Meteosat IR 10.8 image; magenta: relative streams 316K - system velocity: 222° 2 m/s, yellow: isobars 316K
|
22 August 2005/12.00 UTC - Meteosat IR 10.8 image; magenta: relative streams 324K - system velocity: 222° 2 m/s, yellow: isobars 324K
|
At 316K, representing levels around 500 hPa, the sinking to the rear is still visible and the limiting streamline appears at the front edge of the cloud band (above left). At 324K an upper relative stream over the Wave bulge is still gently rising and the Warm Conveyor Belt can be seen ahead (to the east) of the cloud band and not part of the circulation of the Upper Wave.
Distinction between Wave and Upper Wave according to the physical background
| Upper Wave | Wave |
|
|
|
|
|
|
|
|
|
|
The IR10.8 images below show the differences described above:
Below left is the case of an Upper Wave with relative streams at upper levels, below right is the case of a "classical" Wave. The case of the 16 April 2005 displays a pronounced Wave bulge over France. The relative streams at upper levels are clearly dominated by a Warm Conveyor Belt, which is contrary to the upper relative streams associated with an Upper Wave.
|
22 August 2005/12.00 UTC - Meteosat 8 IR 10.8 image; magenta: relative streams 322K - system velocity: 222° 2 m/s, yellow: isobars 316K
|
16 April 2005/00.00 UTC - Meteosat 8 IR 10.8 image; magenta: relative streams 304K - system velocity: 181° 13 m/s, yellow: isobars 304K
|

|
|