Weather Events
| Parameter | Description |
|---|---|
| Wind, Wind gusts |
|
| Temperature |
|
| Humidity |
|
| Waves |
|
|
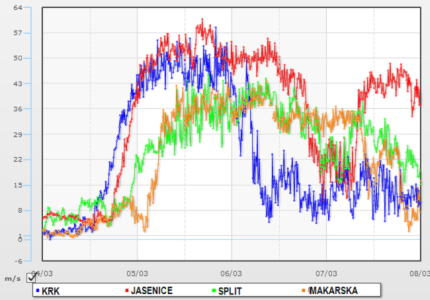
10 min maximum wind speeds (m/s) measured at some stations during one of the most severe bora episodes in March 2015.
|
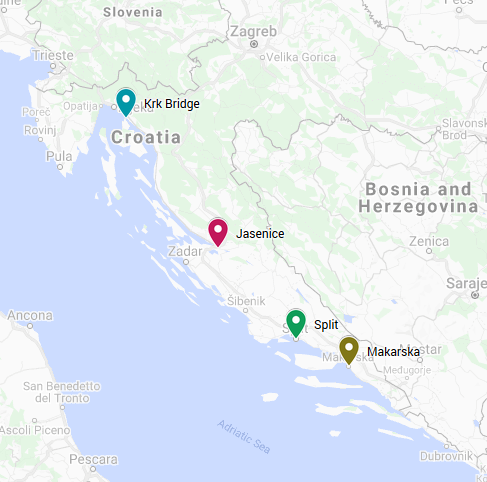
Locations of the measurement stations.
|
Because of the wavy structure that can often occur during bora events, clouds appear at different heights, with different cloud phases, temperatures and microphysics. Therefore, different SAFs can be useful for detecting these features.
Cloud Phase product from 05 February 2020, 12 UTC.
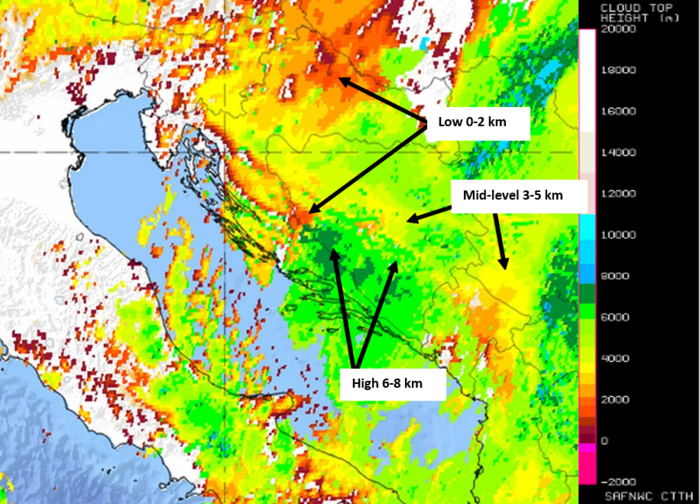
The Cloud Phase product discriminates between liquid and ice phases. In combination with the Cloud Top Height product, the three-dimensional structure of the waves can be clearly visualized.
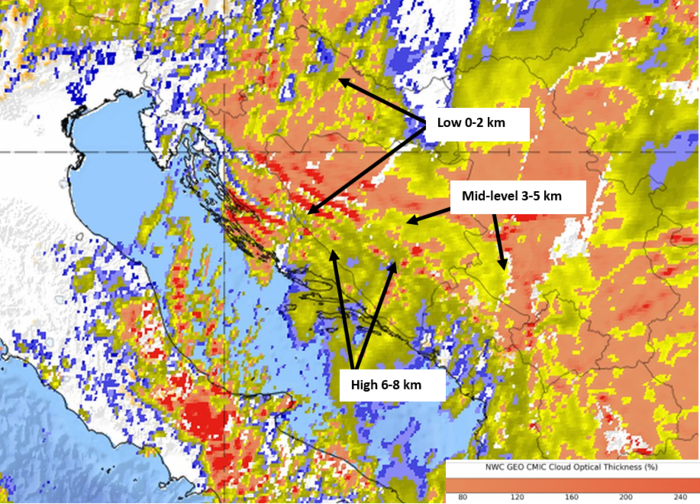
The Cloud Optical Thickness product provides information about the density and transmissivity of the cloud layer. It shows that clouds are thicker at the wave crests (red stripes) than at the wave troughs (between red stripes).
|
|
Cloud Top Height product (left) and Cloud Optical Thickness product (right) from February 5 2020, 12 UTC.


