Table of Contents
Cloud Structure In Satellite Images
Depending on the synoptic situation, bora sometimes occurs with clouds gathering on the hilltops and moving towards the sea with rain or snow. This type of bora is usually reffered to as a "dark bora". On the other hand, a "clear bora" is a bora with clear skies, which is the more frequent case.
Since bora is a wind phenomenon it is not directly visible in satellite images, but there are different cloud structures typical to bora cases. In strong, deep-layer bora cases, lee clouds can develop all across the Adriatic Sea, reaching the Italian coast. The effects of bora on cloud formation are most clearly seen in HRV images or RGB combinations of IR 10.8 µm and HRV images.
|
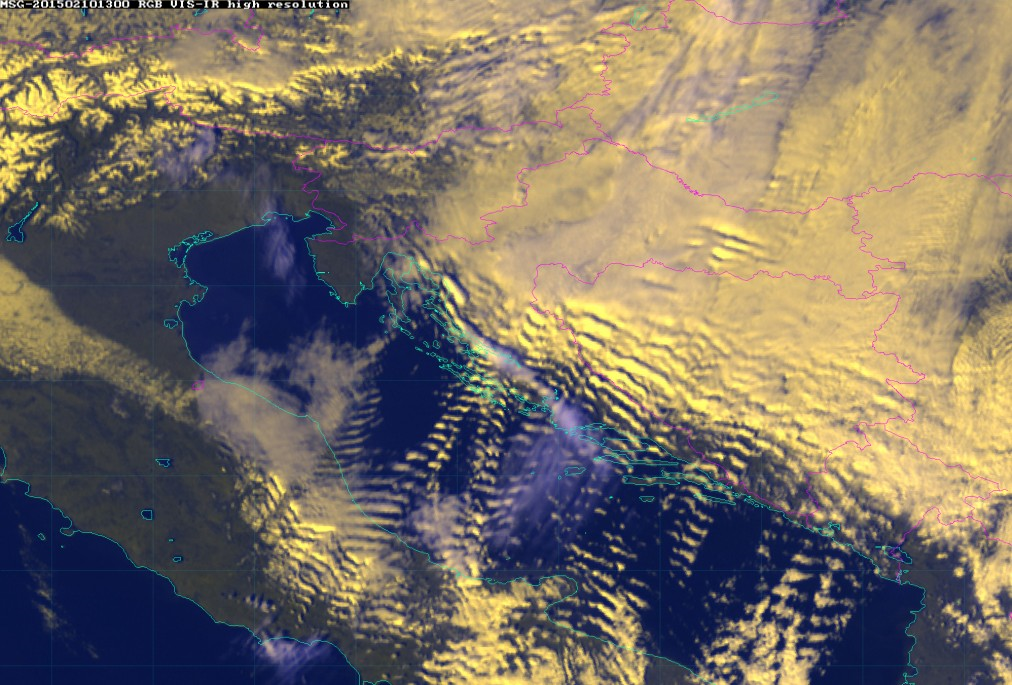
10 February 2015/13.00 UTC - Meteosat 10 RGB image (HRV, 10.8, 10.8)
|
|
|
|
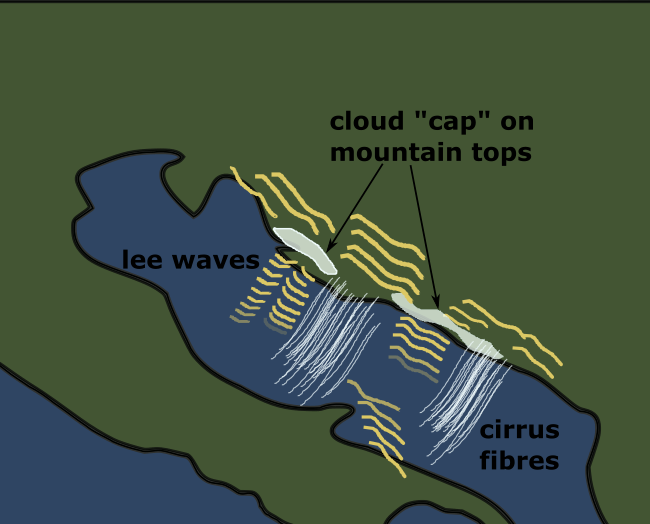
In the loop of HRV-IR images lee waves can be seen forming all across the Adriatic towards the Italian coast. It is easy to notice how the wind there is channeled through the mountain passes, which also influences the lee wave formation.
Fibres of cirrus clouds can also be seen stretching over the Adriatic. A cloud "cap" consisting of mid-level clouds is often seen trapped on the Velebit and Biokovo mountains. In the image loop the effect of clouds dissipating all along the coastline, a very frequent consequence of bora, is seen clearly. A wave-like cloud formation of the trapped waves is also seen here on the upwind side.
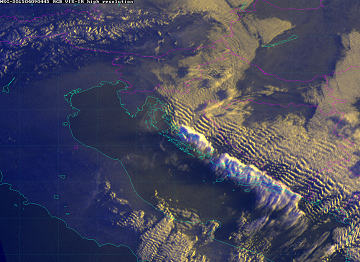
 09 April 2015/04.45 - Meteosat 10 RGB image (HRV, 10.8, 10.8) - 15 min loop
|
|
|
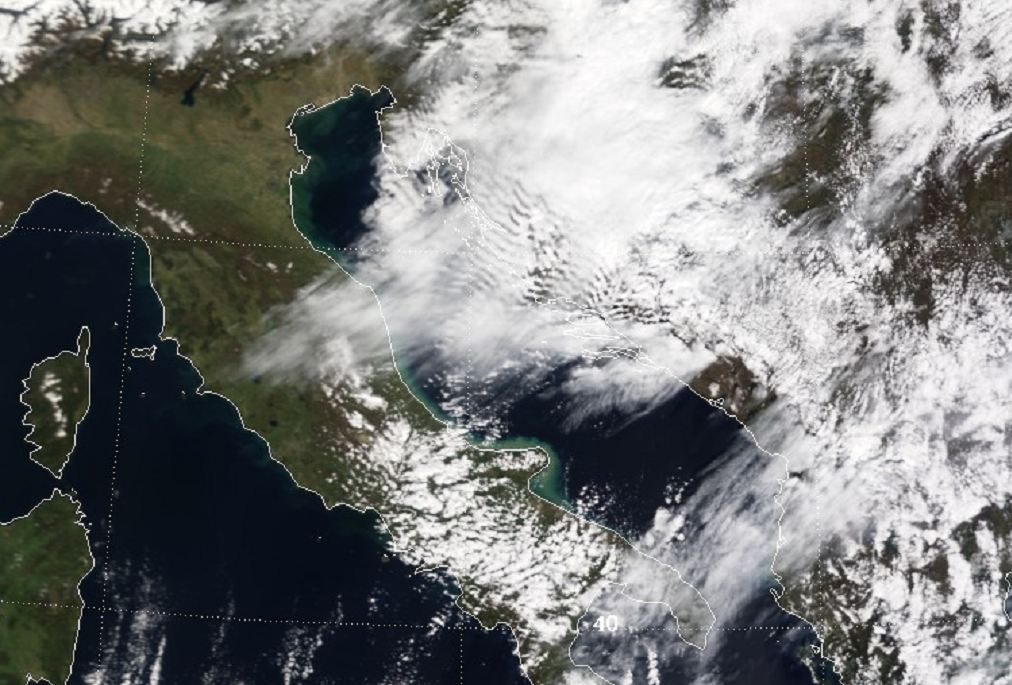
08 April 2015/09.45 UTC Modis TERRA RGB image (0.65 µm, 0.55 µm, 0.46 µm)
|
|
Appearance in the basic channels:
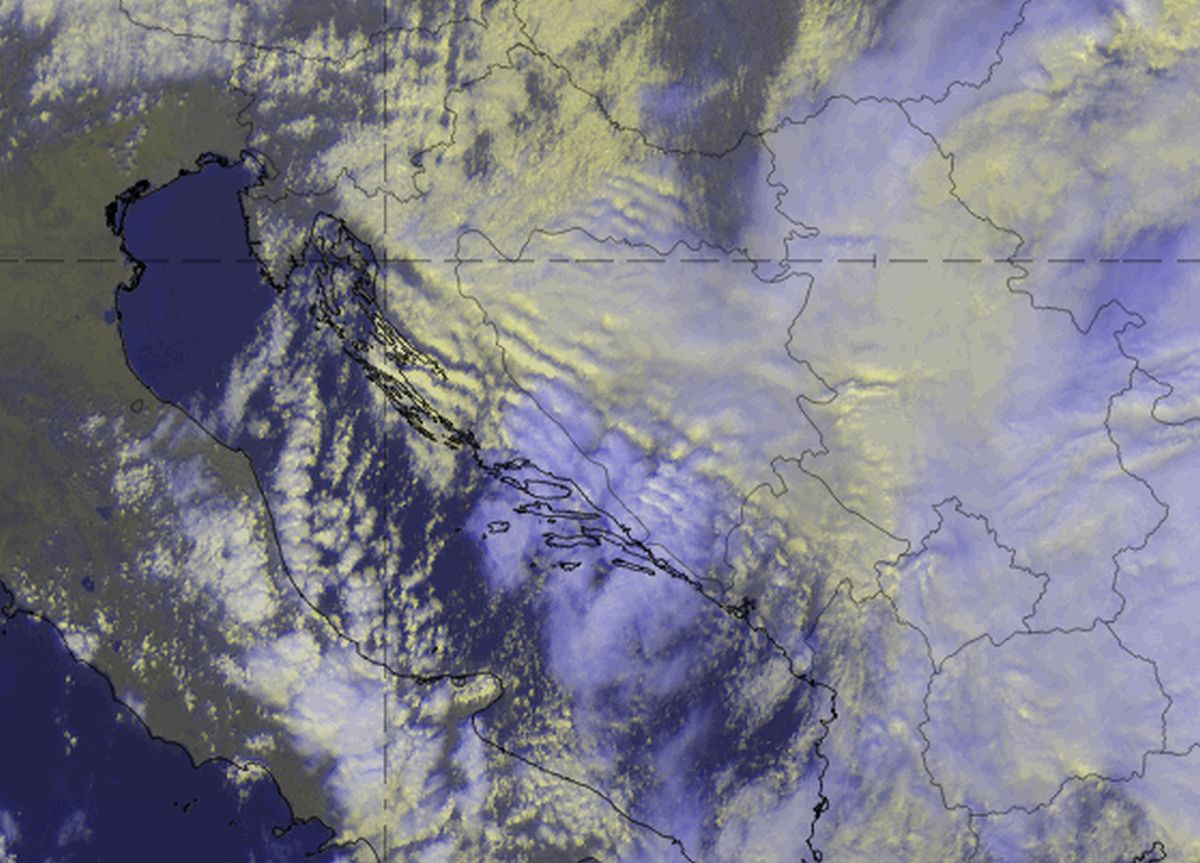
HRV Clouds RGB from 05 February 2020, 12 UTC.
The HRV Clouds RGB provides high resolution, which makes it possible to identify the filigree-like wave structures that can occur, although it has the disadvantage that it cannot be used during the night. Low to mid-level wavy clouds appear very bright or yellowish and can be superimposed by higher clouds (often cirrus), which appear in purple or violet. The waves can be observed downstream and upstream of the mountain ridge but do not necessarily develop during all bora events.
When a more thorough analysis of the clouds is needed, the Day Microphysics RGB can be used to distinguish between ice and water phases. It is also only available during daytime, but it includes two infrared channels and hence provides information on the cloud top particle size, temperature and optical thickness, with a good colour contrast. Thick ice clouds appear reddish: brighter for smaller ice crystals near the top and darker for large ice particles. A yellow colour implies low to mid-level water clouds with larger water droplets. Blue colour stands for cloud-free land, oceans or lakes.
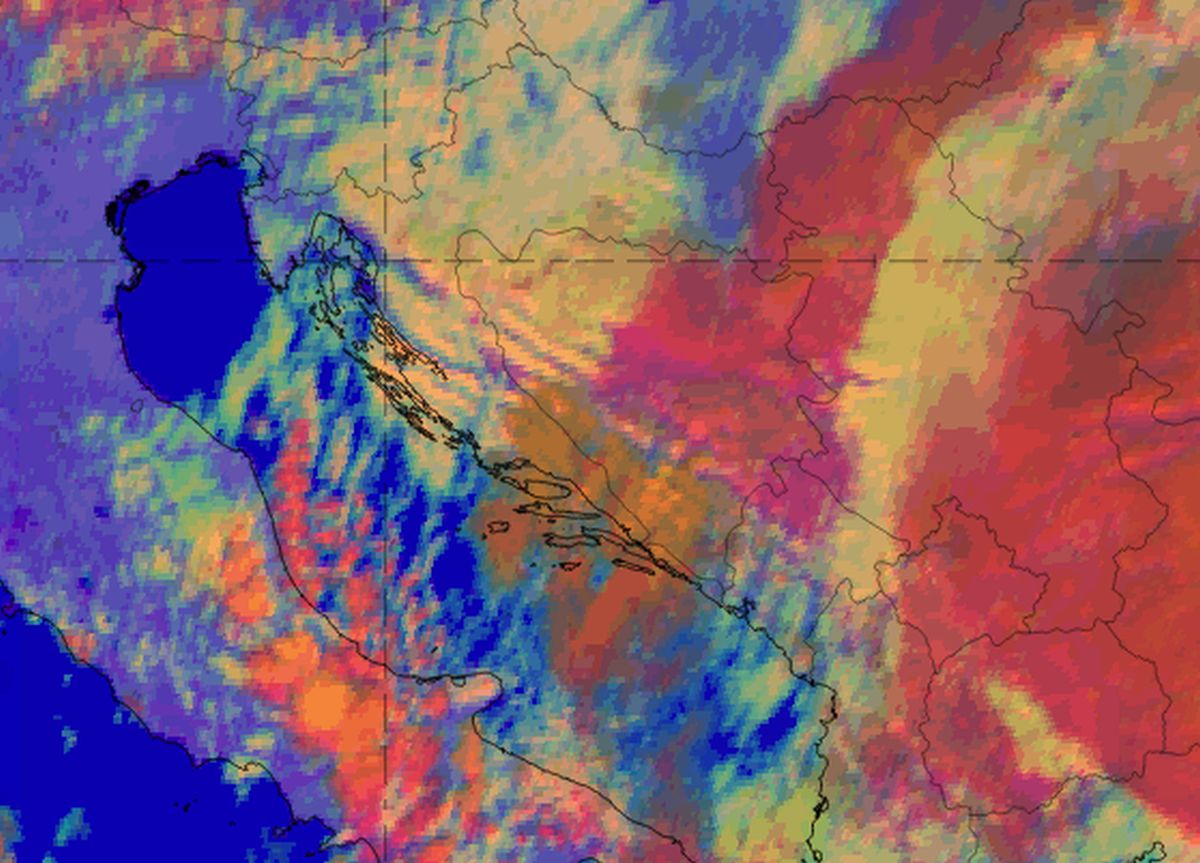
Day Microphysics RGB from 05 February 2020, 12 UTC.
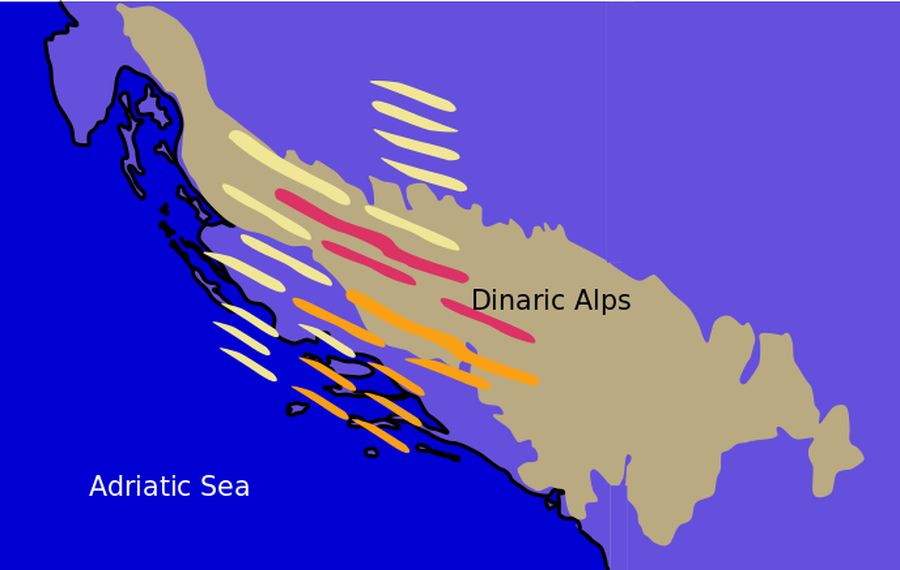
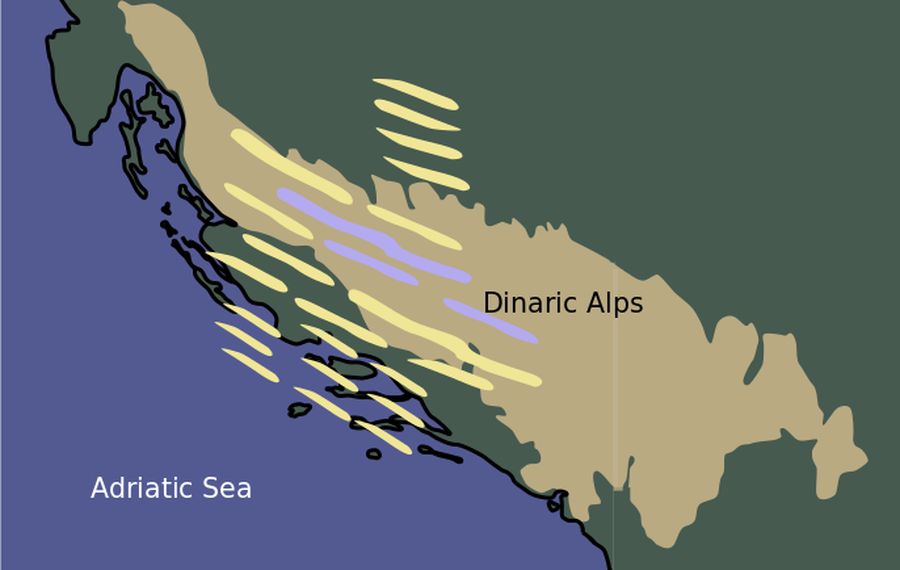
Schematic for HRV Clouds RGB (left); Schematic for Day Microphysics RGB (right)
Meteorological Physical Background
Bora blows from the NE quadrant over the coastal mountains, which are approximately 1000 m high, usually bringing colder and relatively drier air to the Adriatic. The northern Adriatic severe bora is more frequent than its more complex southern counterpart. It is particularly severe in the lee of the Velebit mountain range, the steepest and most pronounced mountain range in the Dinaric Alps in Croatia. The highest wind speed was measured in the southern Velebit region: 69 m/s (248 km/h). Several factors contribute to Velebit being the location of frequent severe bora outbreaks. Its orientation is perpendicular to the northeasterly winds, it has gentle windward slopes and particularly steep leeward slopes, which generate large mountain gravity (buoyancy) waves, and there are several prominent narrow mountain passes.
It was generally thought before (and the claim can still be found in some mistaken explanations) that bora is a falling, mostly thermodynamically driven "katabatic" type of wind. However, this impression has changed due to numerous studies that have shown that severe bora forms in a hydraulic-like flow, with mountain wave breaking as the main mechanism of generation.
Synoptic situations typical for the onset, persistence and cessation of bora are related to the location of cyclonic flow in the proximity of the Adriatic Sea and/or a high-pressure center above central Europe. These synoptic pressure patterns over Europe can be used to distinguish between an anticyclonic and a cyclonic bora. The anticyclonic ("clear") bora develops when a high-pressure system dominates over central and western Europe (upstream of the Dinaric Alps) and the low pressure center is located over the eastern Mediterranean. The cyclonic ( "dark") bora, on the other hand, is associated with the existence of a low-pressure area over the Adriatic Sea or central Mediterranean.
Bora is stronger and more frequent in winter, when it typically lasts for several days. It blows hardest when a high-pressure area sits over the snow-covered mountains of the interior plateau behind the Dinaric coastal mountain range and a low-pressure area lies further south over the warmer Adriatic Sea. The cyclone over the sea draws the lower tropospheric air from the continent over the coastal mountains, easily passing between the foothills of eastern Alps and the broad Balkan mountains. Similarly, a high pressure pushes the air from the large Pannonian Plain and central Europe towards the Adriatic over the coastal mountains.
A cold front's passage over the area sometimes also induces a relatively short lasting bora.
A shallow bora occurs when the flow is confined to the lower troposphere only, separated from the flow aloft by a strong temperature inversion or a change in wind direction with height. A typical example is a bora occurring with a high ridge reaching southwards from a large, strong Siberian high in winter.
Another example of a bora's generation mechanism is Alpine lee cyclogenesis. It primarily occurs around the Gulf of Genoa, consequently creating a secondary ("daughter") cyclone over the Adriatic. It locally reduces the pressure over the Adriatic, creating favorable pressure gradients for bora formation. Intense lee cyclones synchronized with the upper tropospheric flow produce deep bora that blows throughout the troposphere.
|
Synoptic situations in which a bora typically develops can be divided into 4 groups (Heinmann, 2001) according to their appearance in the 500 hPa field:
|
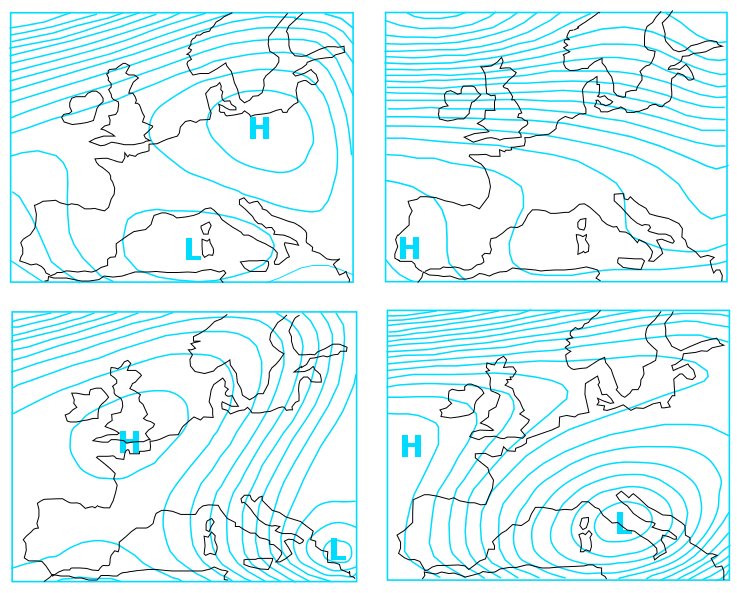
|
Key Parameters
- high pressure gradient between a high over western Europe and a low in the eastern Mediterranean (clear bora cases) or in the southern Adriatic (dark bora)
- the pressure gradient across the mountain range is locally intensified due to mountain wave formation, which additionally intensifies bora
MSLP
- in clear bora cases AT 500 usually shows a zone of high pressure gradients between the ridge over the Atlantic and western Europe and often, but not necessarily, a deep trough above southeastern Europe.
- in dark bora cases there is usually a deep trough over central Europe and central Medirerranean, often with a cut-off low over Italy
AT 500
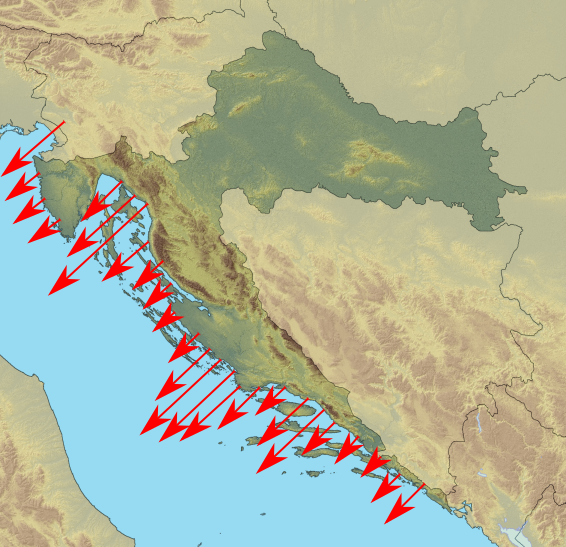
- maxima of NE wind occur along the eastern Adriatic coast and the adjacent Dinaric Alps
10m wind
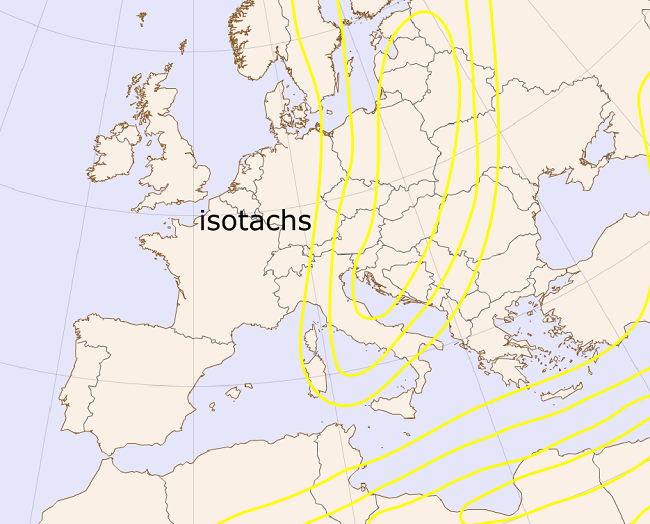
- in deep-layer bora cases NE jet flows above the area
Jet stream (isotachs 300 hPa)
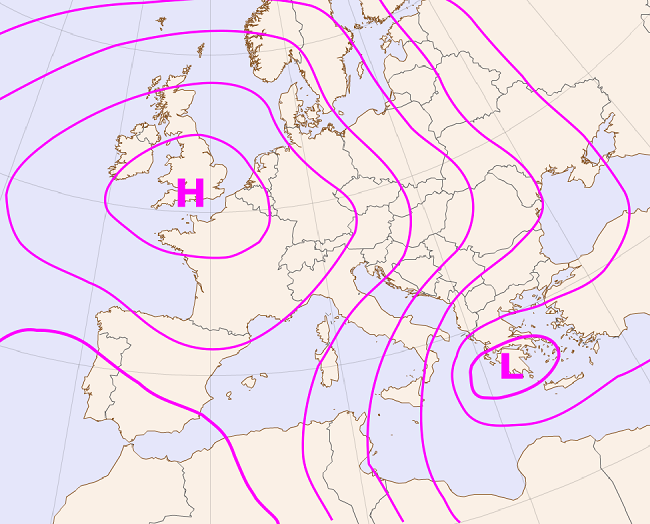
Mean sea level pressure
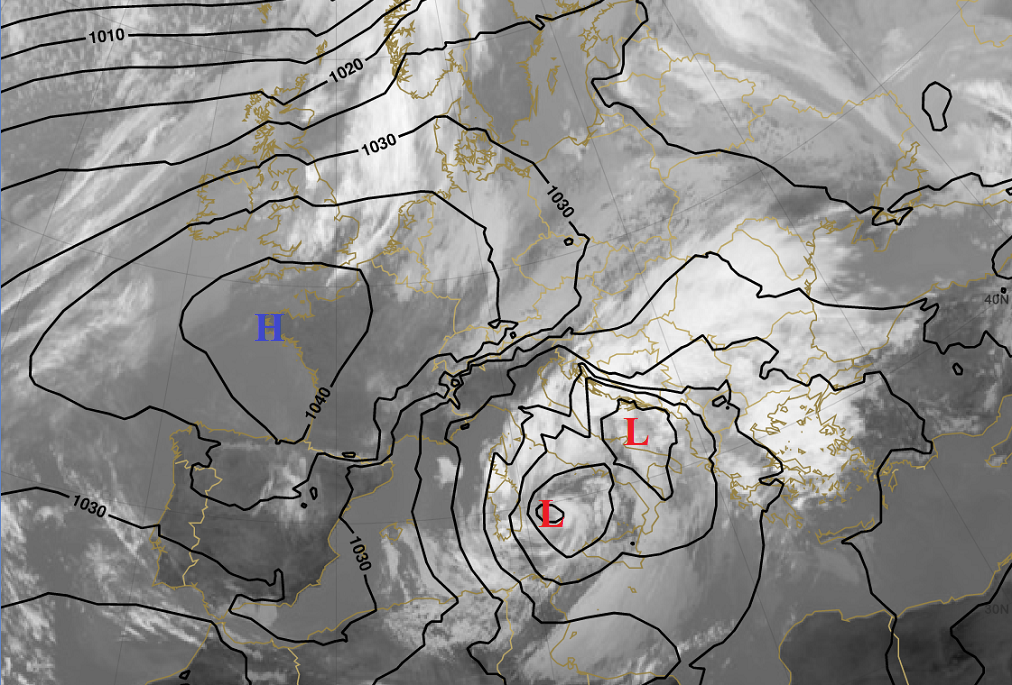
MSLP in anticyclonic (clear) bora cases
|
09 February 2015/12.00 UTC - Meteosat 10 IR 10.8 image; black: mean sea level pressure
|
|
|
|
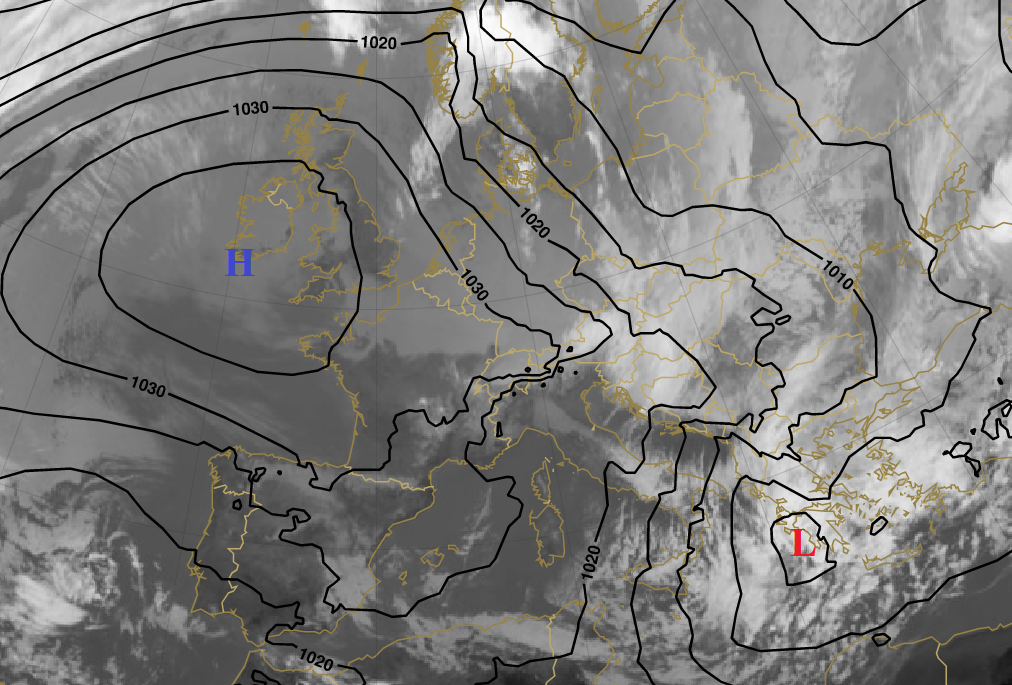
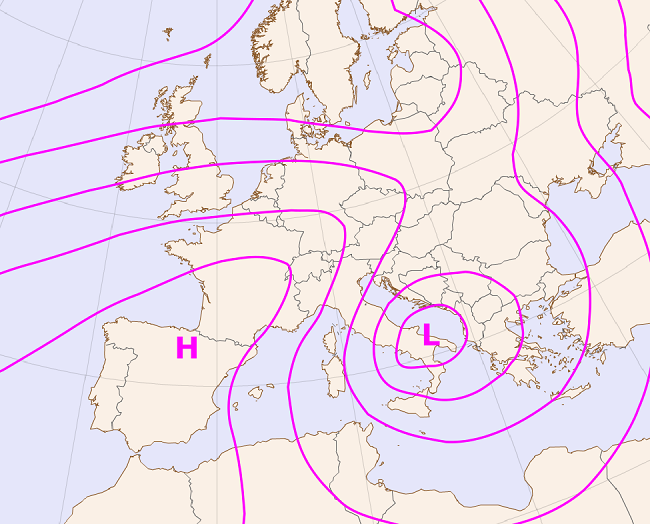
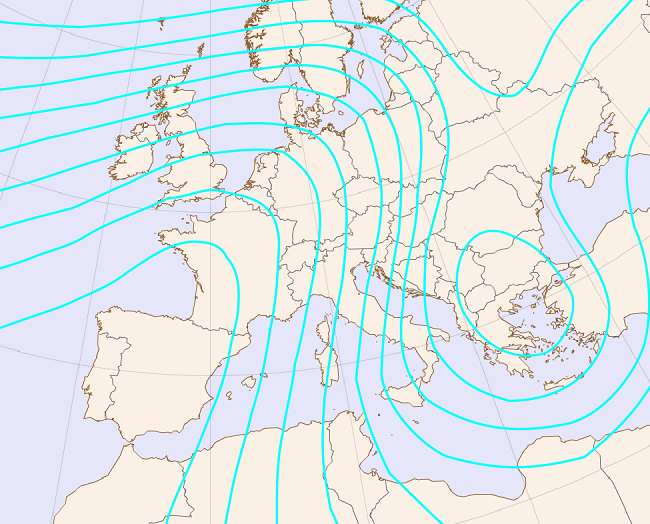
MSLP in cyclonic (dark) bora cases
|
05 March 2015/12.00 UTC - Meteosat 10 IR 10.8 image; black: mean sea level pressure
|
|
|
|
AT 500 hPa
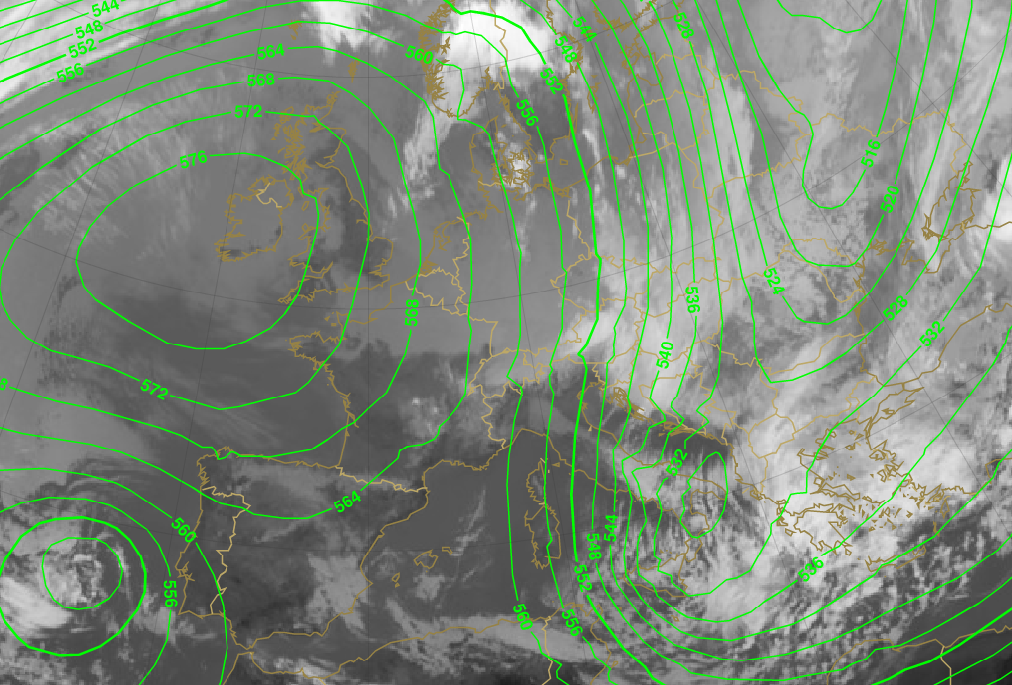
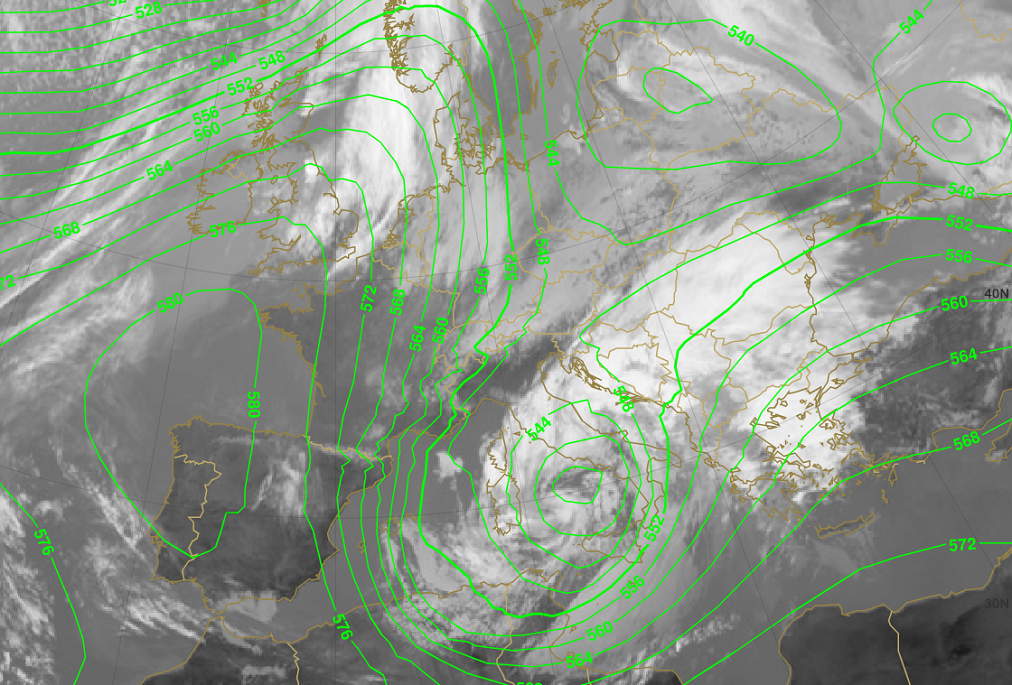
AT 500 in anticyclonic (clear) bora cases
|
09 February 2015/12.00 UTC - Meteosat 10 IR 10.8 image; green: height contours 500 hPa
|
|
|
|
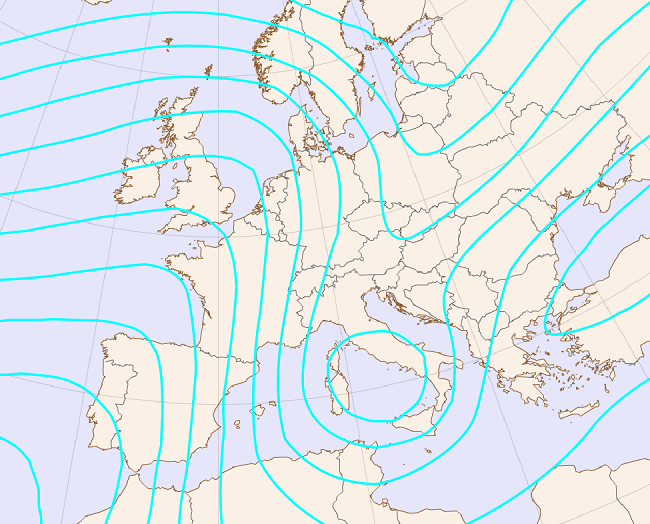
AT 500 in cyclonic (dark) bora cases
|
05 March 2015/12.00 UTC - Meteosat 10 IR 10.8 image; green: height contours 500 hPa
|
|
|
|
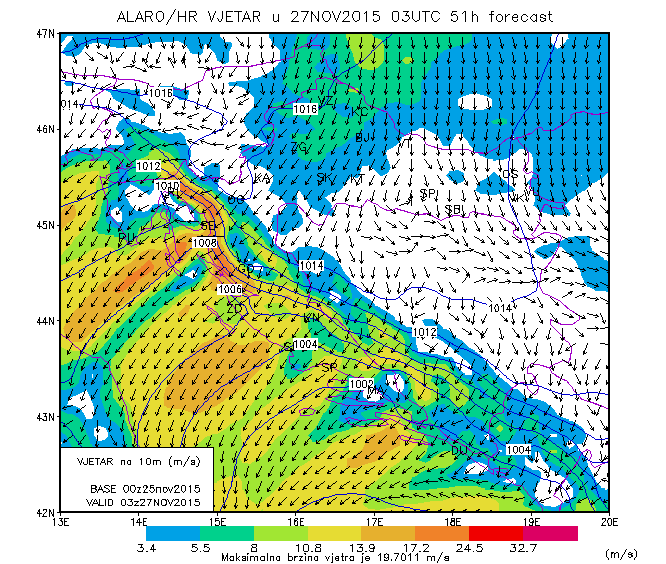
10m wind
|
27 November 2015/03.00 UTC - 10 m wind
|
|
|
|
Isotachs 300 hPa
|
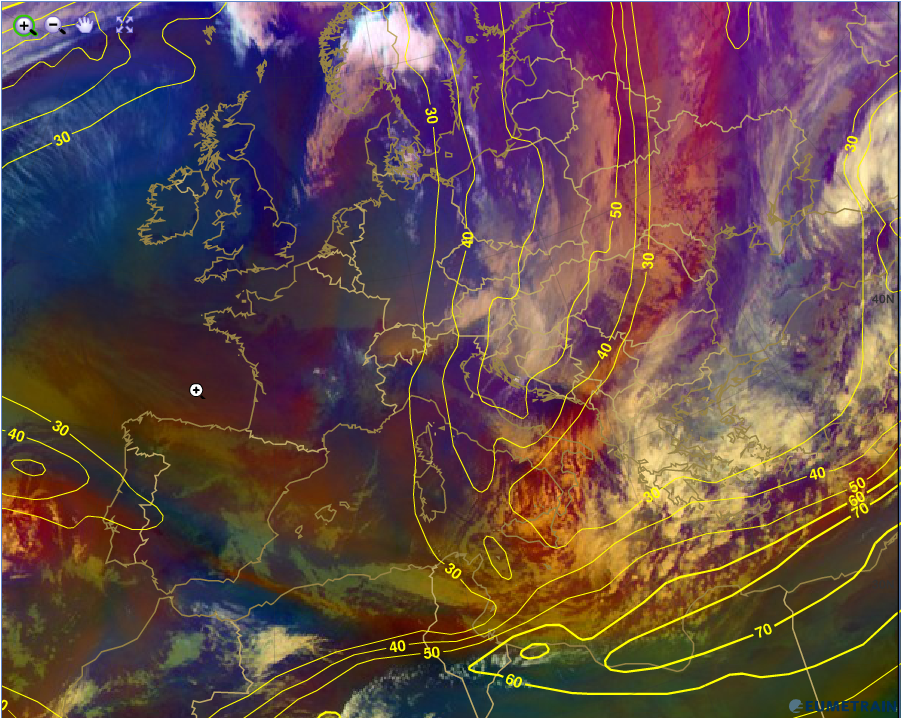
09 February 2015/12.00 UTC Meteosat 10 Airmass RGB image; yellow: isotachs 300hPa
|
|
|
|
Typical Appearance In Vertical Cross Sections
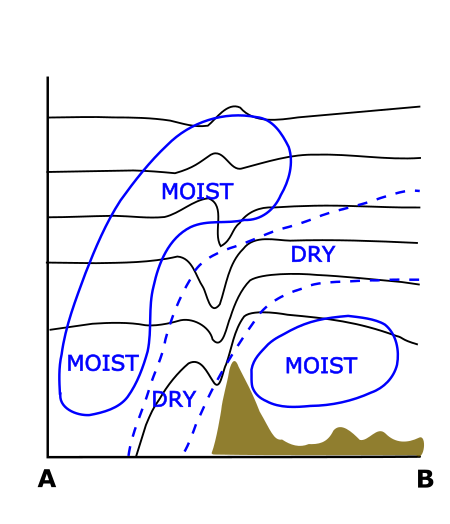
In all strong to severe bora cases, the most prominent feature in vertical cross sections is the hydraulic jump signature, occurring along the flow. In a hydraulic jump a mountain wave steepens until it breaks, which can be seen in the vertical distribution of the potential temperature (Θ) above the top of Mt. Velebit and the uppermost part of the slope on the leeward side.
Downward sloped isentropes with very steep fall can be found directly above the mountain slope on the leeward side.
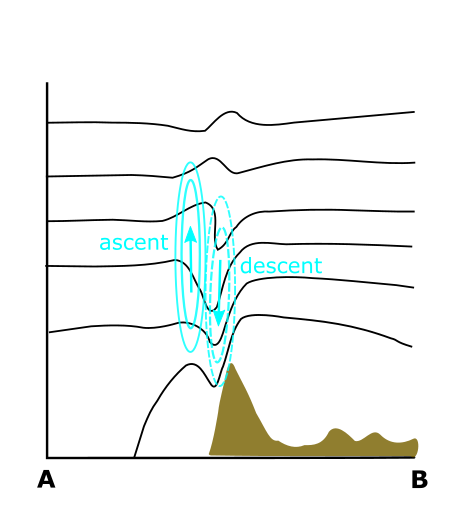
Since the flow is parallel to the isentropes, the denser they are, the higher the wind speed. The mountain waves are located above the leeward mountain slopes and they are steepest just past the mountain tops. The downward sloped isentropes are followed by upward sloped ones, which is clearly seen in the ω cross section with maxima of descending and ascending motions very close to each other.
Another important feature is the flow of dry and colder air across the mountain chain, visible in relative humidity cross sections. Dry air flows across the mountains and falls down toward the sea. This usually causes cloud dissipation and clear skies in most bora cases.
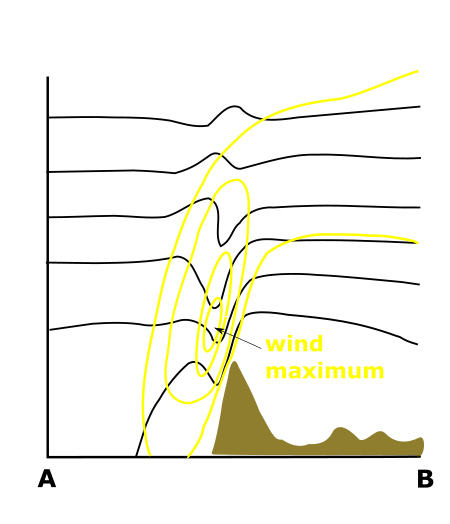
In a cross section covering high mountains on the upwind side, wind velocity is greater in the upper layers, whereas on the lee side the wind is strongest in the lowest part of the troposphere, up to 1 or 1.5 km above the ground. The wind is at its strongest directly above the mountain slope and immediately next to it at the leeward side due to the hydraulic jump, which dissipates energy downstream. There are, however, many locations where the strongest wind is blowing through the mountain passes or gaps. In those locations bora can have large wind speeds much further down (close to the ground) and quite far away from the mountain, over the sea because there is no hydraulic jump to dissipate the energy. The dynamics of those bora cases are mainly mesoscale and are not necessarily related to the mountain wave breaking (the latter pertains to most severe bora cases). Instead, they arise from gap flows through mountain passes. Such flows are often generated and enhanced by upwind pools of relatively cool air basins near the coastal mountains.
Large values of downward vertical velocity are present in a very narrow area just above the top of the mountain and the uppermost part of the leeward slope. A very narrow area of strong upward motion is found next to it.
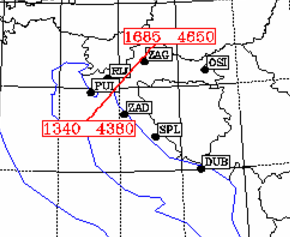
| Location of the cross section |
|
|
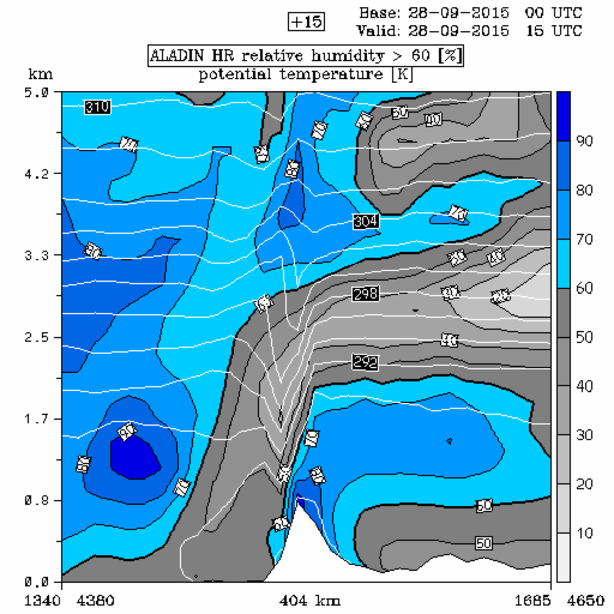
28 September 2015/15.00 UTC - Vertical cross section; white: potential temperature (K); shades: relative humidity (blue: moist, grey: dry)
|
|
|
|
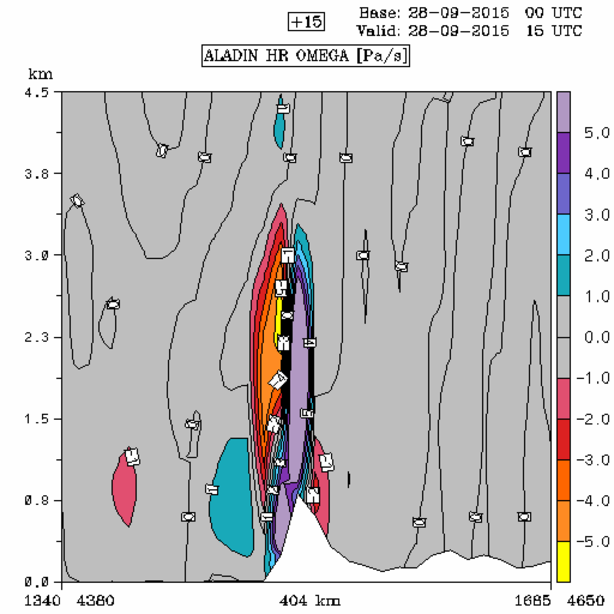
|
28 September 2015/15.00 UTC - Vertical cross section; shades: vertical velocity (red:upward, blue:downward)
|
|
|
|
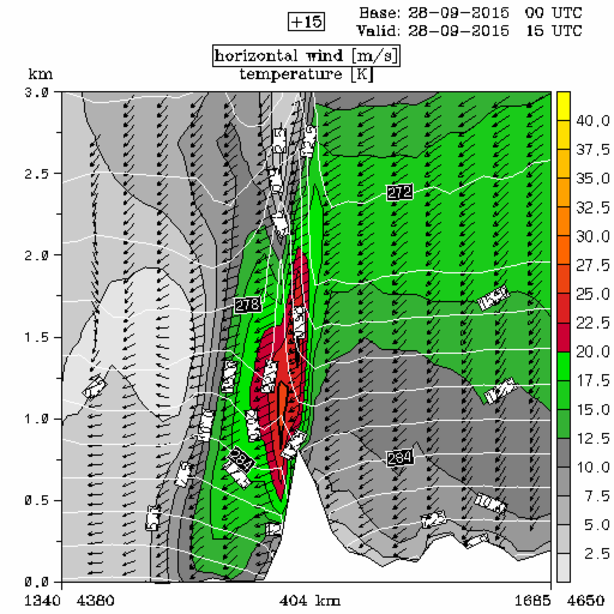
|
28 September 2015/15.00 UTC - Vertical cross section; white lines: temperature; arrows - horizontal wind direction; shades - horizontal wind speed
|
|
|
|
Weather Events
| Parameter | Description |
|---|---|
| Wind, Wind gusts |
|
| Temperature |
|
| Humidity |
|
| Waves |
|
|
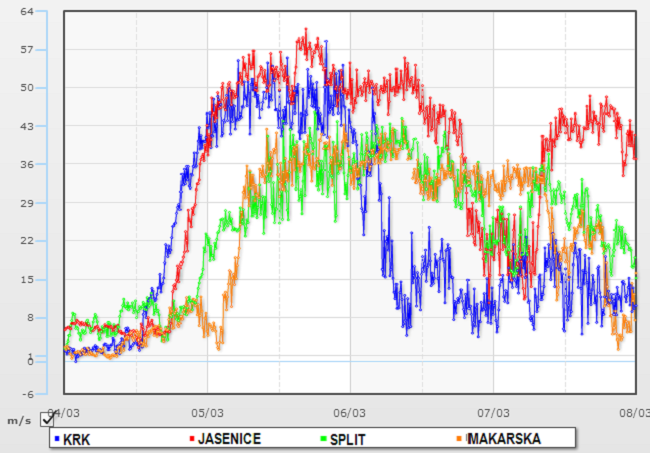
10 min maximum wind speeds (m/s) measured at some stations during one of the most severe bora episodes in March 2015.
|
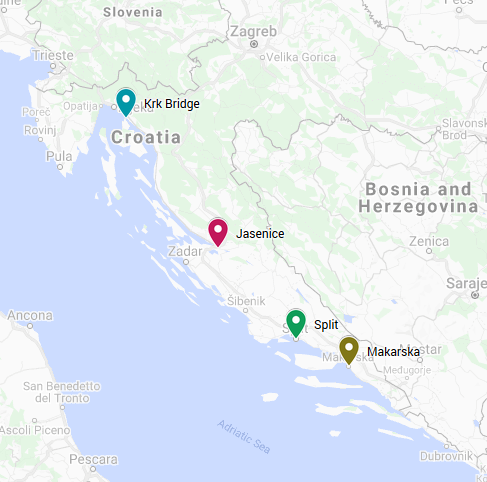
Locations of the measurement stations.
|
|
|
Because of the wavy structure that can often occur during bora events, clouds appear at different heights, with different cloud phases, temperatures and microphysics. Therefore, different SAFs can be useful for detecting these features.
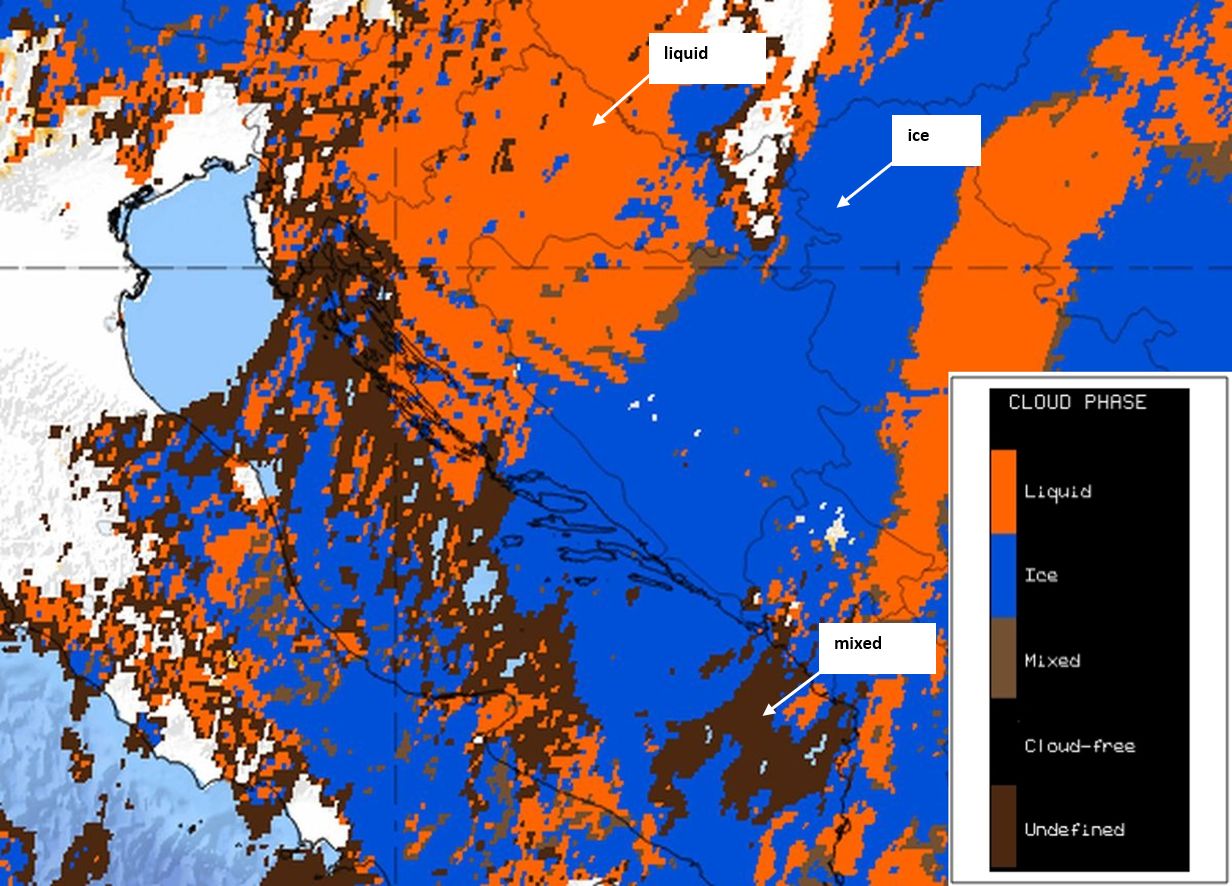
Cloud Phase product from 05 February 2020, 12 UTC.
The Cloud Phase product discriminates between liquid and ice phases. In combination with the Cloud Top Height product, the three-dimensional structure of the waves can be clearly visualized.
The Cloud Optical Thickness product provides information about the density and transmissivity of the cloud layer. It shows that clouds are thicker at the wave crests (red stripes) than at the wave troughs (between red stripes).
|
|
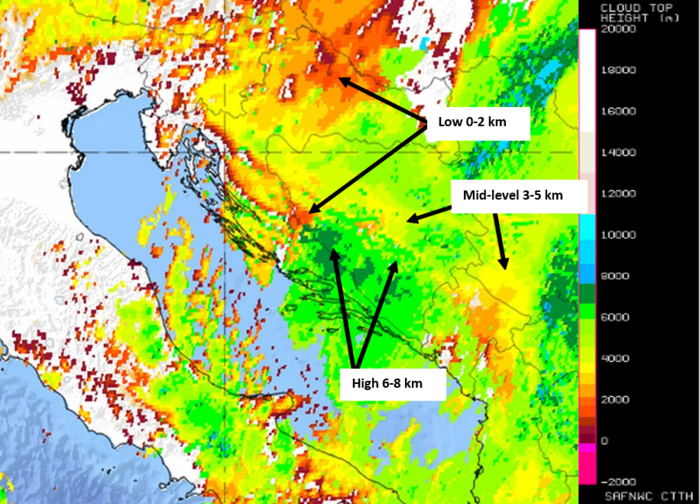
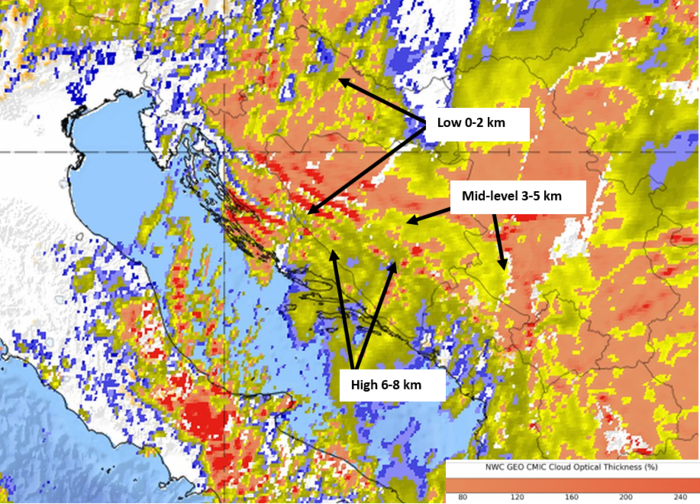
Cloud Top Height product (left) and Cloud Optical Thickness product (right) from February 5 2020, 12 UTC.
References
- Enger, L. and B. Grisogono, 1998: The response of bora-type flow to sea surface temperature. Quart. J. Roy. Meteorol. Soc. 124, 1227-1244.
- Grisogono, B. and D. Belušić, 2009: A review of recent advances in understanding the meso and microscale properties of the severe Bora wind. Tellus 61A, 1-16.
- Grubišić, V., 2004: Bora-driven potential vorticity banners over the Adriatic. Quart. J. Roy. Meteorol. Soc. 130, 2571-2603.
- Klemp, J.B. and D.R. Durran, 1987: Numerical modelling of Bora winds. Meteorol. Atmos. Phys. 36, 215-227.
- Kuzmić, M., B. Grisogono, X.-M. Li, and S. Lehner, 2015: Discerning a deep and a shallow Adriatic bora event. Quart. J. Roy. Meteorol. Soc., 141, 3434-3438.
- Smith, R.B., 1987: Aerial observations of the Yugoslavian Bora. J. Atmos. Sci. 44, 269-297.
- Stiperski, I., B. Ivančan-Picek, V. Grubišić and A. Bajić, 2012: Complex bora flow in the lee of Southern Velebit. Quart. J. Roy. Meteorol. Soc., 138, 1490-1506.