Cloud Structure In Satellite Images
The term Baroclinic Boundary is used to describe a front like cloud band, which is oriented differently compared with those associated with an actual front. It can also be distinguished from stationary fronts and air mass boundaries. A Baroclinic Boundary does not propagate significantly. An investigation was carried out on 60 cases.
The investigation showed Baroclinic Boundaries at several typical locations (e.g. indicated by the height field at 500 hPa):
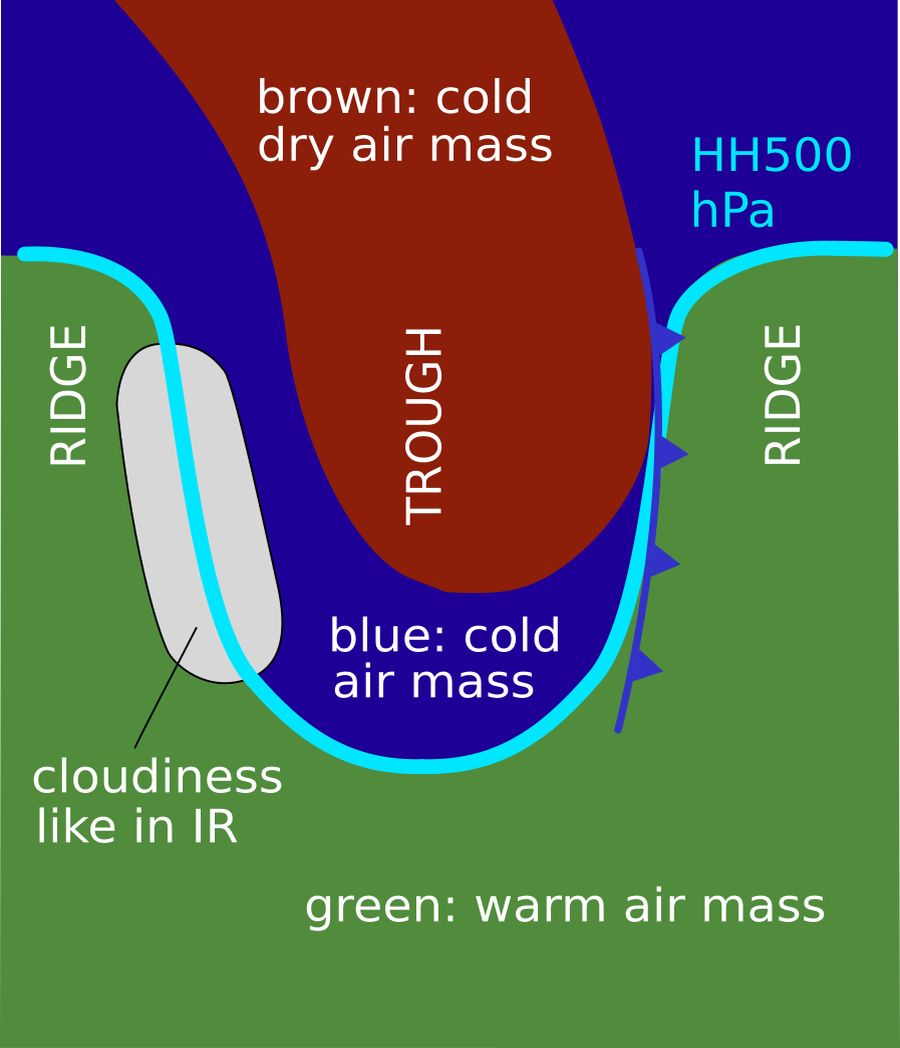
- At the rear of a synoptic scale trough (most frequent type, about 58 cases, schematic below left)
- Baroclinic Boundary associated with an Upper Level Low (6 cases, schematic below middle)
- Baroclinic Boundary associated with a deformation zone at a saddle point in the upper height fields (3 cases, schematic below right)
|
|
|
Appearance in the basic channels
- IR imagery:
- Dark to light grey low and mid-level cloud band
- The Baroclinic Boundary usually appears darker (i.e. warmer cloud tops) than frontal cloud
- Sometimes a bright jet cloud fibre forms or fibrous clouds are embedded within the cloudband
- WV imagery:
- The Baroclinic Boundary appears as a dark grey to grey cloud band sometimes with bright high fibres embedded
- The Baroclinic Boundary generally appears weaker in WV than a frontal cloud band
- VIS imagery:
- Depending on the type of cloud the VIS image shows low white patches or cloud bands. If they exist, thin high cloud fibres appear grey.
Appearance in the basic RGBs:
Airmass RGB
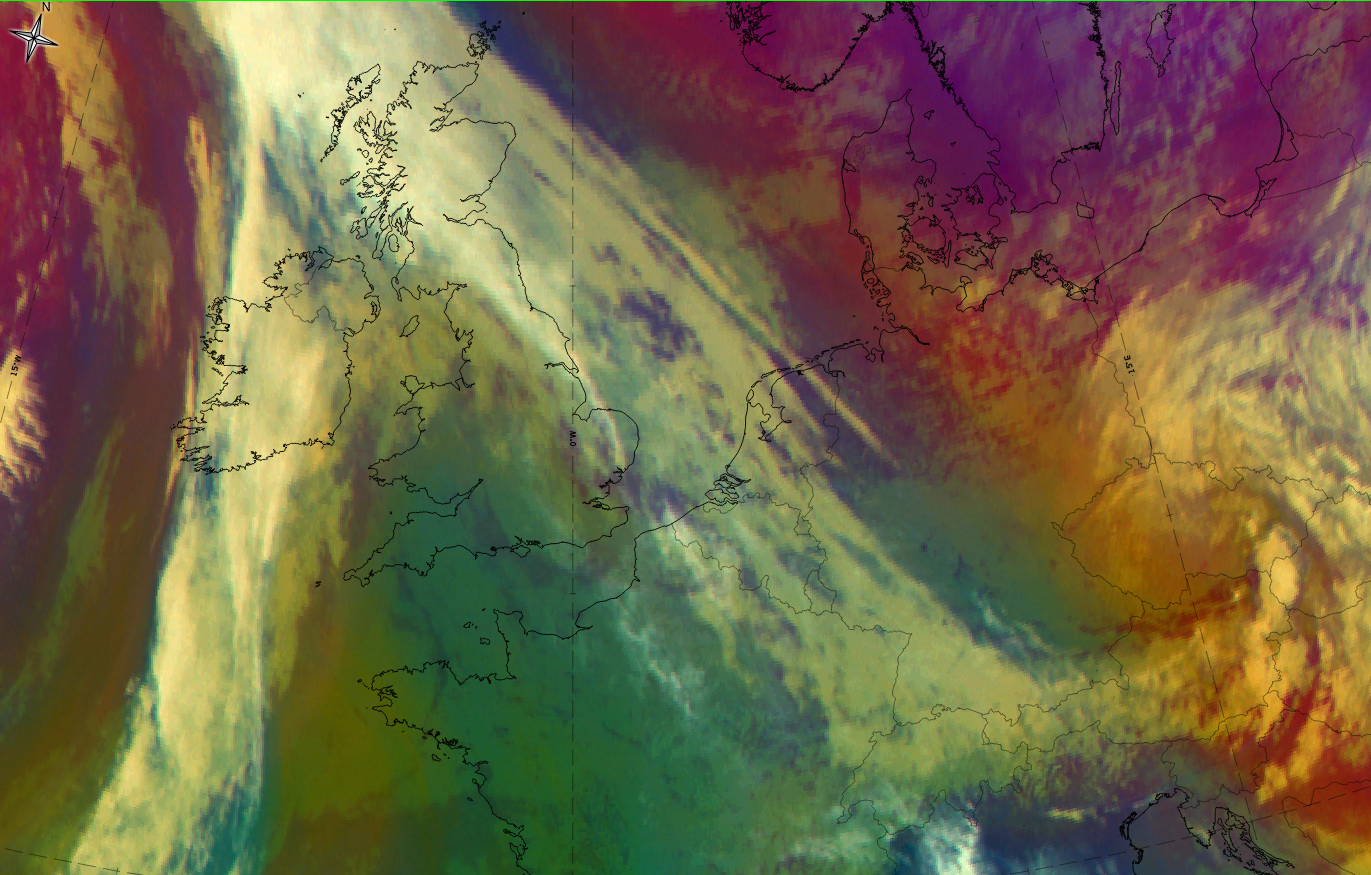
In the Airmass RGB there are usually blue to brown colours in front of the baroclinic boundary (the cyclonic side), representing the airmasses in the upper level trough area, and greenish colours in the warm sector of the subsequent frontal system representing the warm air.
The cloud band itself appears very similar to that in the IR image.
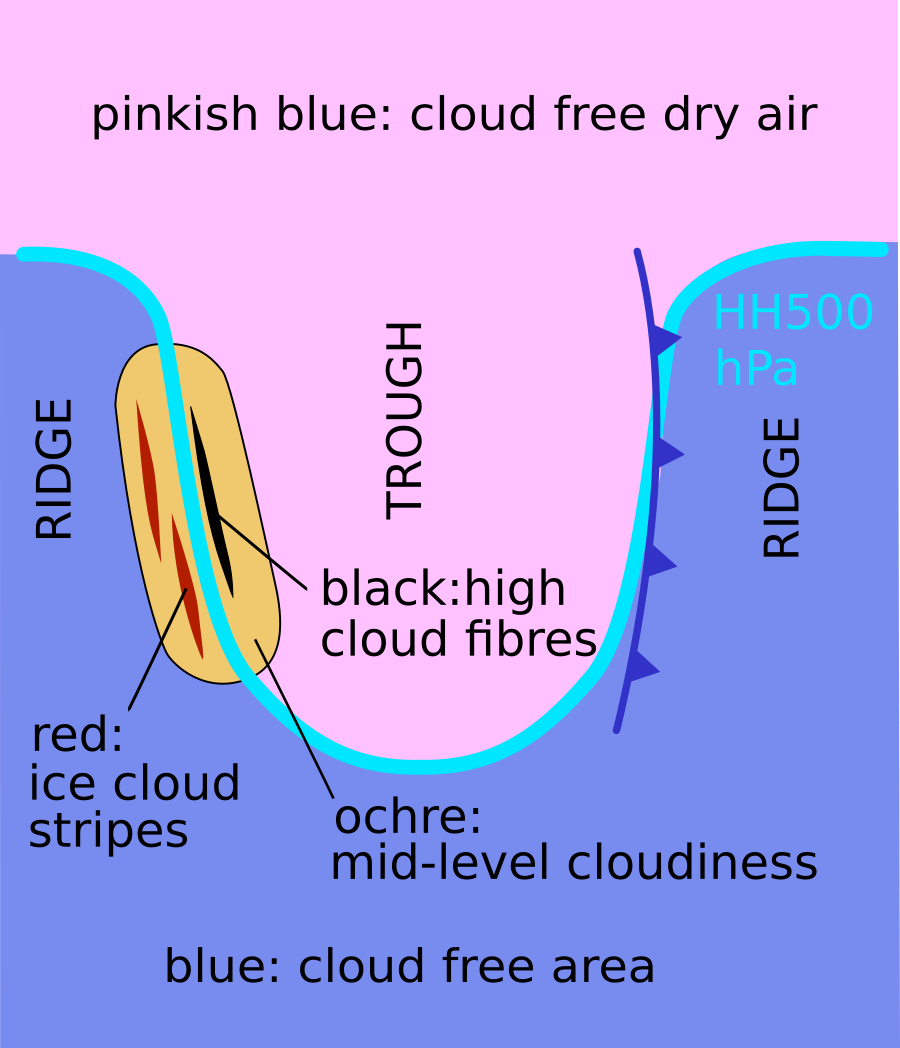
Dust RGB
In the Dust RGB there are blue to pinkish blue colours on both sides of the baroclinic cloud band where there are cloud free areas; often cloud systems are often included and these appear mostly as ochre colours representing low to mid-level cloud.
The cloud band of the baroclinic boundary has mostly yellowish to ochre colours, typical for mid-level cloud, and some dark red to black stripes and patches where there are thicker and/or higher cloud fibres above the mid-level cloud. Black fibres can also occur, mostly at the cloud edges, representing high translucent cloud fibres.
 |
 |
Basic RGB schematics. Left: Airmass RGB; Right: Dust RGB.
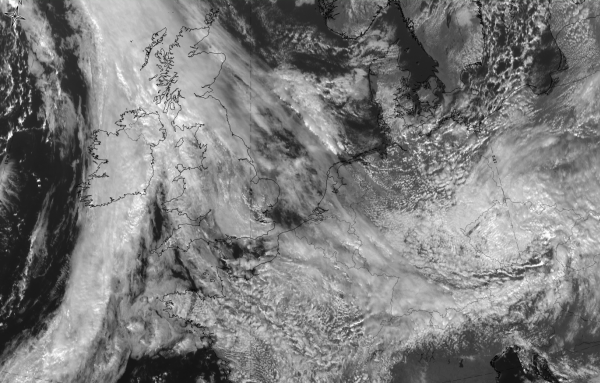
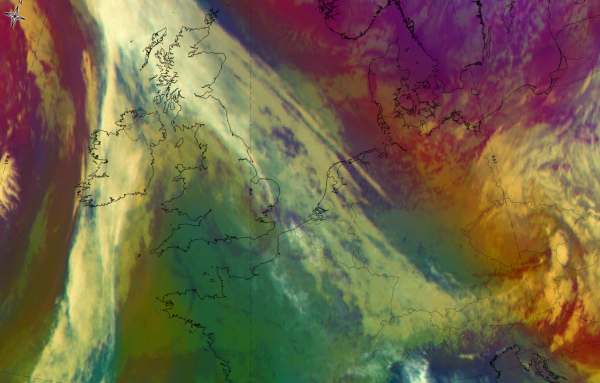
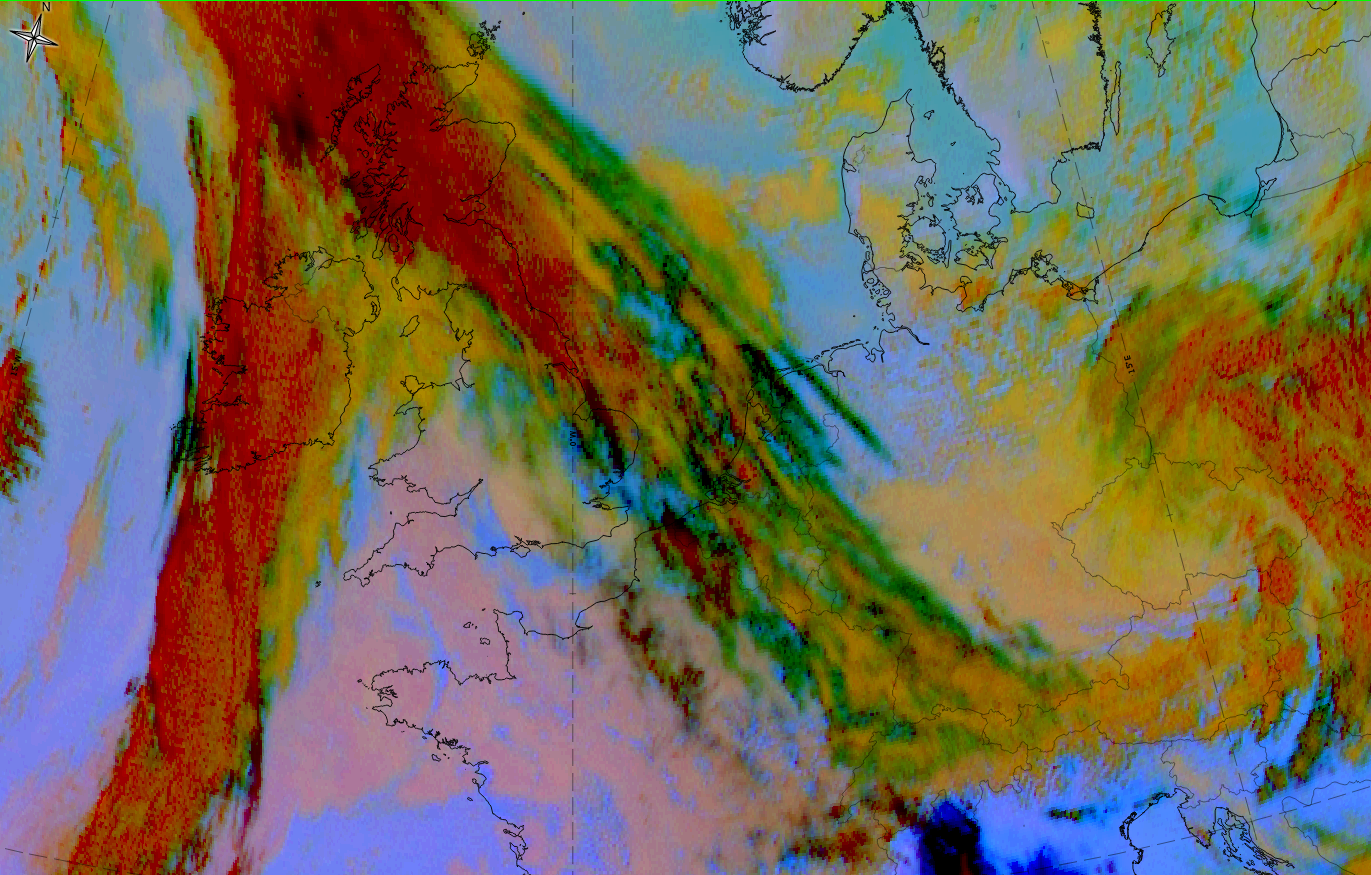
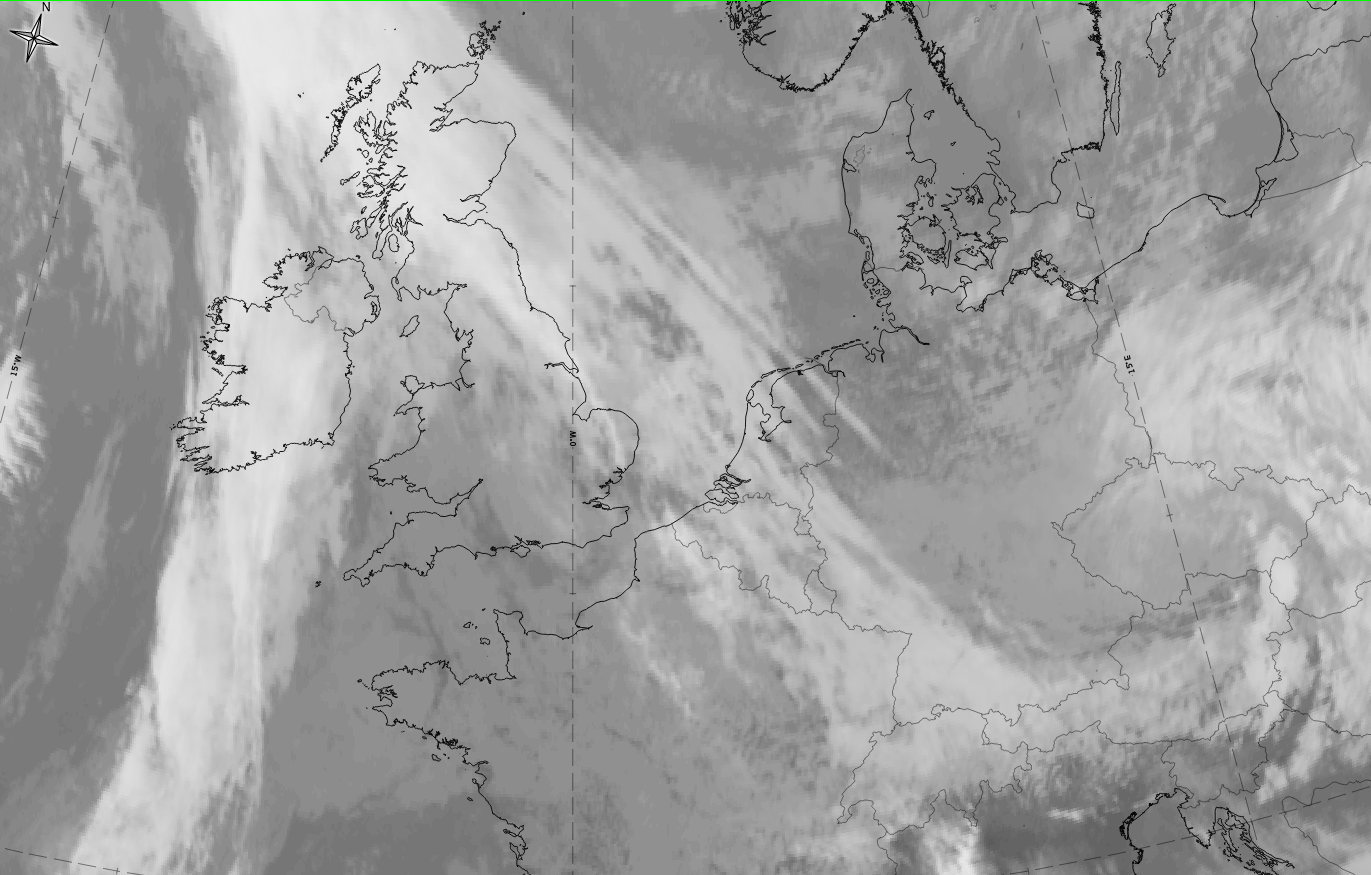
The case from 5 October 2019 at 12UTC is a good example of a baroclinic boundary cloud band at the rear side of an upper level trough. It extends from the North Sea across the Netherlands to the western Alps.
|
|
|
|


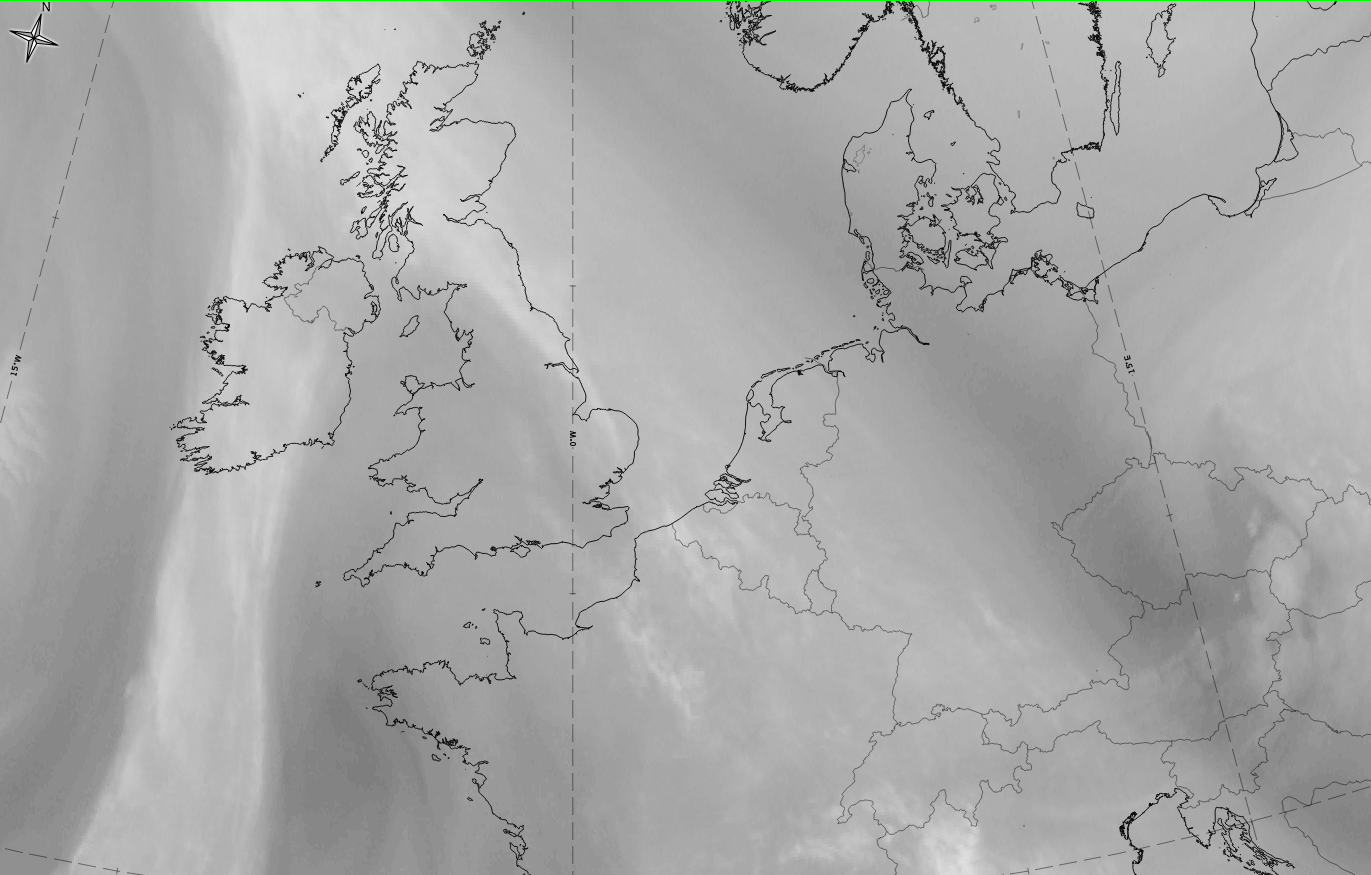
5 October 2019, 12 UTC: 1st row: IR (above)+ HRV (below); 2nd row: WV above) + Airmass RGB (below); 3rd row: Dust RGB + image gallery
*Note: click on the Dust RGB image to access image gallery (navigate using arrows on keyboard)
| IR | Grey colours with partly fibrous structure. |
| HRV | Some grey cloud patches bust mostly cloud fibres. |
| WV | Grey band of high humidity with some brighter cloud fibres. |
| Airmass RGB | Brown colours to the NE, representing the cold dry air in the trough in front of the baroclinic boundary; bluish colours around the cloud band and greenish colours representing warm air in the warm sector at the rear of the baroclinic boundary. |
| Dust RGB | Ochre colours for low and mid-level clouds, black stripes for high translucent cloud fibres and green colours for thin medium and/or low level cloud. |