Key Parameters
Pressure and Wind Velocity at 850, 500 and 200 hPa:
- TC pressure: areas of relatively low and medium pressure in the troposphere, with the largest pressure perturbations occurring at low altitudes near the surface. The environment near the center of tropical cyclones is warmer than the surrounding area at all altitudes, which is why TCs are characterized as "warm core" systems.
- TC wind velocity: air rotating rapidly around a center of circulation while also flowing radially inwards. Air flows radially inwards at low levels and begins to rotate cyclonically in order to conserve angular momentum.
- TC cyclonic rotation: rapidly rotating air flows radially outwards near the tropopause, its cyclonic rotation decreases and ultimately changes sign when the radius is large enough, resulting in an upper-level anti-cyclone. The result is a vertical structure characterized by a strong cyclone at low levels and a strong anti-cyclone near the tropopause. From the concept of thermal wind balance, we can see that this corresponds to a system that is warmer at its center than in the surrounding environment at all altitudes (i.e. "warm-core").
- Equivalent Potential Temperature - TC potential temperature: the warm core results in lower pressure at the center at all altitudes, with the maximum pressure drop located at the surface. The surface temperature and humidity (the equivalent potential temperature of the surface air) determine the temperatures attained aloft in convection, and therefore the potential temperature at the top of the eyewall.
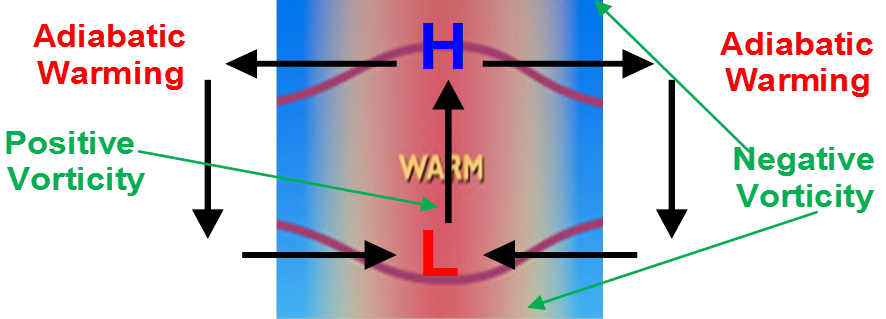
- TC temperature: Heating produces a local temperature anomaly (like a buoyant updraft) which disturbs the local pressure surfaces. This effect on the local pressure surfaces induces a local secondary circulation. The inner circulation has a more confined radius than the outer.
- Negative vorticity gradient: waves move against the mean wind.
- Positive vorticity gradient: waves move with the mean wind.
|
Schematic of TC local heat sources.
|
|
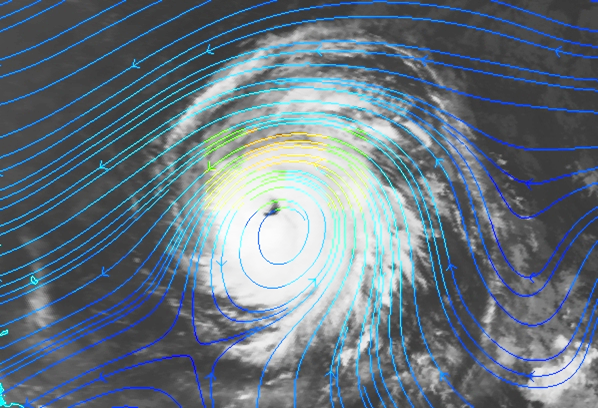
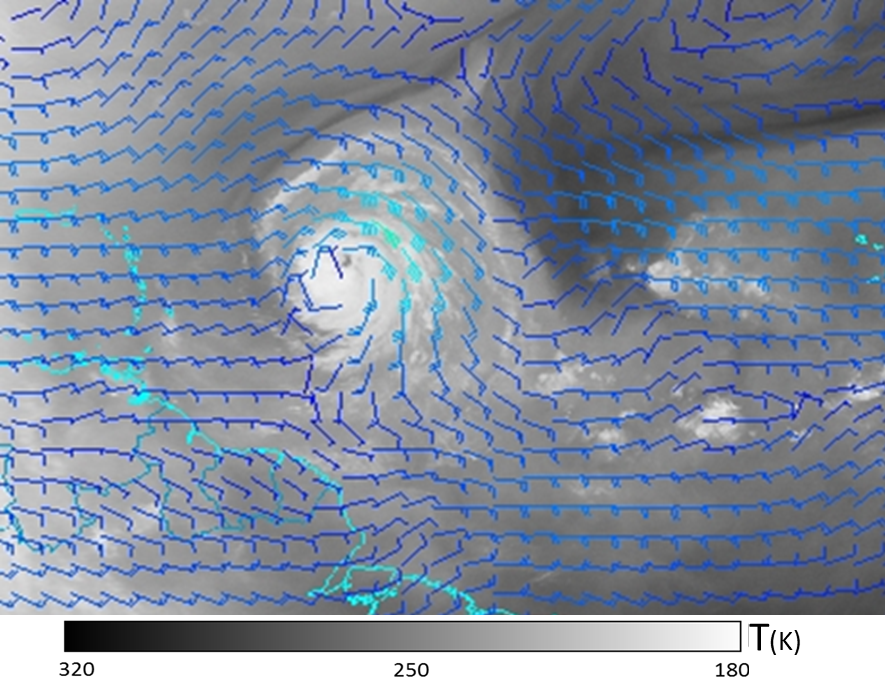
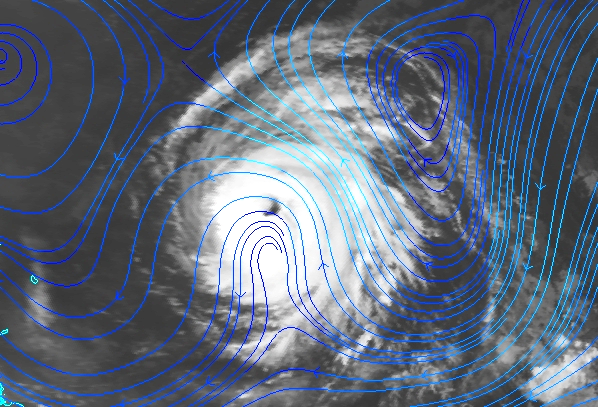
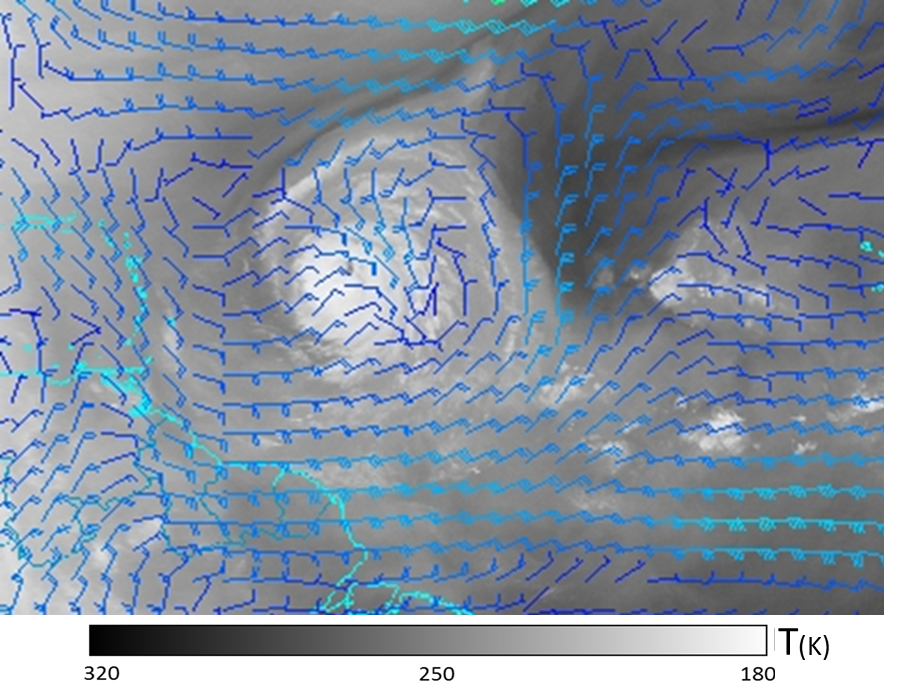
When viewed from the Meteosat-9 WV image of TC Bill (2009) and supplemented with the GFS analysis of 850, 500 and 250 hPa streamlines and winds, the 850 hPA and 500 hPa streamline patterns associated with TC Bill exhibit a closed circulation. Notice how the 250 hPa streamline pattern indicates upper-tropospheric streamline confluence above TC Bill, and an area of convergence. The winds are rushing towards the center of this TC, forcing air upwards at the center. Strong surface winds in a TC boundary layer generate upwelling beneath the storm. This therefore maximizes the moisture transport from the ocean and subsequent latent heat production.
|
18 August 2009 / 12 UTC. Combined Meteosat-9 WV and GFS analysis of 850 hPa streamlines for TC Bill.
|
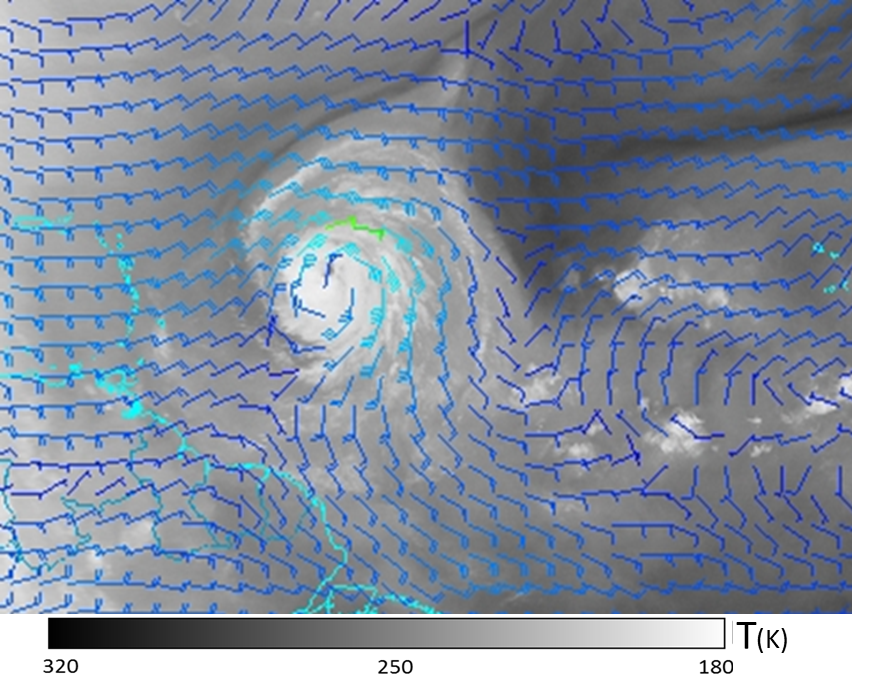
18 August 2009 / 1200 UTC. Combined Meteosat-9 WV and GFS analysis of 850 hPa winds (speed and direction) of TC Bill (2009).
|
|
|
|
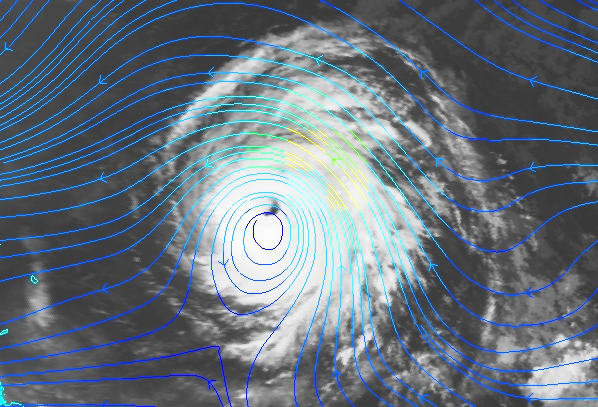
18 August 2009 / 12 UTC. Combined Meteosat-9 WV and GFS analysis of 500 hPa streamlines for TC Bill.
|
18 August 2009 / 1200 UTC.Combined Meteosat-9 WV and GFS analysis of 500 hPa winds (speed and direction) of TC Bill (2009).
|
|
|
|
18 August 2009 / 12 UTC. Combined Meteosat-9 WV and GFS analysis of 250 hPa streamlines of TC Bill.
|
18 August 2009 / 1200 UTC. Combined Meteosat-9 WV and GFS analysis of 250 hPa winds (speed and direction) of TC Bill (2009).
|
|
|