Table of Contents
Appearance in Satellite Data
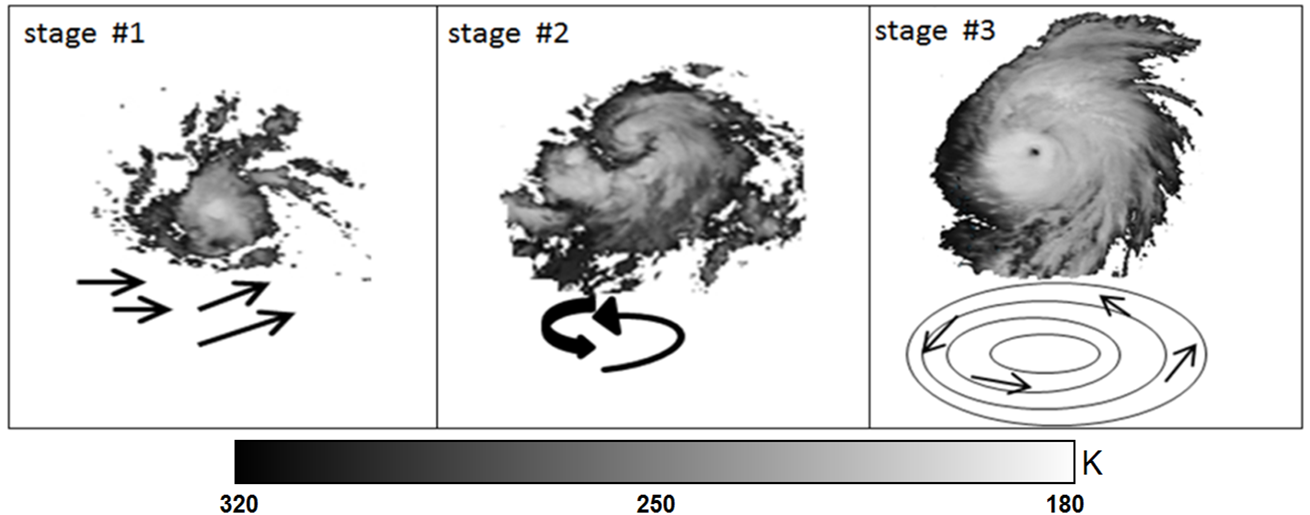
Tropical Cyclones (TCs) evolve through a transformation cycle of stages from a tropical depression (stage #1) to tropical cyclone (stage #3). When viewed on the visible (VIS) , infrared (IR) and water vapor (WV) images, we can see that these tropical disturbances show several common features throughout their transformation in all channels (VIS,IR and WV).
|
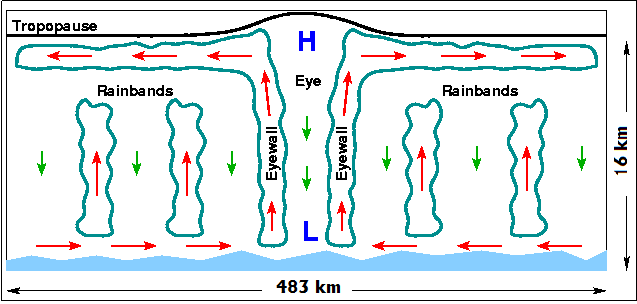
A schematic of a TC at different stages of development. The stronger storm (stage#3) demonstrates the spiral banding, increasing centralization, eye and eyewall (features of TC).
|
|
|
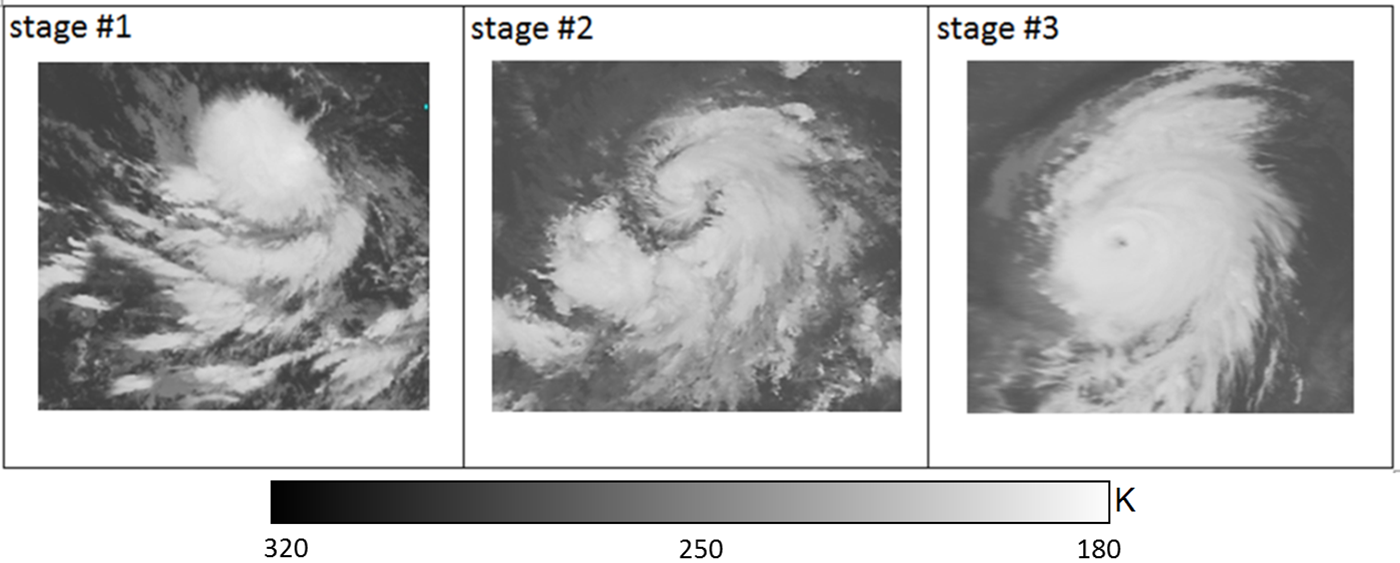
18 August 2009 / 12:00 UTC. Meteosat-9 Visible images of TC Bill (2009) at different stages of development.
|
|
|
18 August 2009 / 12:00 UTC. Meteosat-9 WV images of TC Bill (2009) at different stages of development.
|
|
|
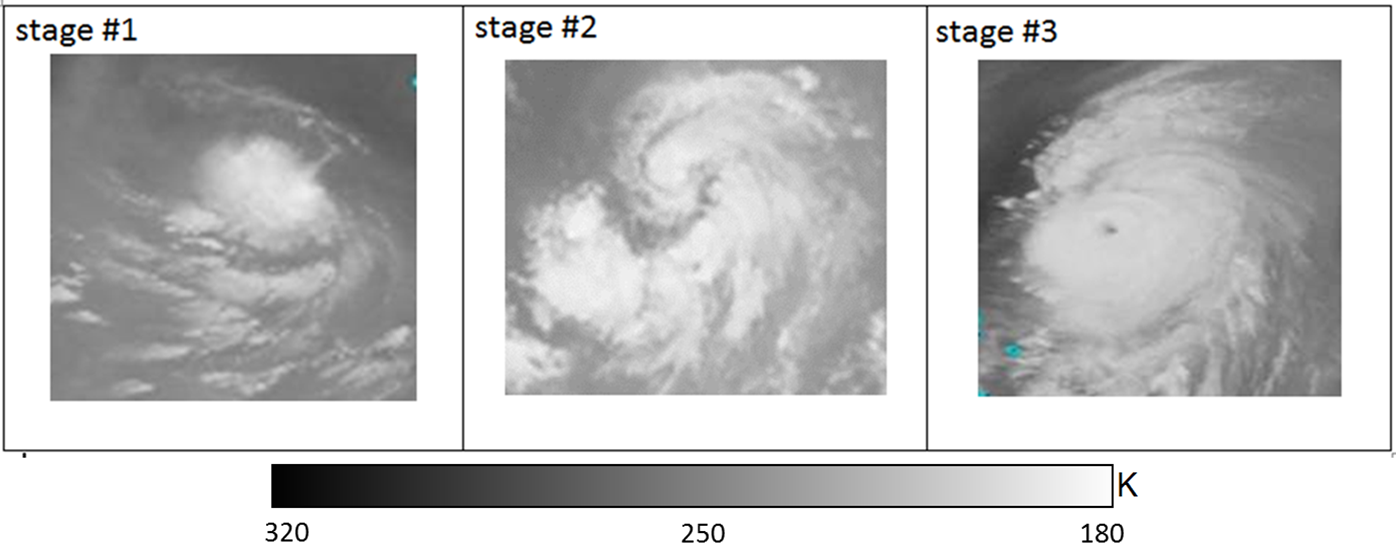
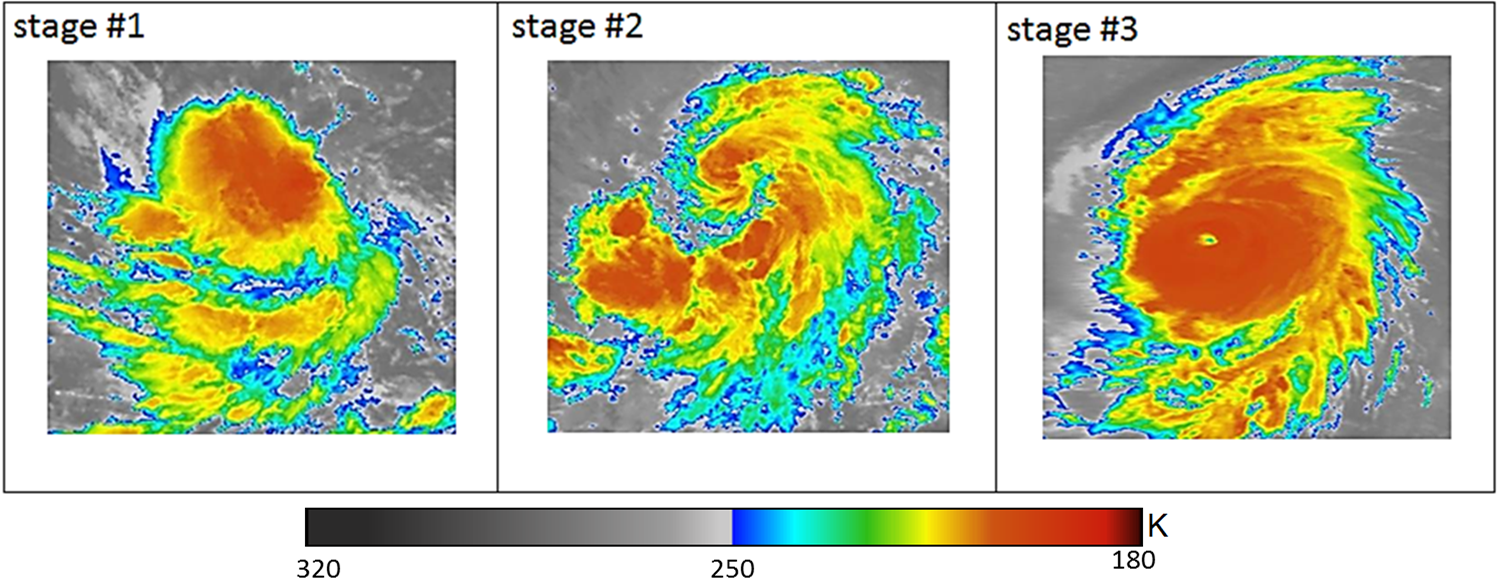
18 August 2009 / 12:00 UTC. Meteosat-9 IR images of TC Bill (2009) at different stages of development.
|
|
Tropical depressions appear to have little organization when viewed from a satellite. Instead of the circular appearance similar to TCs, tropical depressions look more like a group of individual thunderstorms. Once a tropical depression has intensified to the point where its maximum sustained winds are between 63-118 km/h, it becomes a tropical storm. Its rotation becomes more clearly recognizable than that of a tropical depression.
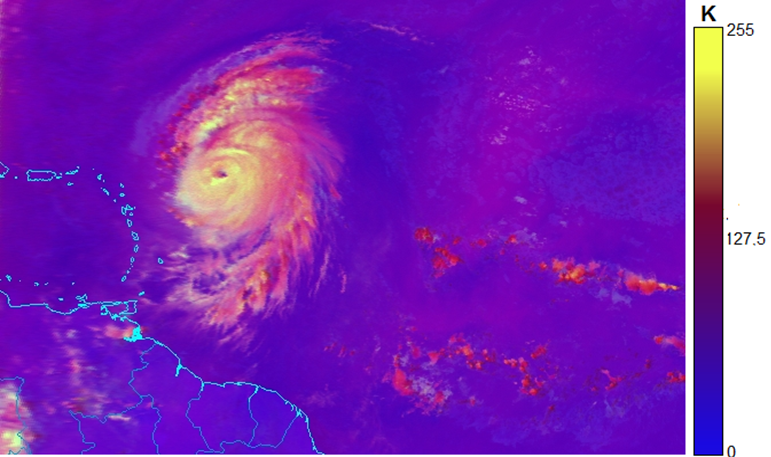
A tropical storm becomes a TC when sustained wind speeds reach 119 km/h. A pronounced rotation develops around the central core. Because of the Earth's rotation, tropical cyclones rotate clockwise in the Southern Hemisphere and counterclockwise in the Northern Hemisphere. They can reach 80-800 km in diameter. The Meteosat-9 IR images, when combined with NWP information, highlight the intense eyewall convection, spiral cloud bands (red) with subsidence between them (light to dark blue) and a clear eye. These features are evident in the enhanced IR images below (stage#3). The eyewall is the region of intense winds and rainfall surrounding the eye. The wide bands of clouds and precipitation spiraling away from the eye wall are known as spiral rain bands.
|
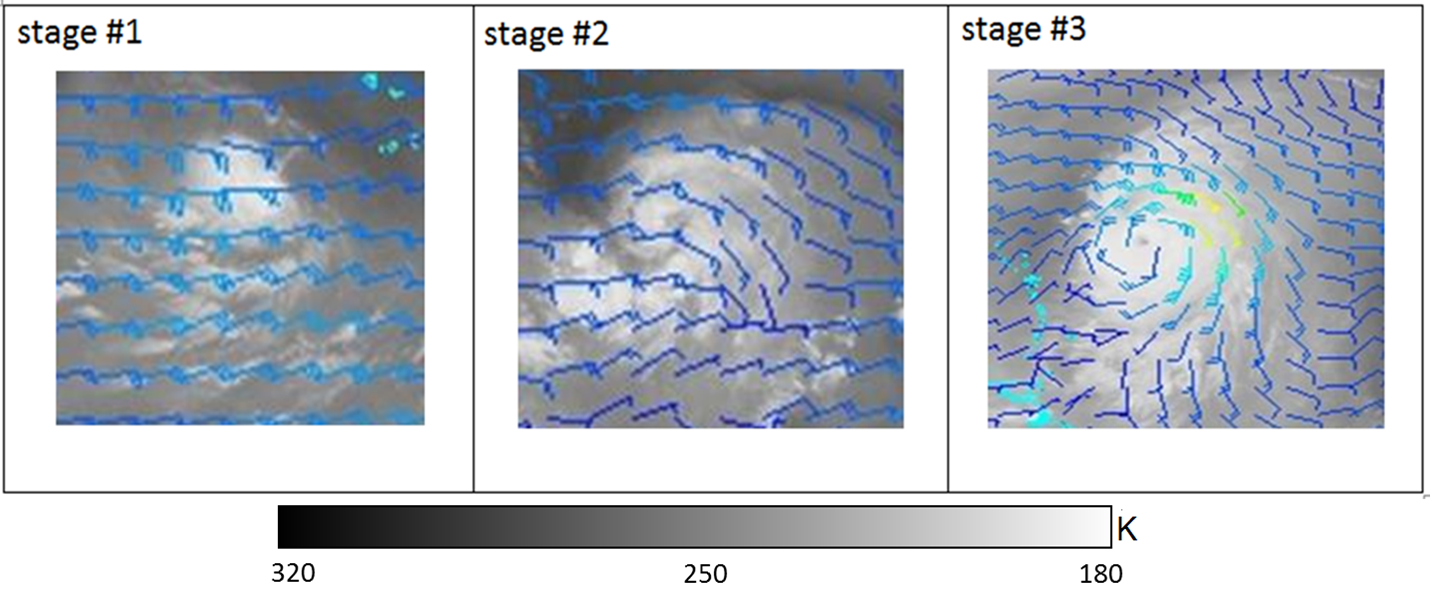
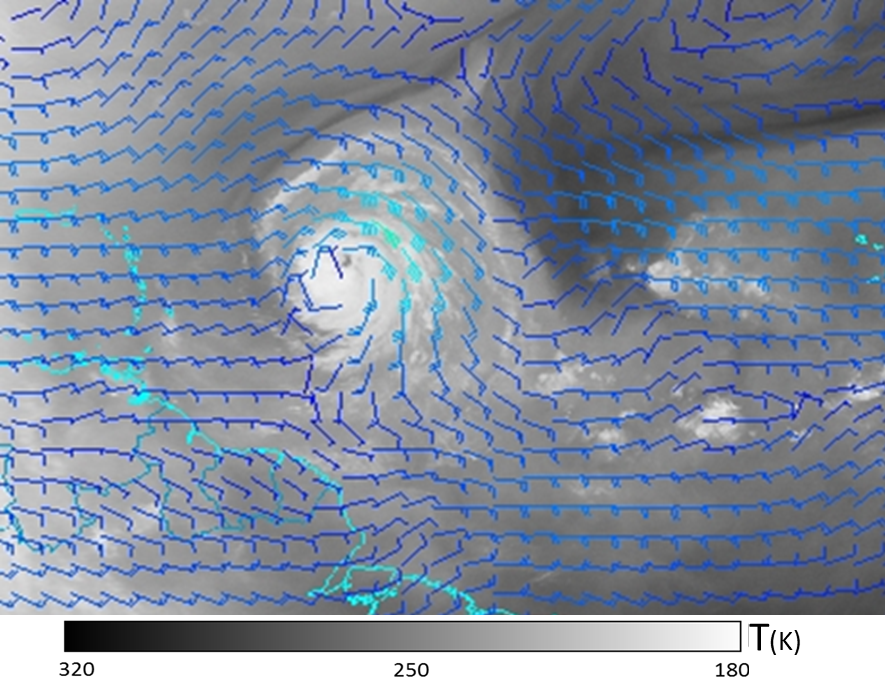
18 August 2009 / 12:00UTC. Combined Meteosat-9 WV images and zonal winds vectors (direction and intensity at 250 hPa) in TC Bill (2009) at different stages of development. Wind vectors based on GFS reanalysis data.
|
|
The Meteosat-9 Enhanced IR images also identify regions of enhanced thermal contrast for the three stages of development in TC Bill (2009). Stage#3 demonstrates the most basic circular shape around the eye, while stage#2 shows a curved band pattern. This curved band pattern is often easier to follow in Enhanced IR images than in visible, WV and IR images.
|
18 August 2009 / 12:00 UTC. Meteosat-9 Enhanced IR images of TC Bill (2009) at different stages of development.
|
|
|
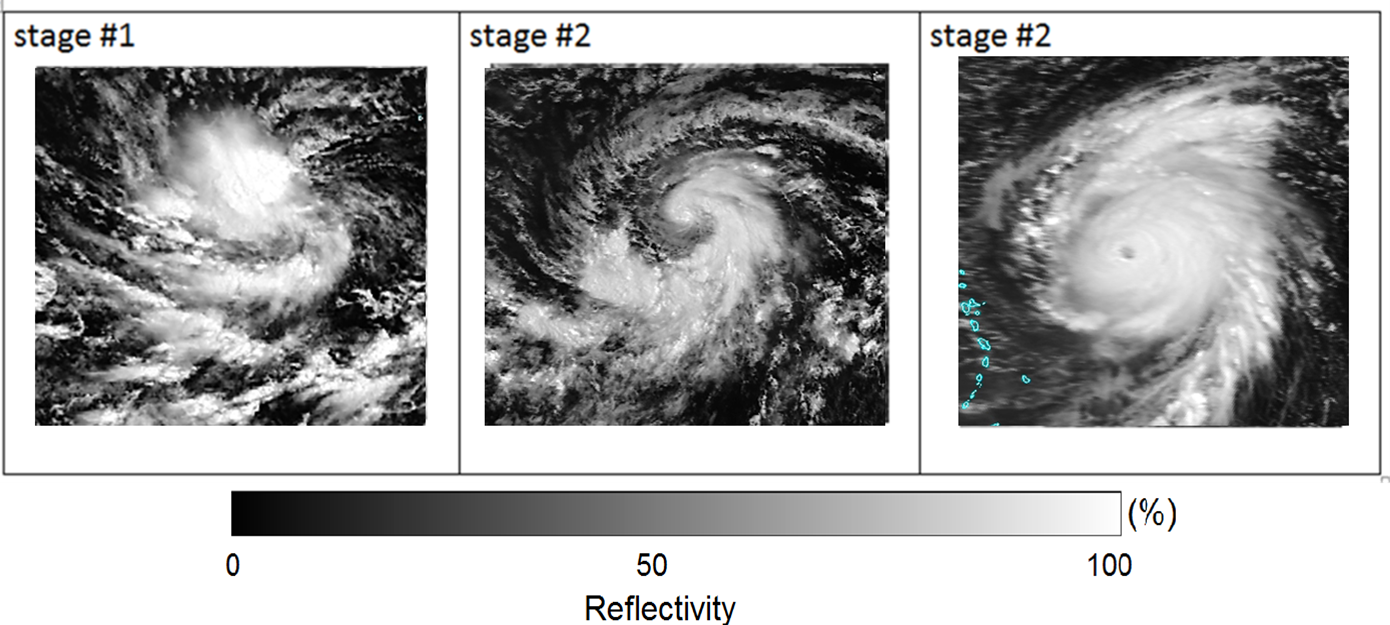
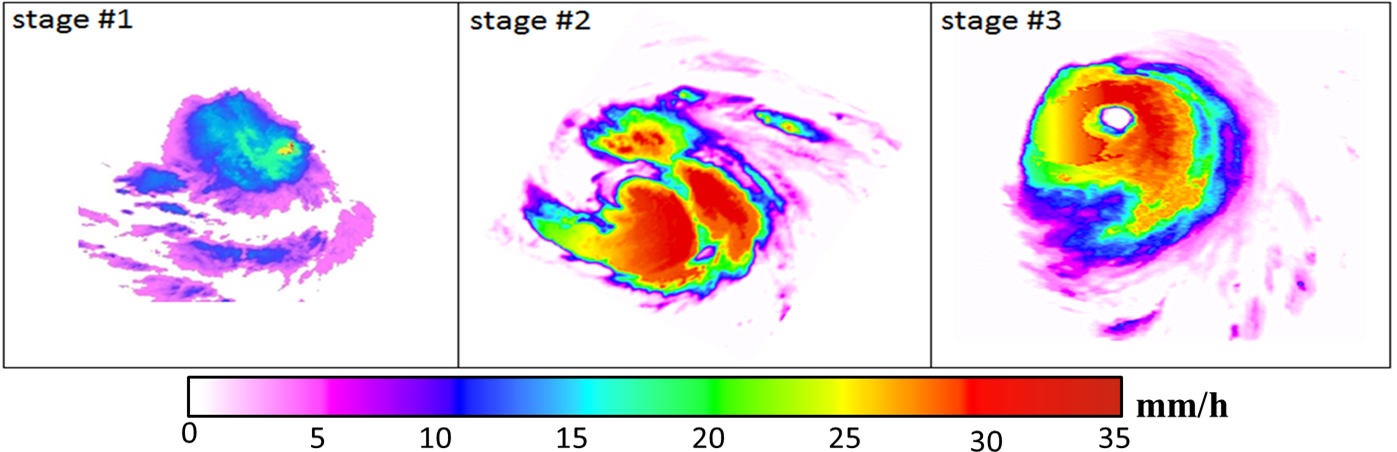
18 August 2009 / 12:00 UTC. Meteosat-9 Multi-sensor Precipitation Estimate (MPE) images of TC Bill (2009) at different stages of development.
|
|
The IR and MPE images can identify the eye pattern, such as the location of the eye, due to the clear contrast between the warmest part of the eye and the coldest convective areas surrounding the eyewall. Convection is often organized into multiple distinct "cells" that rotate cyclonically around the eyewall. These cells are the detectable result of strong updrafts.
The idea behind the curved band pattern is that the intensity of system vorticity is indicated by the extent to which the rainbands are wrapped around the eyewall. Typically, the curved band structure is positioned outside the eyewall, which is associated with stratiform precipitation dominant due to occasional cold pools near the surface. Downdrafts are more common; often containing cool/dry air.
|
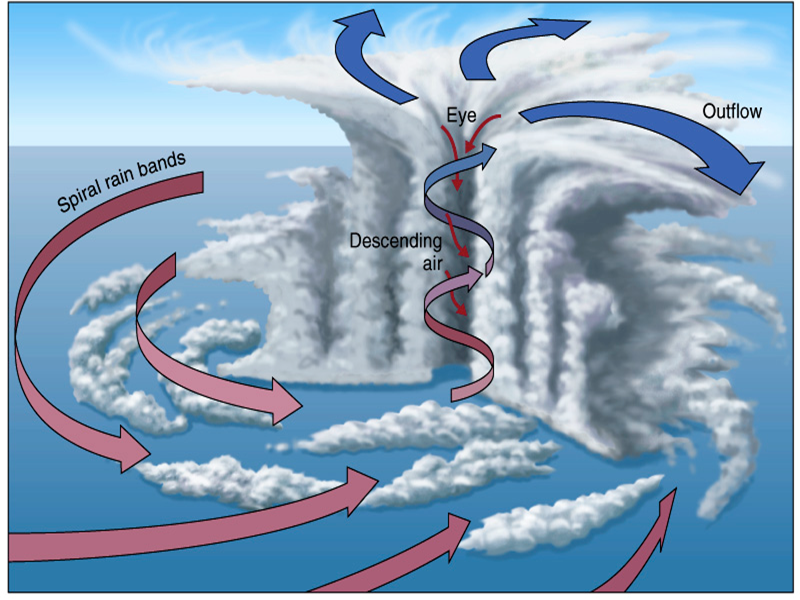
A schematic of radial and vertical wind fields at low and upper levels can be seen in the diagram above (stage#3). The radial inflow and vertical velocity components at low levels are driven by friction in the boundary layer. These components supply the rainbands and eyewall with warm moist air. The radial outflow and vertical velocity at upper levels are driven by the ascending features from below and the pressure gradient associated with the upper- level anticyclone. The ascending features of vertical velocity are driven by low-level convergence and local buoyancy. The descending features of the vertical wind field are driven by mass balance and convergence aloft.
|
|
At the surface, the winds rush towards the center of a TC, where air is then forced upwards. The Coriolis force acts on these surface winds and, in the Northern Hemisphere, the deflection is to the right. The convergence at the eye wall is so strong that the air is lifted faster and with much greater force here than at any other location of the TC. This maximizes moisture transport from the ocean and the subsequent production of latent heat. Outward aloft (below the tropopause) from the eye wall, we can see a a structure of cloud bands. These clouds are known as spiral rain bands (or spiral bands). These features can usually be seen clearly in the visible, infrared and water vapour images.
|
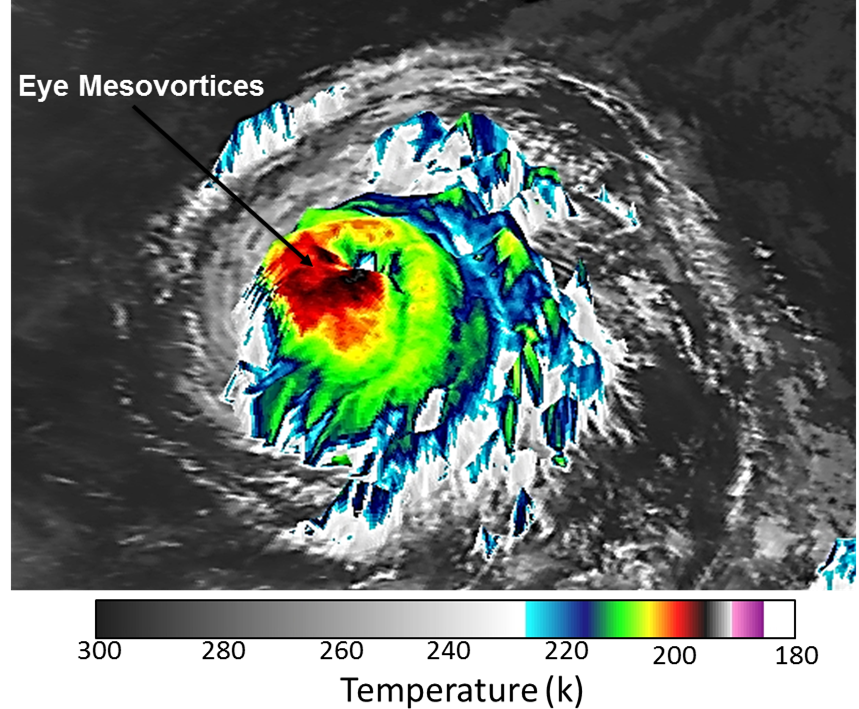
18 August 2009 / 12:00 UTC. 3-D view of TC Bill (2009) observed by Meteosat-9 Enhanced IR imagery.
|
|
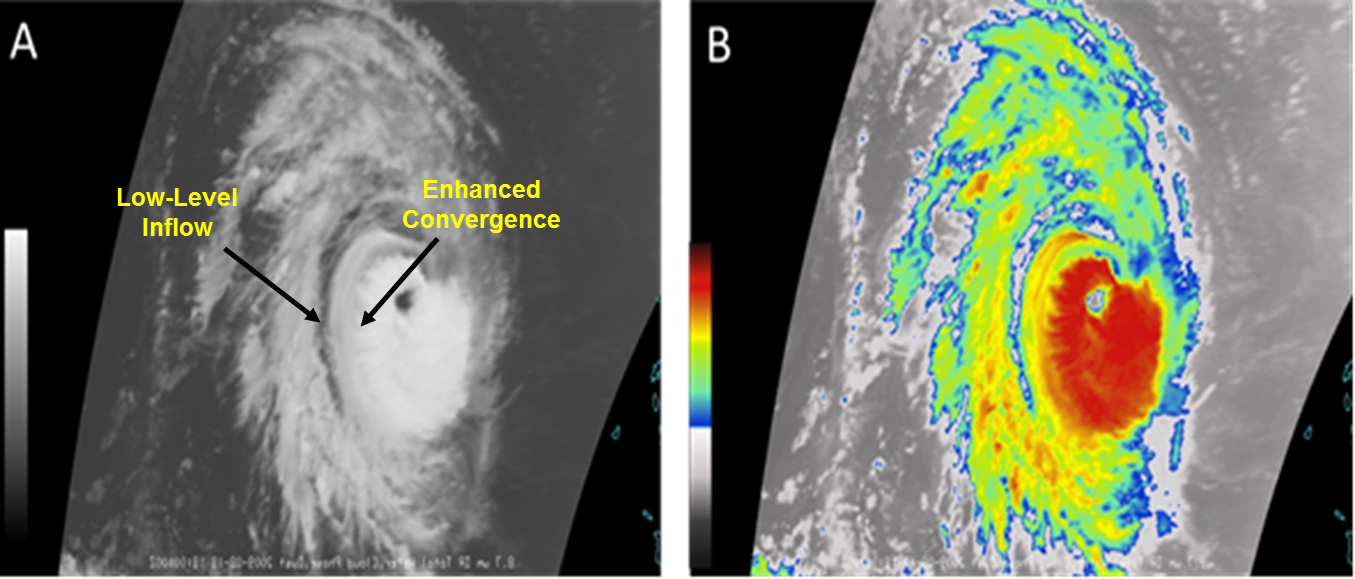
In the eye, the winds drop abruptly to light breezes or even complete calm. The lowest sea-level pressures occur in or near the eye. Eye mesovortices (distinct cyclonic and anti-cyclonic features in the low-level clouds) generate buoyant convection in the eyewall by ejecting the warm, moist air from the low-level eye and producing enhanced convergence at the eyewall cloud base. The most distinctive characteristic of a TC is the horizontal (or tangential) circulation that results from horizontal pressure gradients (primary circulation). These features can usually be seen clearly in the visible, infrared and water vapour images.
|
19 August 2009 / 06UTC. Meteosat-9 IR images of the TC Bill. A) IR imagery and B) Enhanced IR imagery.
|
|
Meteosat-9 Imagery Examples: TC Bill(2009)
As an example, here are the satellite animation of the cyclogenesis and path taken by TC Bill (2009) in the North Atlantic basin. Based on the Meteosat-9 Enhanced infrared (IR) animation of Hurricane Bill in the period from 14 through 18 August 2009, we can see the transformation from stages 1 to 3. The origin of Hurricane Bill can be traced to the eastern tropical North Atlantic and, more precisely to a vigorous tropical wave with an associated broad area of low pressure that emerged from western Africa on 12 August, and then moved westwards, well south of the Cape Verde Islands, a day later. By 14 August, the deep convection associated with the system had consolidated and a few curved rainbands developed, primarily on the south side of the disturbance. By 18 August, it became a Hurricane.

|
Press "Play Button" to see the loop; The Meteosat-9 Enhanced IR animation of TC Bill (2009) over the North Atlantic, showing different stages of development that are associated with changes in the storm intensity and structure. |
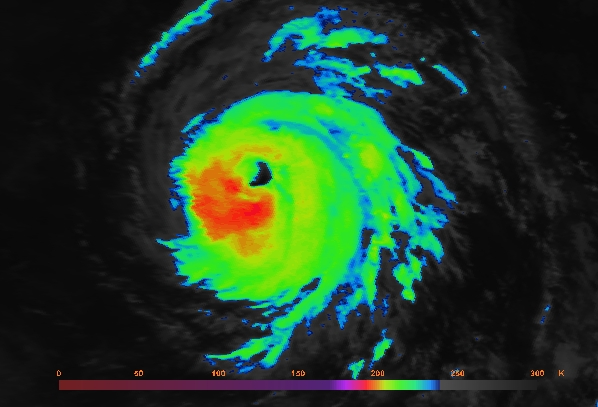
The cloud features of Hurricane Bill which are visible at the beginning of the intensification stage appear to play a distinctive role in determining its final structure. We see a distinct eye, surrounded by very cold convective tops (less than 200 K in red color). During stage#3, the Intertropical Convergence Zone (ITCZ) is very active. As a result of increasing convection under the influences of cyclonic circulation, a diverging convection at upper levels drives asymmetric mesoscale descent (adiabatic warming) in the eye, which lowers the pressure, increasing the pressure gradient and tangential winds.
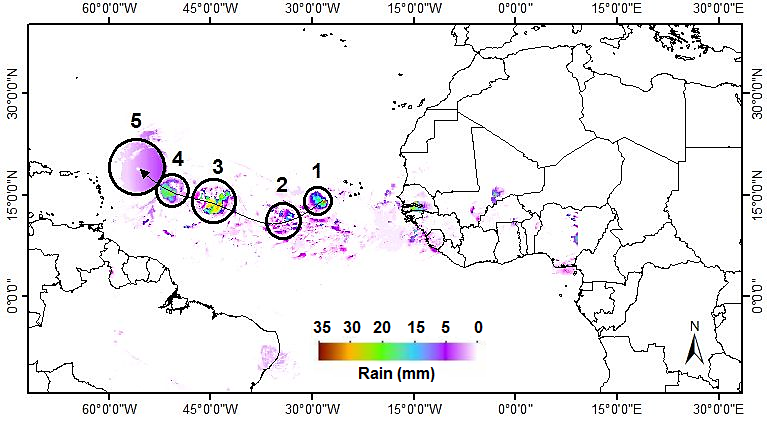
The Meteosat-9 IR animations are supplemented with Multi-sensor Precipitation Estimate (MPE) images of TC Bill from 14 to 18 August 2009 at 12.00 UTC, to confirm that the transformation stages of Bill have begun. The MPE is an instantaneous rain rate product, which is a proxy for rainfall from deep convective clouds. We can see several strong precipitation anomalies (> 30 mm) during this period, of which only some seem to be directly related to the Atmospheric Easterly Waves (AEWs). These became more marked and confined, with intensification of the ITCZ.
The rainband image for a TC is one of the most prominent satellite signatures. TC Bill (2009) provides a good example of this structure. In all five steps, a marked increase of deep clouds and rainbands outside the inner core, during the transformation from a tropical disturbance, suggests that convection is seldom organized into a uniform ring of ascent. The result is an asymmetric appearance of clouds and deep convection (rainfall) compared to the more symmetric structure during the mature stage of TC Bill.
|
Daily evolution of TC Bill for Meteosat MPE product on 1) Aug 14th 2009, 2) Aug 15th 2009, 3) Aug 16th 2009, 4) Aug 17th 2009 and 5) Aug 18th 2009. Open circles mark the day at 12.00 UTC positions.
|
|
Meteorological Physical Background
Tropical troposphere features before the development of a TC
TCs are synoptic-scale, low-pressure systems which develop over the ocean and show a clearly organized surface circulation. They have been widely studied with numerical models in the past, and several theories have been produced to explain them. Although the environmental factors contributing towards their formation vary according to location and season, there are certain principal features which create favorable conditions for large-scale tropical cyclogenesis in the troposphere:
- sufficient oceanic thermal energy [SST > 26°C up to a depth of 60 m]
- enhanced mid-tropospheric (700 hPa) relative humidity
- conditional instability
- cyclonic vorticity
- weak vertical shear of the horizontal winds at the genesis site
- displacement by at least 5° latitude away from the equator
If the above mentioned conditions are maintained, this provides the ideal situation for further intensification of the disturbance to the tropical storm stage. The warm ocean waters of the tropics form the primary source of energy to fuel the tropical cyclone. Evaporation (latent heat flux) and heat transfer (sensible heat flux) from the ocean surface will heat and moisten the boundary layer of the tropical storm. The resulting moist static energy in the air is the source of potential energy which is converted to kinetic energy via convection, allowing the tropical cyclone to intensify.
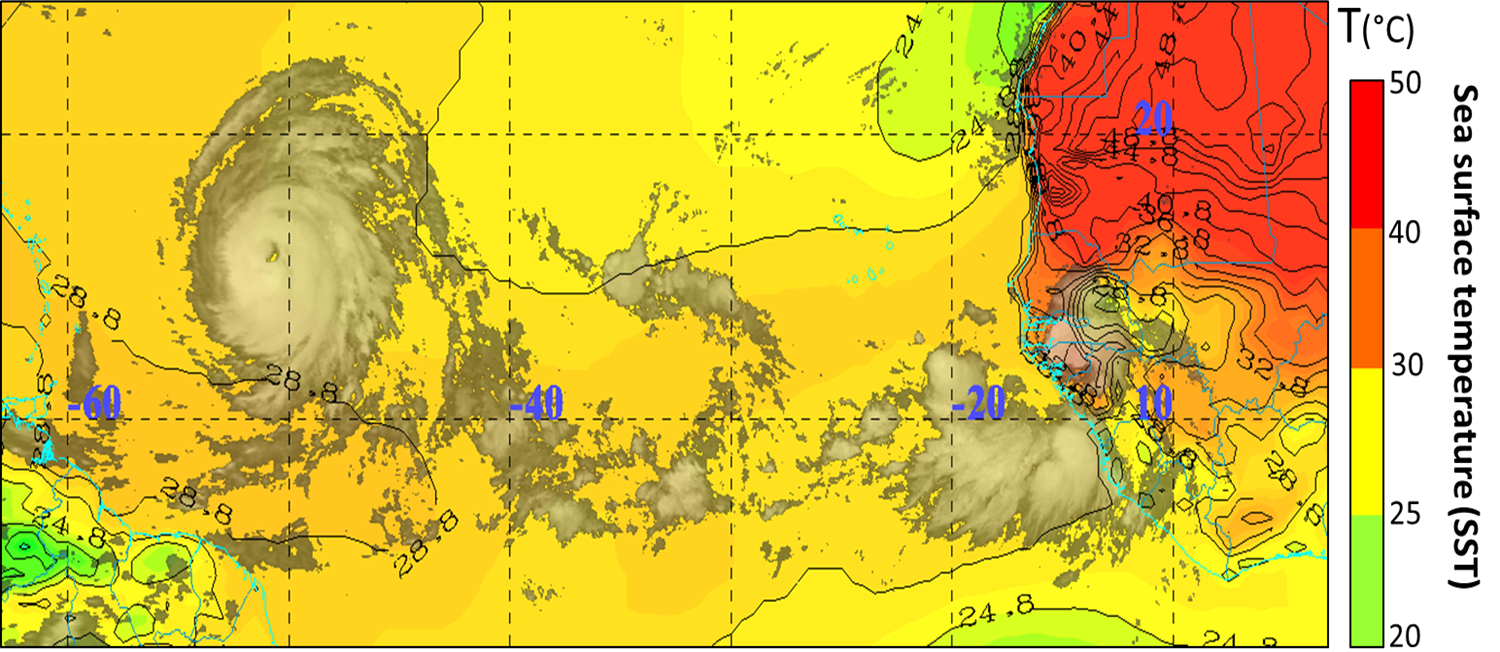
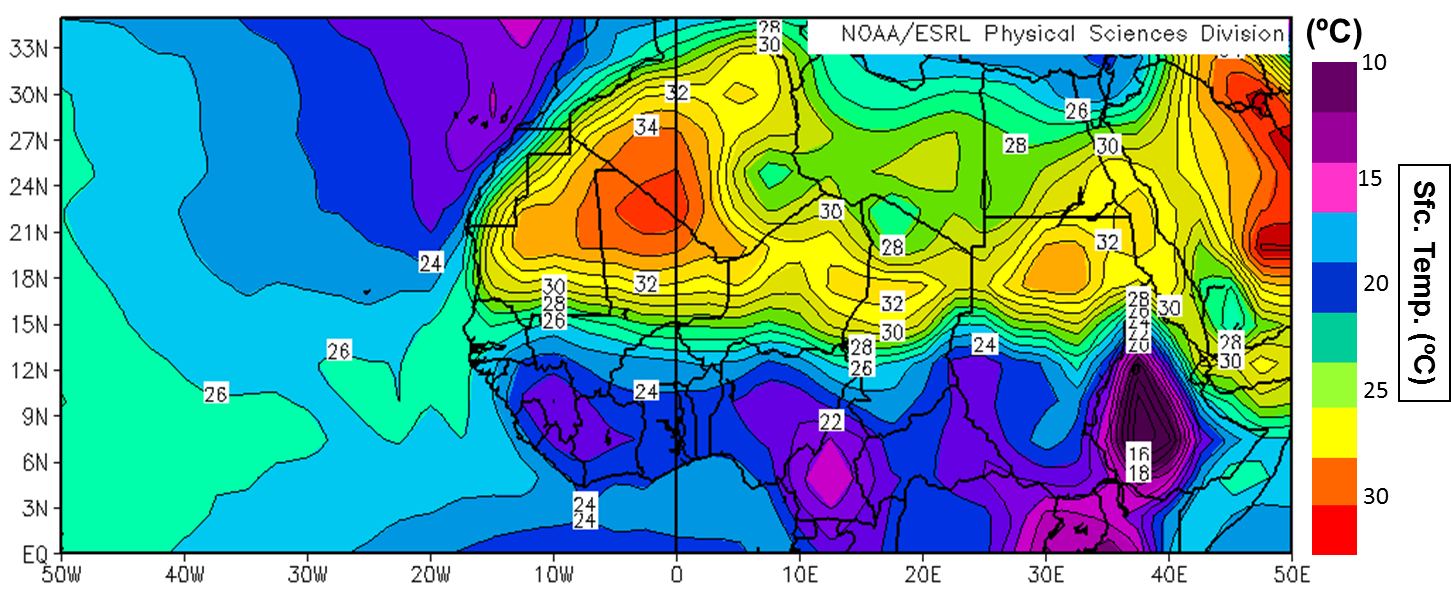
One example of this type of storm occurred on 12 August 2009, over West Africa. Initially, a tropical low formed in an environment with both low vertical shear and anomalously warm SST and then developed to a category 4 (Cat 4) TC, known as Tropical Cyclone Bill, by August 18th. The map below shows the region over the tropical North Atlantic basin where TC Bill formed.
|
Sea surface temperature (SST) map for the tropical North Atlantic basin. The green, yellow, and orange colors show water temperatures warm enough to sustain TC Bill (>28.8°C) on 18 August 2009.
|
|
The Saffir-Simpson TC wind scale is a 1 to 5 rating based on the sustained wind speed of a TC. This scale estimates potential property damage. A TC reaching category 3 or higher is considered a major hazard, due to its potential for significant loss of life and damage.
| Saffir-Simpson TC category | Maximum wind speed (km/h) | Damage |
|---|---|---|
| 1 | 119-153 | Minimal |
| 2 | 154-177 | Moderate |
| 3 | 178-208 | Extensive |
| 4 | 209-251 | Extreme |
| 5 | 252+ | Catastrophic |
Mechanisms for the development of a tropical disturbance into a Tropical Cyclone - broad overview
There are three main mechanisms that explain TC genesis and development: in relation to dynamic instability controls
- CISK mechanism
- WISHE mechanism
- OT mechanism
1. Genesis via the CISK mechanism
CISK, or "Convective Instability of the Second Kind", is a popular theory that explains how tropical depressions can evolve and organize into TCs. CISK is a positive feedback mechanism, meaning that once a process starts, it causes events which enhance the original process, and the whole cycle repeats itself over and over. A schematic explanation of CISK can be seen below.
|
Schematic of a tropical cyclone cross-section, showing the radial and vertical (or transverse) circulation that results from friction, low-level convergence, and buoyancy in the eyewall and rainbands. The main structural elements of TCs are: the boundary layer inflow, clear central eye, eyewall, cirrus shield, rainbands, and upper tropospheric outflow.
|
|
A frictional flow of air at the surface is "deflected" inwards, spiraling towards the center of a low-pressure system, where it creates convergence (red horizontal arrows). Mass continuity then dictates upward motion, forcing the air to rise at the center (blue vertical arrow). This process is known as "Ekman Pumping". The air cools and when saturated, the moisture condenses, releasing latent heat into the air. It is this latent heat which provides the energy to fuel these storms. If conditionally unstable, upward motion will continue and enhance a secondary circulation. The vortex will stretch, which develops and intensifies low-level cyclonic vorticity (through conservation of angular momentum).
2. Genesis via the WISHE mechanism
WISHE or "Wind Induced Surface Heat Exchange", assumes that the tropical atmosphere is not conditionally unstable, but rather near neutral to moist convection (i.e. the thermodynamic profile is moist adiabatic). The primary instability is the thermodynamic difference between the ocean and the boundary layer air (i.e. sensible and latent heat fluxes are crucial).
A prior convective cycle creates Mesoscale Convective Vortices (MCVs). An inflow of air, driven by friction, begins to heat and moisten, developing new convection. The downdrafts disappear, regular convection occurs in near neutral air, a warm core gradually develops and further vortex intensification takes place near the surface.
3. Genesis via the OT mechanism
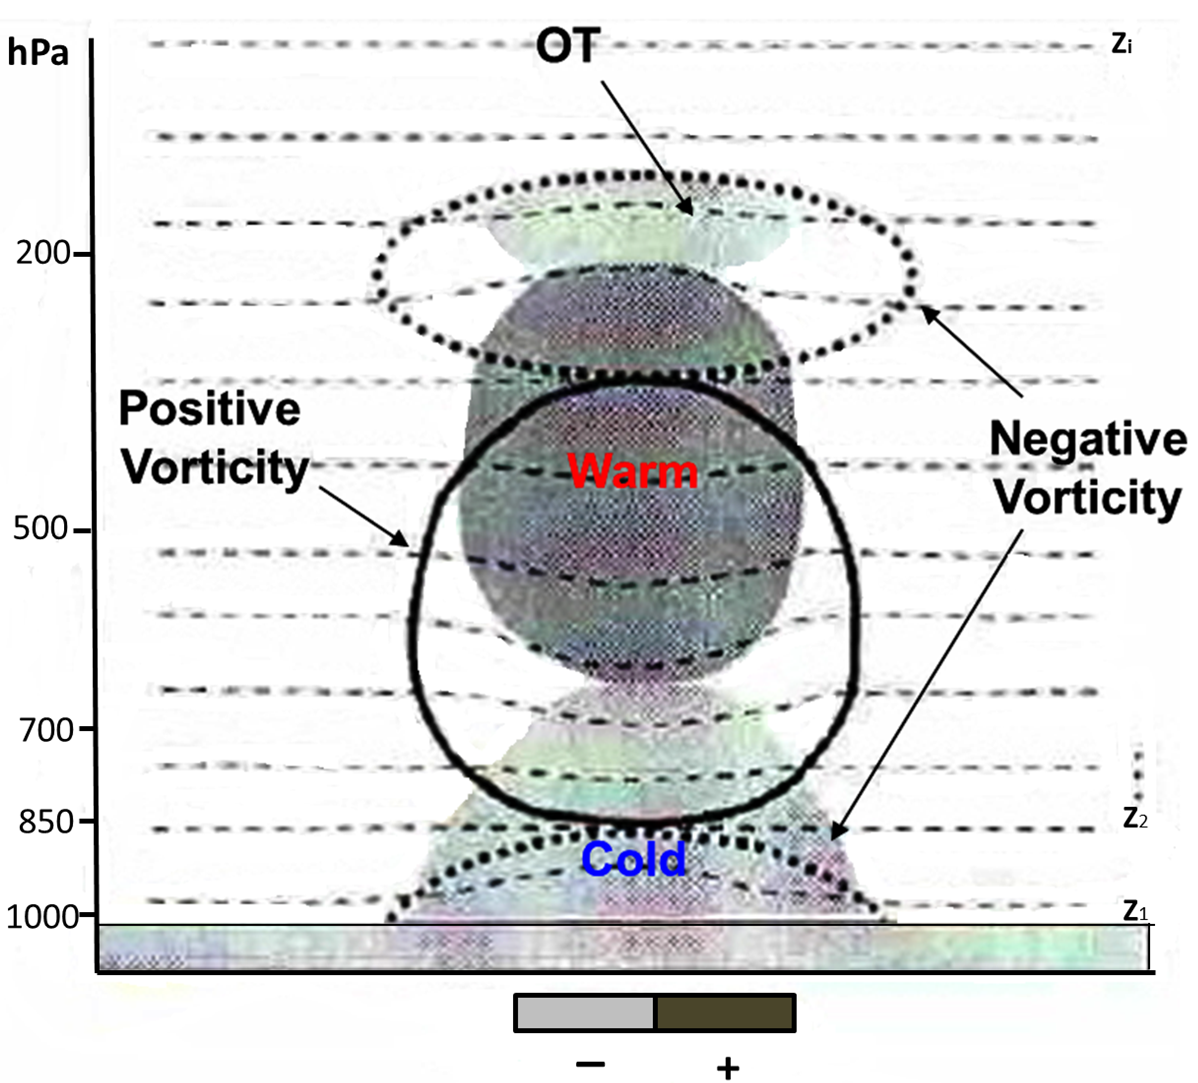
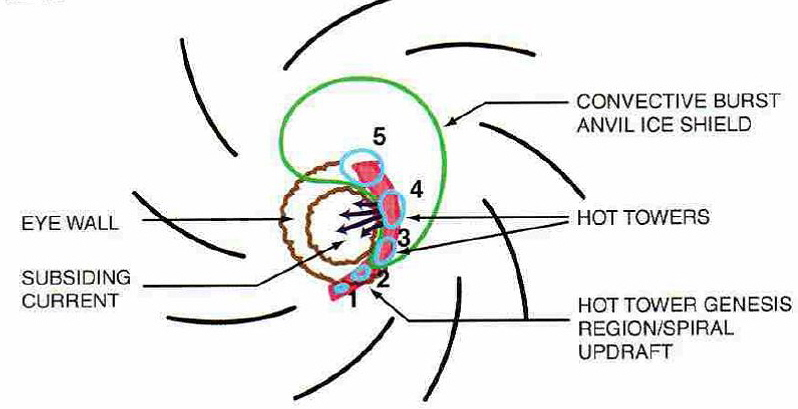
OT or "Overshooting Top", otherwise referred to as “Hot Tower”, assumes that the atmosphere is conditionally nstable. It requires the presence of a finite amplitude disturbance (easterly waves or MCVs) and develops within persistent mesoscale convection from heating aloft (convection) and cooling below (cold downdrafts).
OT (buoyant updrafts) develop and feed off the conditional instability (minimal low-level vorticity). Upward acceleration leads to vortex stretching and low-level convergence (via angular momentum conservation) of background vorticity (considerable low-level vorticity).
|
Schematic of typical MCV cross-section
|
|
Meteorological processes for some stage#3 (TC) features
The following Meteosat-9 images of TC Bill (2009) show the development of overshooting tops (buoyant updrafts) as the storm intensifies; plus eyewall vortices and the formation of an asymmetric eye. Upward acceleration leads to vortex stretching and low-level convergence (from angular momentum conservation) of background vorticity.
|
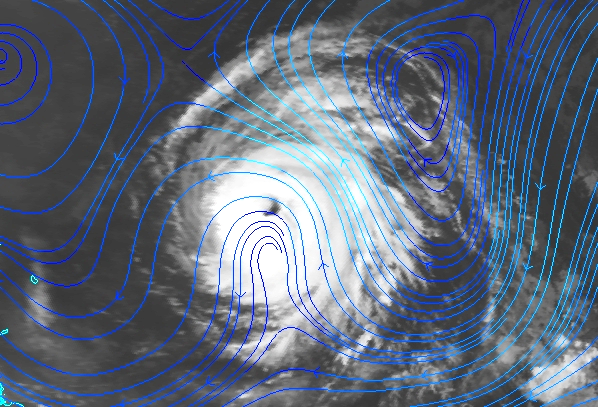
18 August 2009 / 12:00 UTC. Meteosat-9 IR 10.8 µm image superimposed with the GFS of 850 hPa streamlines.
|
|
|
18 August 2009 / 12:00 UTC. Meteosat-9 IR Enhanced IR 10.8 µm image
|
18 August 2009 / 12:00 UTC. Meteosat-9 Convective Storms RGB composite image (WV 6.2 minus WV 7.3, IR 3.9 minus IR 10.8, NIR 1.6 minus VIS 0.6).
|
|
|
An organized cluster of convection (MCVs) immediately surrounds the calm center of the storm. This region is known as the eyewall, and it is on the inner flank of this thunderstorm annulus that we find the strongest winds, as shown in the schematic diagram below.
|
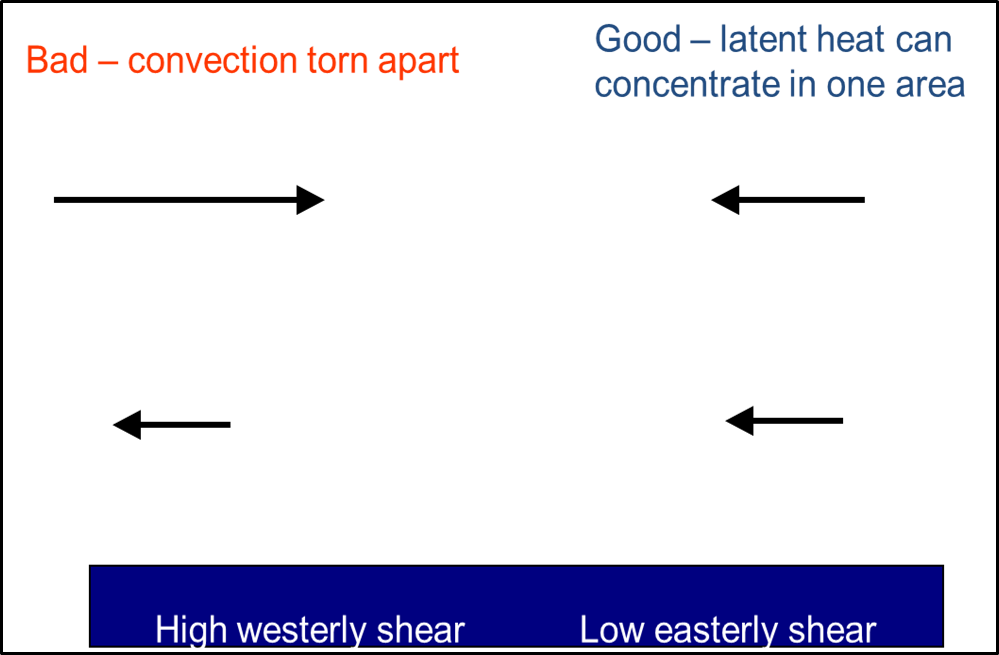
Schematic of effects of wind shear pattern on TC.
|
|
On the satellite images above, we can see how the effect of the convective burst episodes has resulted in a strikingly asymmetric distribution of cloud tops. This implies that "overshooting cloud parcels" which are strongly negatively buoyant can mix with the lower stratospheric environment and eventually subside. Several overshooting tops cooling below -72 °C can be found in our analysis. It is well known that there is a general relationship between the updraft strength and the amount of cloud top overshoot into the tropopause. Under favorable conditions, such as warmer SST and low vertical wind shear (not shown), this concentrates into a depression over the same area.
The eye pattern represents the temperature contrast between the warmest part of the eye and the coldest surrounding convection. The greater this temperature contrast is, the stronger the TC will be. The curved band pattern is based on the idea that the more the rainbands wrap around the area of low pressure, the greater the system vorticity is. This curved band pattern is often easier to follow in Enhanced IR images than in visible images. The shear pattern examines the distance from the low-level center to the MCV, with the principle being that greater involvement of the low-level center with the deep convection indicates a stronger system. The rain region is also larger and is located on the opposite side to the surface strongest winds in respect to the low pressure centre.
The vertical wind shear in a TC's environment is very important. Wind shear is often defined as the vector difference between winds at two altitudes (850 and 200 hPa). As shown in the schematic below, when the wind shear is weak, the storms that are part of the cyclone grow vertically, and the latent heat from condensation is released into the air directly above the storm, supporting its development. When there is stronger wind shear, this means that the storms become more slanted and the latent heat release is dispersed over a much larger area. Thus, strongly sheared TCs (>10-15 m/s over 850-200 hPa) weaken as the upper circulation is blown away from the low-level center.
|
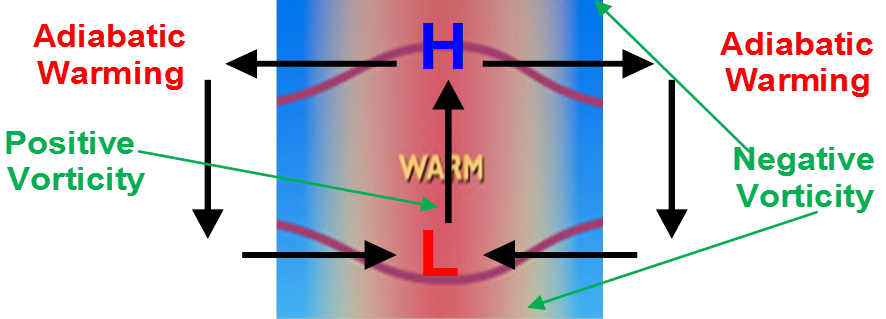
Schematic of overshooting and diverging convection at upper levels showing asymmetric mesoscale descent (adiabatic warming) in the eye, which lowers the pressure, increasing the pressure gradient and tangential winds.
|
|
Typical paths for TC development
There are three commonly identified potential paths to cyclogenesis in the tropical North Atlantic basin:
- Inter-Tropical Convergence Zone (ITCZ). ITCZ is where the Northern Hemisphere and the Southern Hemisphere trade winds converge.
- Eastwardly moving atmospheric waves, known as easterly waves. Easterly waves are similar to waves in the mid-latitudes, except that they are in low-level easterly trades (below 700 hPa). Convergence associated with these waves creates storms that can ultimately reach TC strength.
- This is along old frontal boundaries that drift into the Gulf of Mexico or coastal Florida. The lift associated with these fronts can be enough to initiate storms, and if the atmospheric and oceanic conditions are sufficient, subtropical cyclones could form and develop into tropical cyclones.
Some tropical cyclones, such as Bill (2009), began as African Easterly Waves (AEWs) over the Caribbean. They formed over the African continent during the monsoon season. These waves are often associated with clusters of well-defined convective systems (MCSs) which also propagate westwards above this oceanic region. MCS is a source of potential vorticity for tropical cyclogenesis.
Easterly waves are well-defined wave perturbations with periods of roughly 3-5 days and a spatial scale of about 1000 km. They occur as maximum amplitude waves, close to the level of the African Easterly Jet (AEJ) and low-level maximum amplitude, north of the jet. They move westward at speeds of 7-8 m/s.
|
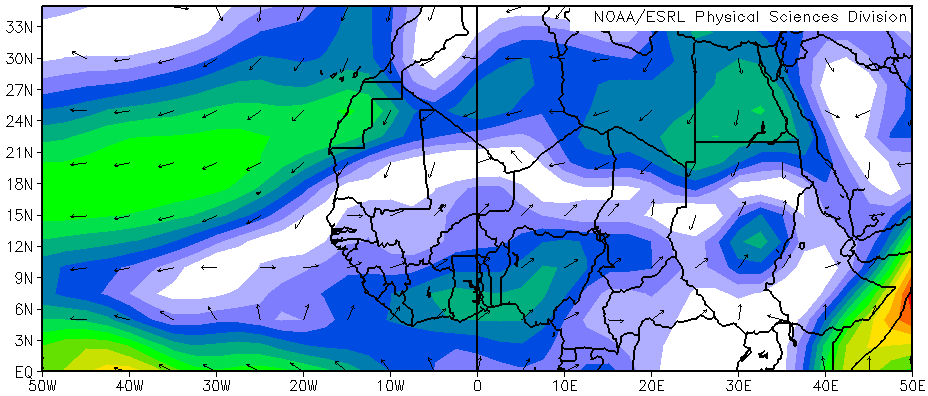
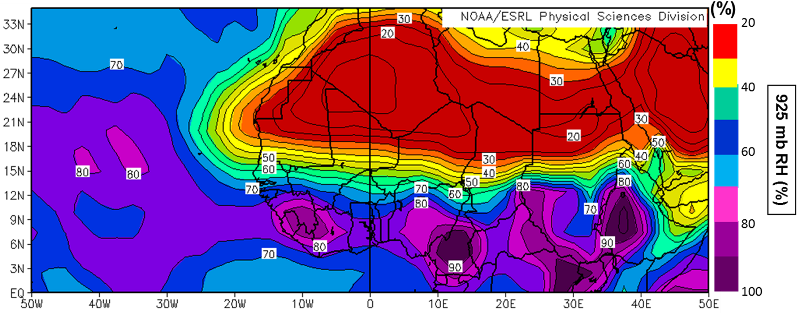
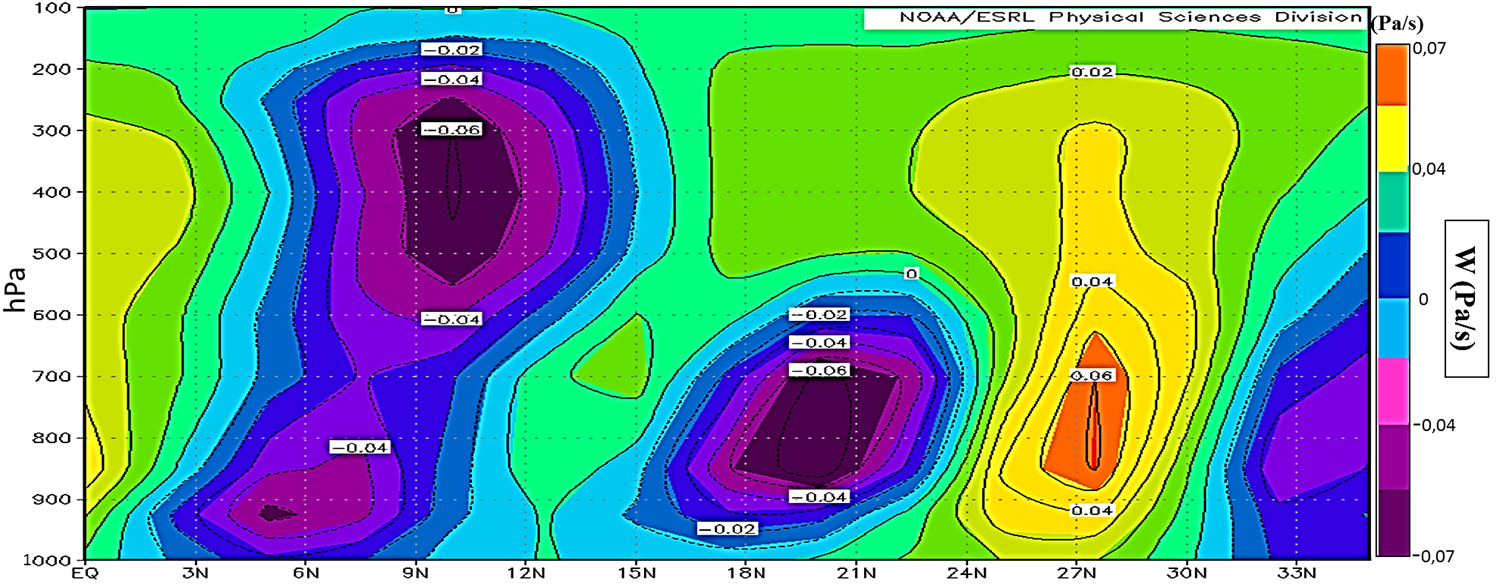
Schematic of an African Easterly Jet (AEJ) over sub-Saharan Africa during the monsoon season. The thermodynamic environment is able to develop instabilities along the AEJ. These often contain mid-level (but not surface) vortices. Cross-section of vertical velocity (omega) at 5°W. Systems "pre-conditioned" for successful TC genesis.
|
|
|
|
|
|
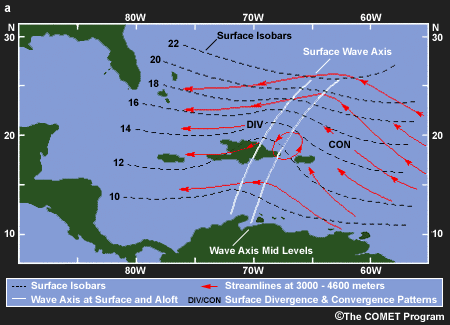
Schematic of an African easterly wave over the Caribbean, illustrating: the "inverted V" structure; surface isobars (dark dash); 700 hPa streamlines (red); regions of surface convergence and divergence; and eastward tilt of the wave with height (white lines with upper trough axis to east).
|
|
Key Parameters
Pressure and Wind Velocity at 850, 500 and 200 hPa:
- TC pressure: areas of relatively low and medium pressure in the troposphere, with the largest pressure perturbations occurring at low altitudes near the surface. The environment near the center of tropical cyclones is warmer than the surrounding area at all altitudes, which is why TCs are characterized as "warm core" systems.
- TC wind velocity: air rotating rapidly around a center of circulation while also flowing radially inwards. Air flows radially inwards at low levels and begins to rotate cyclonically in order to conserve angular momentum.
- TC cyclonic rotation: rapidly rotating air flows radially outwards near the tropopause, its cyclonic rotation decreases and ultimately changes sign when the radius is large enough, resulting in an upper-level anti-cyclone. The result is a vertical structure characterized by a strong cyclone at low levels and a strong anti-cyclone near the tropopause. From the concept of thermal wind balance, we can see that this corresponds to a system that is warmer at its center than in the surrounding environment at all altitudes (i.e. "warm-core").
- Equivalent Potential Temperature - TC potential temperature: the warm core results in lower pressure at the center at all altitudes, with the maximum pressure drop located at the surface. The surface temperature and humidity (the equivalent potential temperature of the surface air) determine the temperatures attained aloft in convection, and therefore the potential temperature at the top of the eyewall.
- TC temperature: Heating produces a local temperature anomaly (like a buoyant updraft) which disturbs the local pressure surfaces. This effect on the local pressure surfaces induces a local secondary circulation. The inner circulation has a more confined radius than the outer.
- Negative vorticity gradient: waves move against the mean wind.
- Positive vorticity gradient: waves move with the mean wind.
|
Schematic of TC local heat sources.
|
|
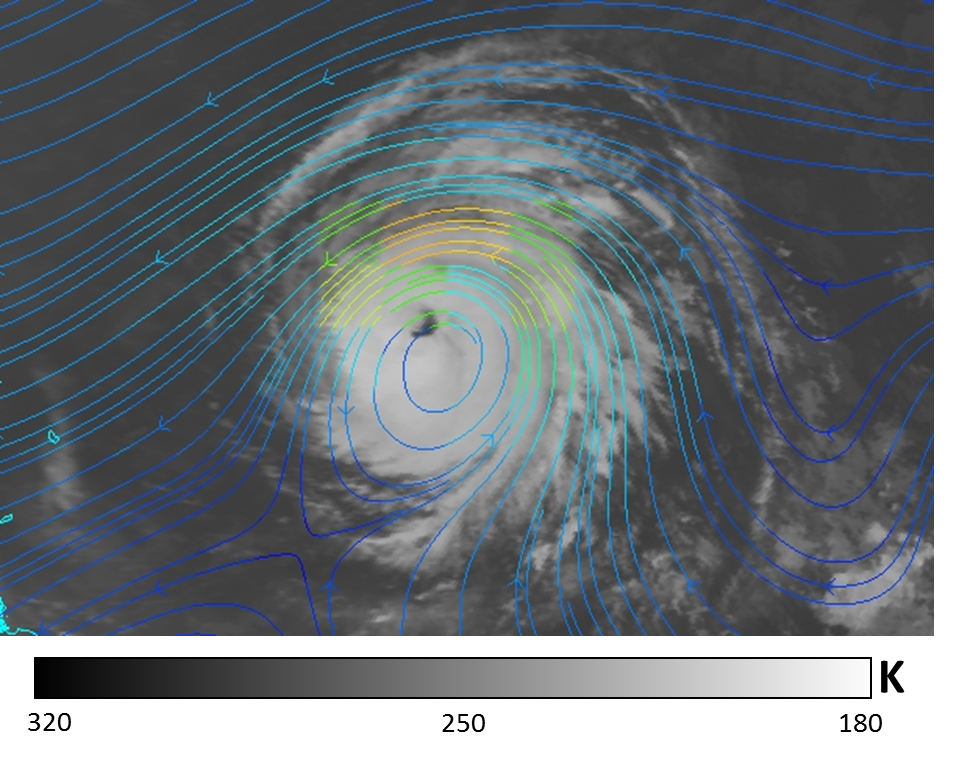
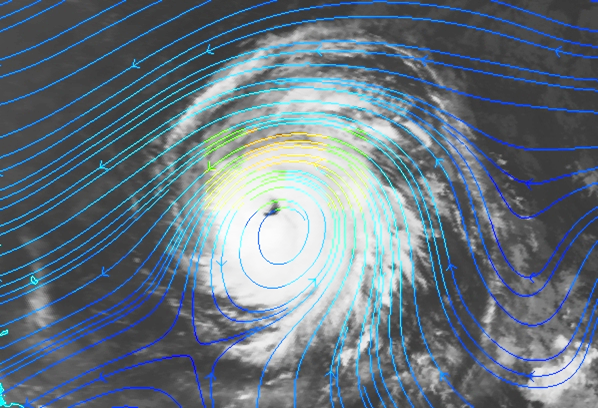
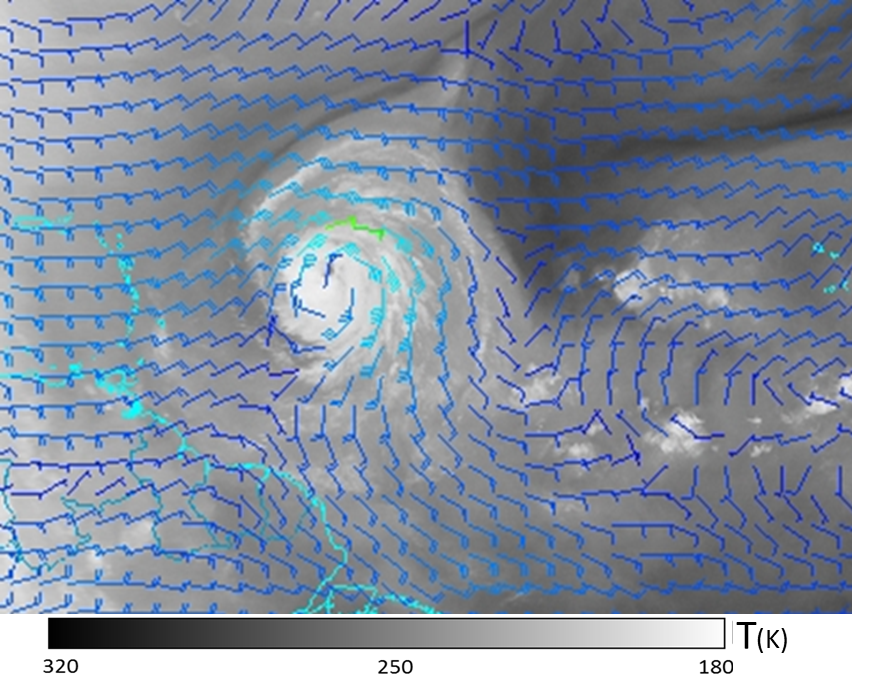
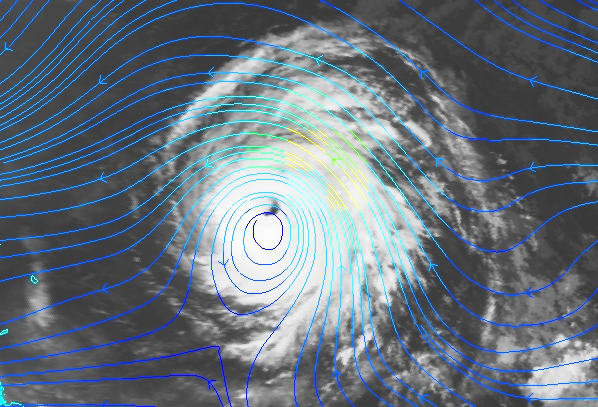
When viewed from the Meteosat-9 WV image of TC Bill (2009) and supplemented with the GFS analysis of 850, 500 and 250 hPa streamlines and winds, the 850 hPA and 500 hPa streamline patterns associated with TC Bill exhibit a closed circulation. Notice how the 250 hPa streamline pattern indicates upper-tropospheric streamline confluence above TC Bill, and an area of convergence. The winds are rushing towards the center of this TC, forcing air upwards at the center. Strong surface winds in a TC boundary layer generate upwelling beneath the storm. This therefore maximizes the moisture transport from the ocean and subsequent latent heat production.
|
18 August 2009 / 12 UTC. Combined Meteosat-9 WV and GFS analysis of 850 hPa streamlines for TC Bill.
|
18 August 2009 / 1200 UTC. Combined Meteosat-9 WV and GFS analysis of 850 hPa winds (speed and direction) of TC Bill (2009).
|
|
|
|
18 August 2009 / 12 UTC. Combined Meteosat-9 WV and GFS analysis of 500 hPa streamlines for TC Bill.
|
18 August 2009 / 1200 UTC.Combined Meteosat-9 WV and GFS analysis of 500 hPa winds (speed and direction) of TC Bill (2009).
|
|
|
|
18 August 2009 / 12 UTC. Combined Meteosat-9 WV and GFS analysis of 250 hPa streamlines of TC Bill.
|
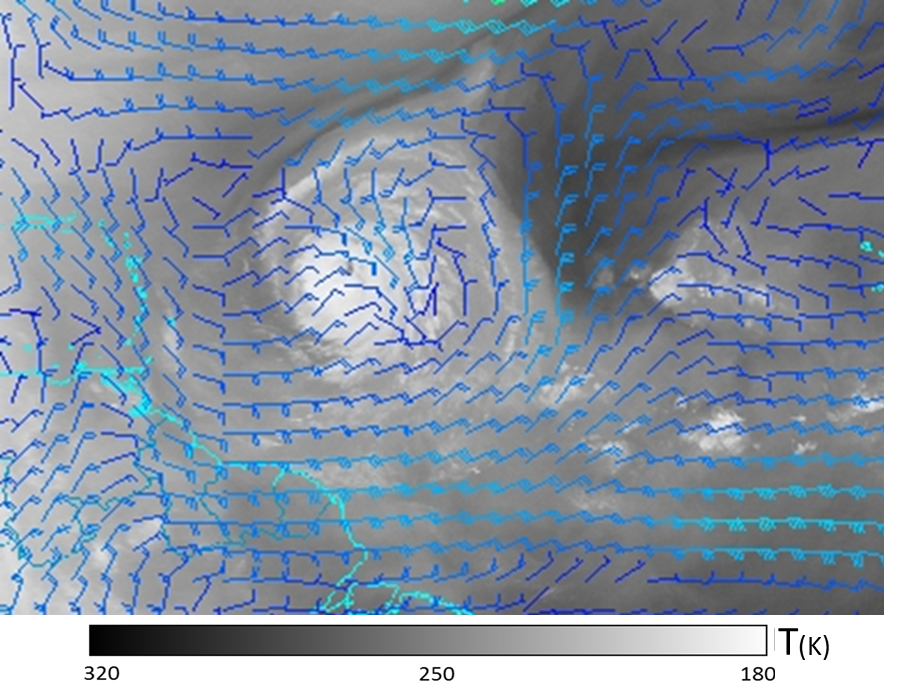
18 August 2009 / 1200 UTC. Combined Meteosat-9 WV and GFS analysis of 250 hPa winds (speed and direction) of TC Bill (2009).
|
|
|
Typical Appearance In Vertical Cross Sections
-
Equivalent Potential Temperature and Relative Humidity:
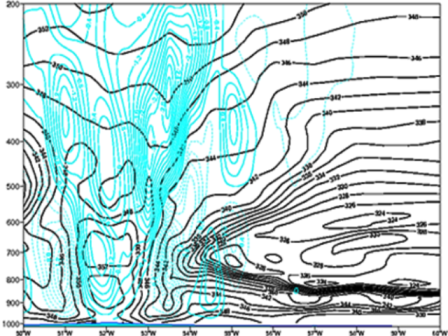
The equivalent potential temperature field shows the maximum temperature in the upper-level part of the eye . Air near the center of circulation (in the eye) is much warmer than that in the wider environment. In addition, a region with high mid-tropospheric relative humidity which supports good convection. It also moistens the atmosphere beyond the eyewall, helping to maintain the eyewall. -
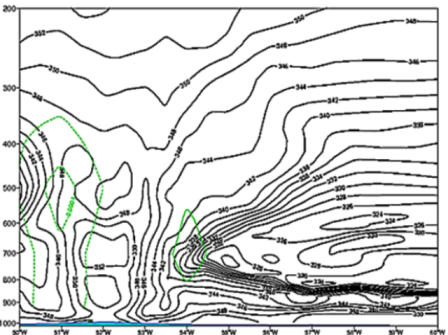
Vertical Velocity (Omega):
The vertical velocity shows varying winds as they move around the eyewall. -
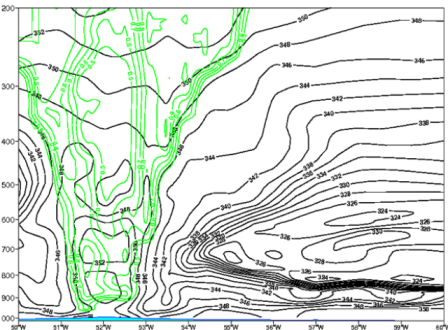
Vorticity Advection:
The vorticity advection shows cyclonic flow throughout most of the troposphere. Dashed lines are cyclonic (or counter-clockwise). Solid lines are anticyclonic (or clockwise). -
Fractional Cloud Cover:
Fractional cold cloud cover shows the warm core from latent heat release
The vertical cross sections shown below were taken along 16°N, between 50°W and 60°W, for TC Bill (2009) on August 18th at 12:00 UTC:
|
18 August 2009 / 12 UTC. Pressure-longitude cross section at 16°N of potential temperature and relative humidity for TC Bill (2009). ECMWF (2-D) reanalysis data.
|
18 August 2009 / 12 UTC. Pressure-longitude cross section at 16°N of potential temperature and vertical velocity for TC Bill (2009). ECMWF (2-D) reanalysis data.
|
|
|
|
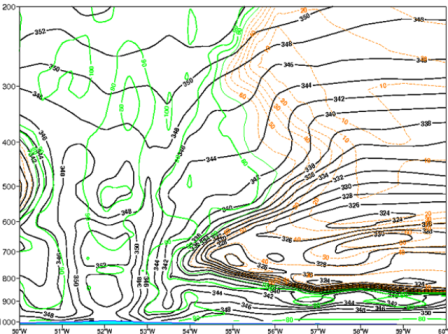
18 August 2009 / 12 UTC. Pressure-longitude cross section at 160N of equivalent potential temperature (K) and vorticity advection (s-1) for TC Bill. ECMWF (2-D) reanalysis data.
|
18 August 2009 / 12UTC. Pressure-longitude cross section at 16°N of equivalent potential temperature (K) and fractional cold cloud cover (0.50-1.0) for TC Bill . ECMWF (2-D) reanalysis data.
|
|
|
Weather events
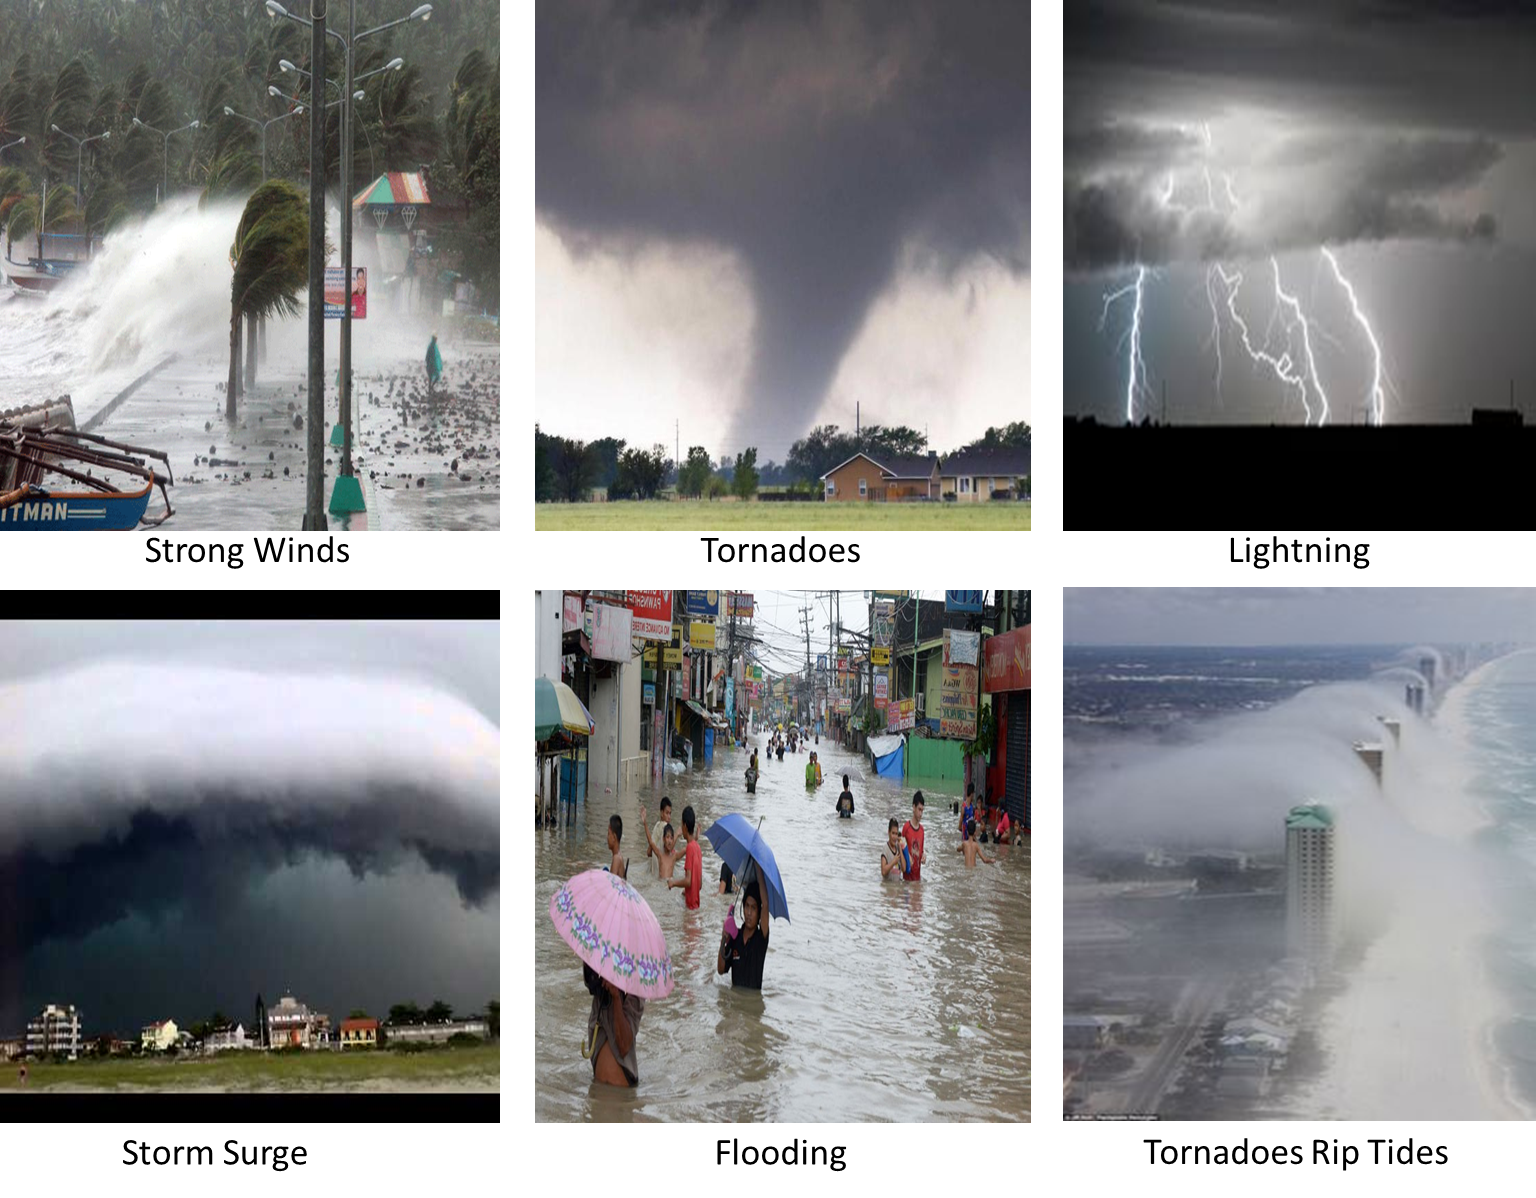
With TCs being as powerful as they are, it is hardly surprising that they cause such destruction to man and nature. Although they always pose a potential hazard, most of the severe damage occurs when they make landfall. The main types of damage are described in the table below:
| Parameter | Description |
|---|---|
| Strong Winds | Strong winds are the most common means of destruction associated with TCs. Their sometimes continuous barrage can uproot trees, knock over buildings and homes, fling potentially deadly debris around, sink or ground boats, and flip over cars. The most severe wind damage occurs when the eyewall of a TC passes over land. In areas of high wind shear, feeder band convergence can result in periods of prolonged and persistent rains, with echo training events producing excessive rainfall amounts. They are often enhanced by topographical effects, with 24 hrs rainfall amounts peaking at 250-500mm and circulation in the cyclone being disrupted. The Saffir-Simpson Scale: Cat 5 TCs are referred to as Catastrophic TCs, with maximum sustained wind speed exceeding 252 km/h. |
| Lightning | When lightning does occur in TCs, it is mostly found in the convective outer rainbands. |
| Storm Surge | A storm surge is a the rising of the sea level due to the low pressure, high winds, and high waves associated with a TC when it makes landfall. Storm surge can cause significant flooding and even loss of life if people are caught unexpected. The eyewall is where the greatest wind speeds are found, air rises most rapidly, clouds reach their highest altitude, and precipitation is the heaviest. The height of a storm surge varies according to the intensity of a TC, typically ranging from 1 meter to more than 5 meters. Coastal towns adjacent to large bays or areas of shallow water are especially susceptible to damage caused by storm surges. This damage can be further intensified if the storm surge coincides with a high astronomical tide. |
| Flooding | Apart from the storm surge, heavy rainfall can cause both flash and long term flooding. Feeder band convergence can result in periods of prolonged and persistent rains, with echo training events producing excessive rainfall amounts. They are often enhanced by topographical effects, with 24- hourly rainfall amounts peaking at 250-500mm and circulation in the cyclone being disrupted. |
| Tornadoes | Tornadoes are also found close to or within the eyewall. |
| Rip Tides | Rip tides form when strong winds from a storm or TC push waves up against the shoreline. The water from these waves collects together and seeks an exit point from which it can flow away again from the shore, thereby forming a strong, narrow current. Rip currents can be caused by a TC which is still hundreds of miles off-shore and warnings of these currents are often the first indication that a TC is approaching. Storm surge and high waves can contribute to water rising as high as 9m. |
|
References
General Meteorology and Basics
- Barbosa, H. A., and Ertürk, A. G., (2009) Using multispectral SEVIRI radiances at the top of deep convective storm as a powerful tool for short prediction in Brazil, paper presented at 5th European Conference on Severe Storms, European Severe Storms Laboratory, Landshut, Germany.
- Barbosa, H., Ertük, A.G., and Silva, L. R. M. Using the meteosat-9 images to the detection of deep Convective systems in Brazil. Journal of Hyperspectral Remote Sensing. 12, 069-082. 2012.
- Barbosa, H.A. Sistema EUMETCast: Uma abordagem aplicada dos Meteosat Segunda Geração. 1ed.Maceió: EDUFAL, 2, 186p.2013.
- Barbosa, H., Silva, L. R. M., Santos, A.M., Neto, C. P. S. A step beyond visualization: how to ingest Meteosat Second Generation satellite data and products into McDAS-V, ILWIS and Terra MA2.Journal of Hyperspectral Remote Sensing. 4, 01-15. 2014.
- Bengtsson, Lennart. 2001. "Hurricane Threats" Science 293 (5529): 440-441. doi:10.1126/science.1062047.
- Cess, R. D. and Udelhofen, P.M. (2003) Climate change during 1985-1999: Cloud interactions determined from satellite measuremnts, Geophysocal Research Letters.,30, 1019.
- Chatfield, R. B., and P. J. Crutzen, (1984) Sulfur dioxide in remote oceanic air: Cloud transport of reactive precursors, J. Geophys. Res., 89, 7111-7132.
- EUMETSAT's new satellite programs, (2014) Services continuity, improvements and innovations. EUM/CS/VWG/14/744207 AMS Annual Meeting Atlanta 2014, 10th Annual Symposium on New Generation of Operational Environmental Satellite Systems.
- Emanuel, Kerry., (2005) Increasing Destructiveness of Tropical Cyclones over the Past 30 years. Nature 436, 7051, 686-688. doi:10.1038/nature03906.
- Gamble, Douglas W., Parnell, Darren B. and Curtis, Scott. 2008. "Spatial variability of the Caribbean mid-summer drought and relation to north Atlantic high circulation" Int. J. Climatol. ,28, 343-350. doi: 10.1002/joc.1600.
- Goldenberg, Stanley B., Landsea, Christopher W.,Mestas-Nuñez, Alberto M. and Gray, William M. (2001) The Recent Increase in Atlantic Hurricane Activity: Causes and Implications. Science 293,5529, 474-479. doi:10.1126/science.1060040.
- IPCC, 2007:Climate Change 2007: The Physical Science Basis. Contribution of Working Group I to the Fourth Assessment Report of the Intergovernmental Panel on Climate Change [Solomon, S., D. Qin, M. Manning, Z. Chen, M. Marquis, K.B. Averyt, M. Tignor and H.L. Miller (eds.)]. Cambridge University Press, Cambridge, United Kingdom and New York, NY, USA, 996 pp.
- Jorgensen, D.P., 1984: Mesoscale and convective-scale characteristics of mature hurricanes. Part I: General Observations by research aircraft. J. Atmos. Sci., 41, 1268-1285.
- Jorgensen, D.P., 1984: Mesoscale and convective-scale characteristics of mature hurricanes. Part II: Inner-core structure of Hurricane Allen (1980). J. Atmos. Sci., 41, 1287-1311.
- Morrison, I., S. Businger, F. Marks, P. Dodge, and J. A. Businger, 2005: An observational case forprevalence of roll vortices in the hurricane boundary layer., J.Atmos. Sci., 62, 2662-2673
- Santer, S. B., et al., (2006) Forced and unforced ocean temperature changes in Atlantic and Pacific tropical cyclogenesis regions. Proc. Natl. Acad. Sci., 103, 13 905–13 910.
- Sohn, B. J., E. A. Smith, F. R. Robertson, and S. C. Park, 2004: Derived over-ocean water vapor transports from satellite-retrieved E-P datasets. J. Climate, 17, 1352-1365.
- WMO. 2011. Climate Knowledge for Action: A Global Framework for Climate Services - Empowering the Most Vulnerable. World Meteorological Organization, WMO-No. 1065.