Meteorological Physical Background
Tropical troposphere features before the development of a TC
TCs are synoptic-scale, low-pressure systems which develop over the ocean and show a clearly organized surface circulation. They have been widely studied with numerical models in the past, and several theories have been produced to explain them. Although the environmental factors contributing towards their formation vary according to location and season, there are certain principal features which create favorable conditions for large-scale tropical cyclogenesis in the troposphere:
- sufficient oceanic thermal energy [SST > 26°C up to a depth of 60 m]
- enhanced mid-tropospheric (700 hPa) relative humidity
- conditional instability
- cyclonic vorticity
- weak vertical shear of the horizontal winds at the genesis site
- displacement by at least 5° latitude away from the equator
If the above mentioned conditions are maintained, this provides the ideal situation for further intensification of the disturbance to the tropical storm stage. The warm ocean waters of the tropics form the primary source of energy to fuel the tropical cyclone. Evaporation (latent heat flux) and heat transfer (sensible heat flux) from the ocean surface will heat and moisten the boundary layer of the tropical storm. The resulting moist static energy in the air is the source of potential energy which is converted to kinetic energy via convection, allowing the tropical cyclone to intensify.
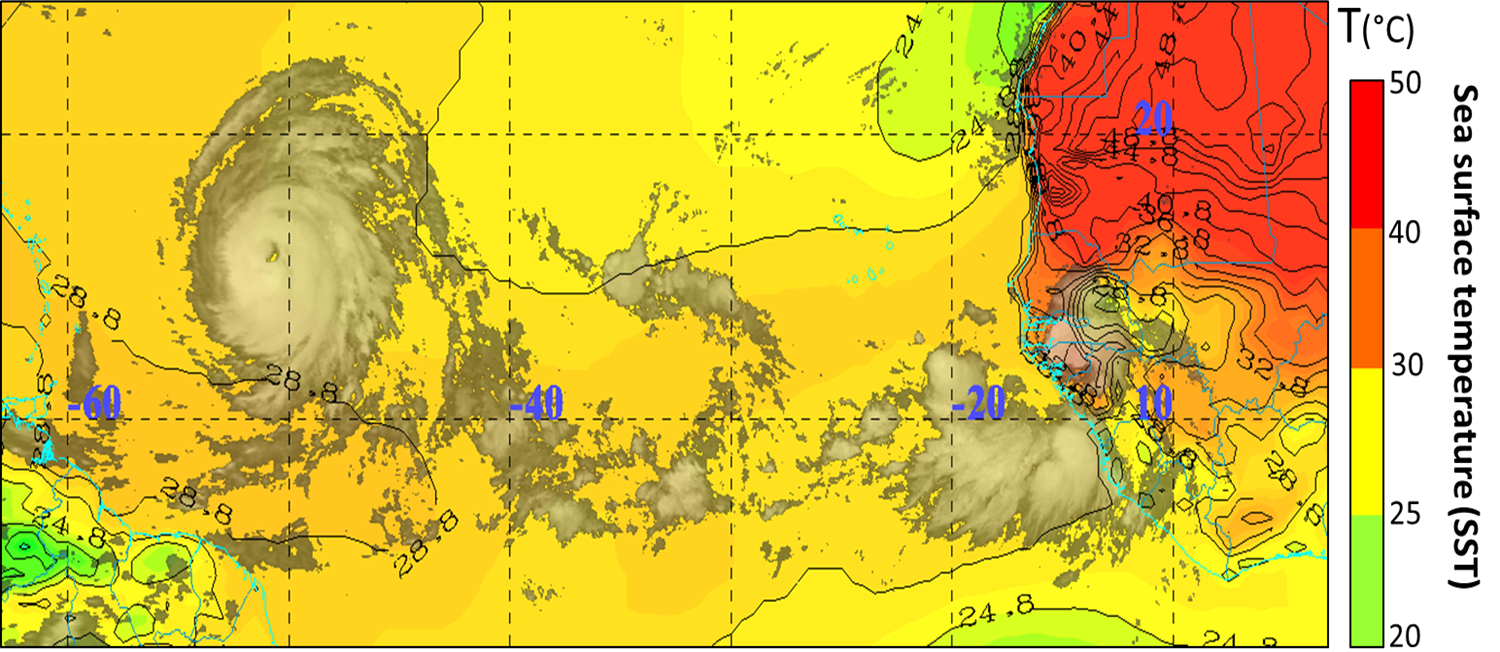
One example of this type of storm occurred on 12 August 2009, over West Africa. Initially, a tropical low formed in an environment with both low vertical shear and anomalously warm SST and then developed to a category 4 (Cat 4) TC, known as Tropical Cyclone Bill, by August 18th. The map below shows the region over the tropical North Atlantic basin where TC Bill formed.
|
Sea surface temperature (SST) map for the tropical North Atlantic basin. The green, yellow, and orange colors show water temperatures warm enough to sustain TC Bill (>28.8°C) on 18 August 2009.
|
|
The Saffir-Simpson TC wind scale is a 1 to 5 rating based on the sustained wind speed of a TC. This scale estimates potential property damage. A TC reaching category 3 or higher is considered a major hazard, due to its potential for significant loss of life and damage.
| Saffir-Simpson TC category | Maximum wind speed (km/h) | Damage |
|---|---|---|
| 1 | 119-153 | Minimal |
| 2 | 154-177 | Moderate |
| 3 | 178-208 | Extensive |
| 4 | 209-251 | Extreme |
| 5 | 252+ | Catastrophic |
Mechanisms for the development of a tropical disturbance into a Tropical Cyclone - broad overview
There are three main mechanisms that explain TC genesis and development: in relation to dynamic instability controls
- CISK mechanism
- WISHE mechanism
- OT mechanism
1. Genesis via the CISK mechanism
CISK, or "Convective Instability of the Second Kind", is a popular theory that explains how tropical depressions can evolve and organize into TCs. CISK is a positive feedback mechanism, meaning that once a process starts, it causes events which enhance the original process, and the whole cycle repeats itself over and over. A schematic explanation of CISK can be seen below.
|
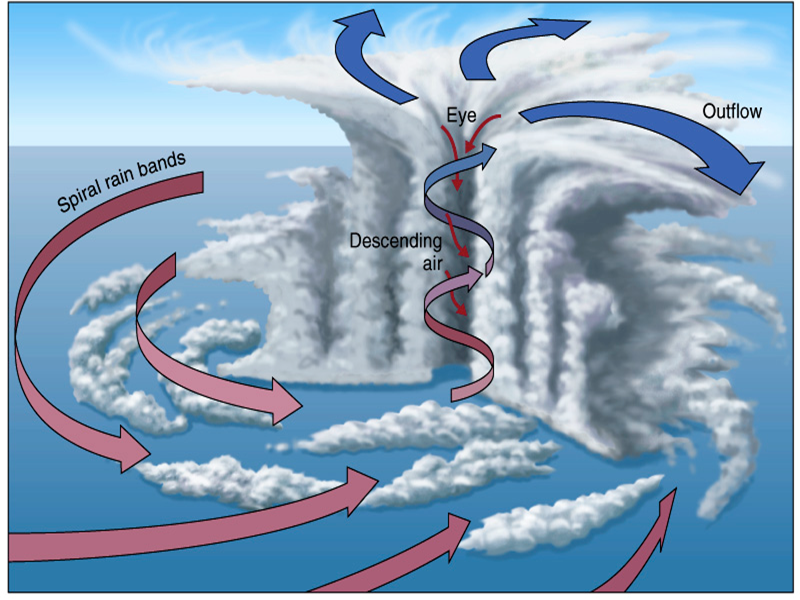
Schematic of a tropical cyclone cross-section, showing the radial and vertical (or transverse) circulation that results from friction, low-level convergence, and buoyancy in the eyewall and rainbands. The main structural elements of TCs are: the boundary layer inflow, clear central eye, eyewall, cirrus shield, rainbands, and upper tropospheric outflow.
|
|
A frictional flow of air at the surface is "deflected" inwards, spiraling towards the center of a low-pressure system, where it creates convergence (red horizontal arrows). Mass continuity then dictates upward motion, forcing the air to rise at the center (blue vertical arrow). This process is known as "Ekman Pumping". The air cools and when saturated, the moisture condenses, releasing latent heat into the air. It is this latent heat which provides the energy to fuel these storms. If conditionally unstable, upward motion will continue and enhance a secondary circulation. The vortex will stretch, which develops and intensifies low-level cyclonic vorticity (through conservation of angular momentum).
2. Genesis via the WISHE mechanism
WISHE or "Wind Induced Surface Heat Exchange", assumes that the tropical atmosphere is not conditionally unstable, but rather near neutral to moist convection (i.e. the thermodynamic profile is moist adiabatic). The primary instability is the thermodynamic difference between the ocean and the boundary layer air (i.e. sensible and latent heat fluxes are crucial).
A prior convective cycle creates Mesoscale Convective Vortices (MCVs). An inflow of air, driven by friction, begins to heat and moisten, developing new convection. The downdrafts disappear, regular convection occurs in near neutral air, a warm core gradually develops and further vortex intensification takes place near the surface.
3. Genesis via the OT mechanism
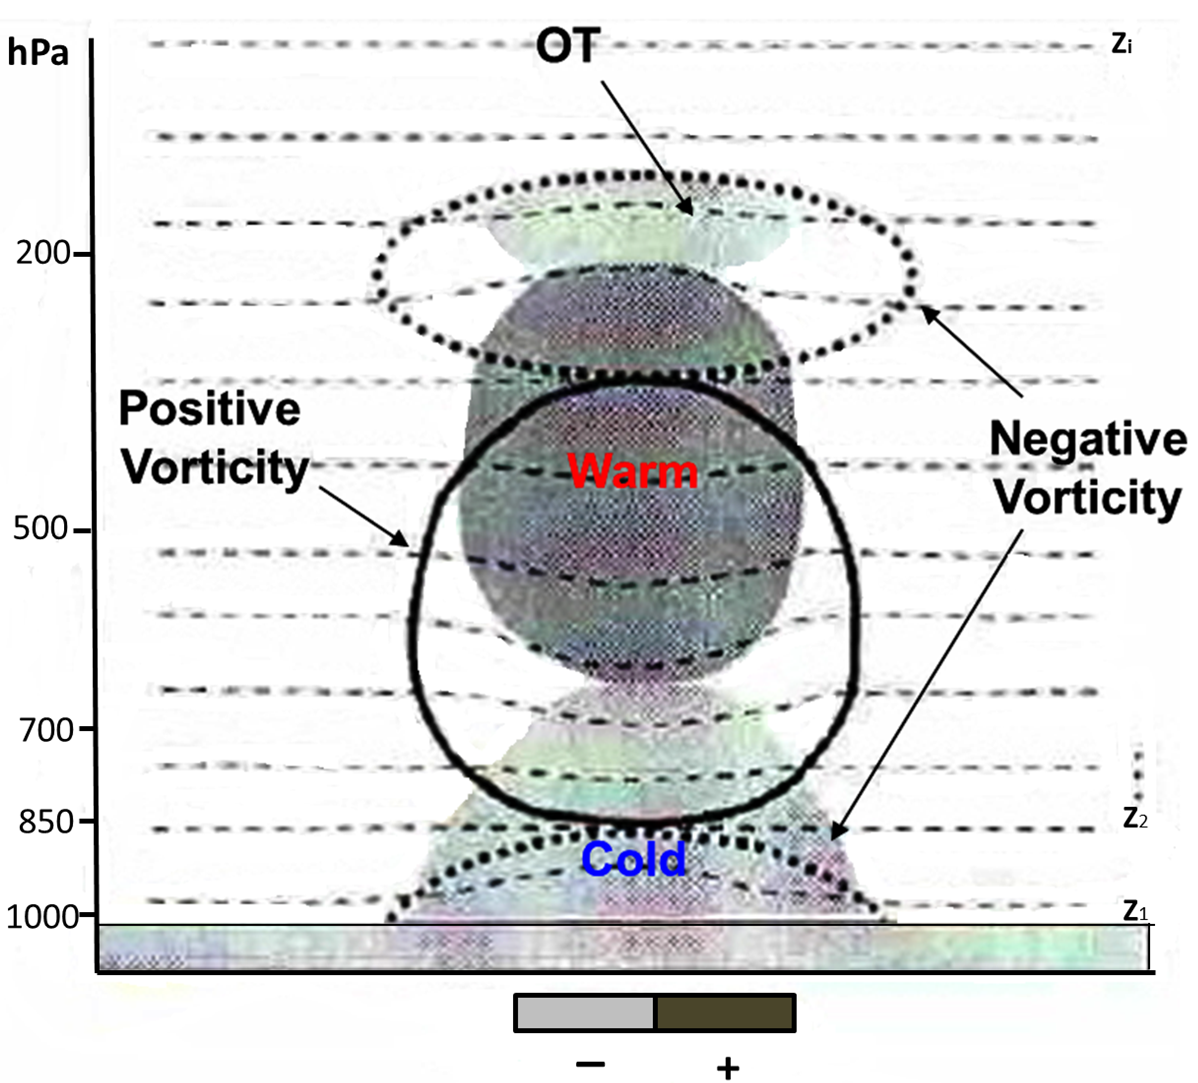
OT or "Overshooting Top", otherwise referred to as “Hot Tower”, assumes that the atmosphere is conditionally nstable. It requires the presence of a finite amplitude disturbance (easterly waves or MCVs) and develops within persistent mesoscale convection from heating aloft (convection) and cooling below (cold downdrafts).
OT (buoyant updrafts) develop and feed off the conditional instability (minimal low-level vorticity). Upward acceleration leads to vortex stretching and low-level convergence (via angular momentum conservation) of background vorticity (considerable low-level vorticity).
|
Schematic of typical MCV cross-section
|
|
Meteorological processes for some stage#3 (TC) features
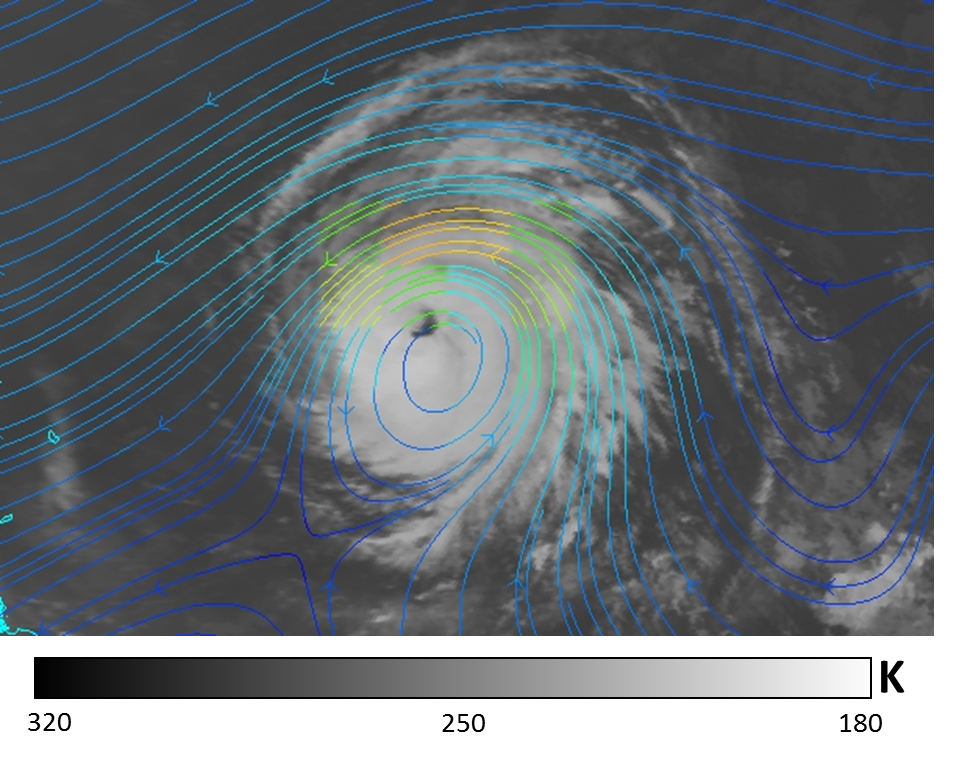
The following Meteosat-9 images of TC Bill (2009) show the development of overshooting tops (buoyant updrafts) as the storm intensifies; plus eyewall vortices and the formation of an asymmetric eye. Upward acceleration leads to vortex stretching and low-level convergence (from angular momentum conservation) of background vorticity.
|
18 August 2009 / 12:00 UTC. Meteosat-9 IR 10.8 µm image superimposed with the GFS of 850 hPa streamlines.
|
|
|
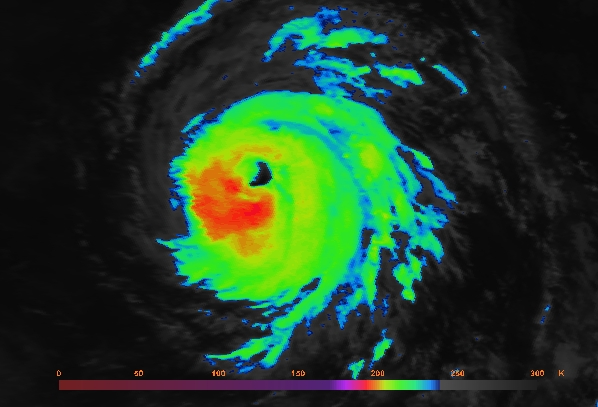
18 August 2009 / 12:00 UTC. Meteosat-9 IR Enhanced IR 10.8 µm image
|
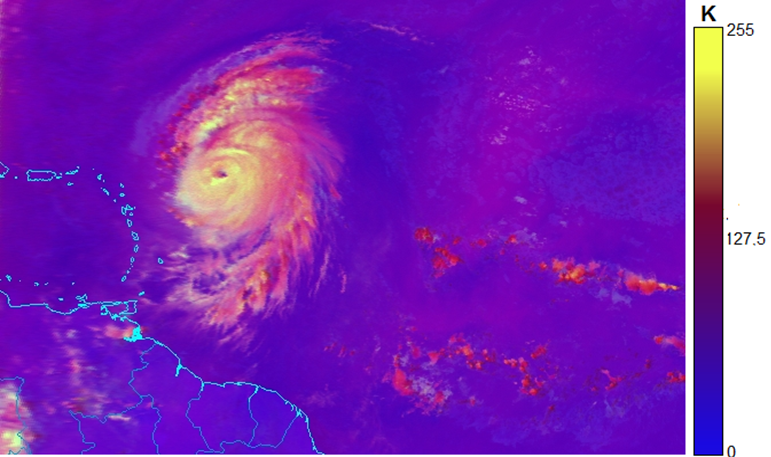
18 August 2009 / 12:00 UTC. Meteosat-9 Convective Storms RGB composite image (WV 6.2 minus WV 7.3, IR 3.9 minus IR 10.8, NIR 1.6 minus VIS 0.6).
|
|
|
An organized cluster of convection (MCVs) immediately surrounds the calm center of the storm. This region is known as the eyewall, and it is on the inner flank of this thunderstorm annulus that we find the strongest winds, as shown in the schematic diagram below.
|
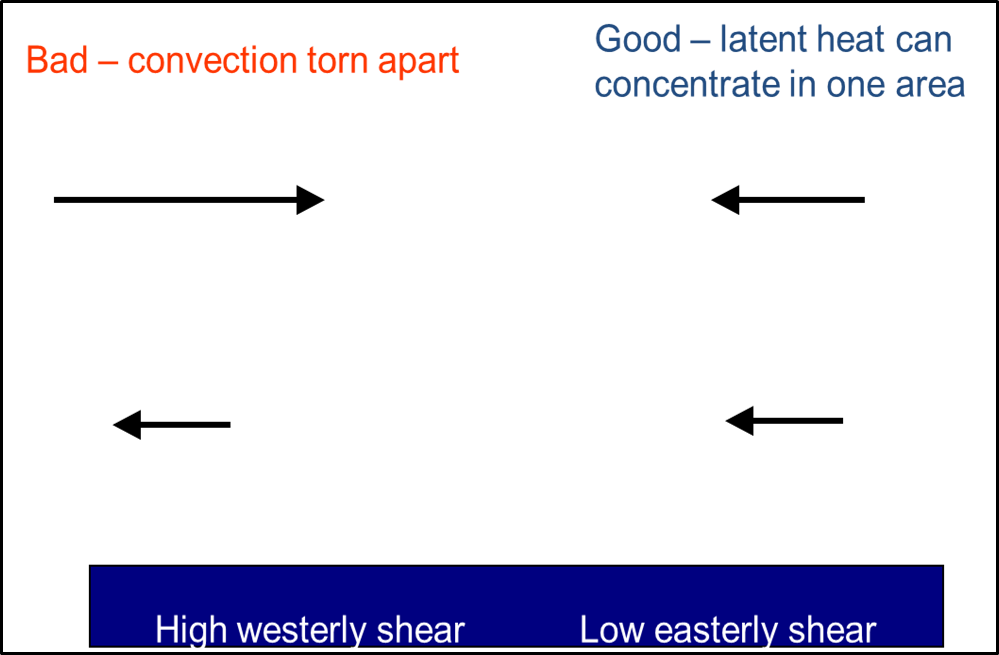
Schematic of effects of wind shear pattern on TC.
|
|
On the satellite images above, we can see how the effect of the convective burst episodes has resulted in a strikingly asymmetric distribution of cloud tops. This implies that "overshooting cloud parcels" which are strongly negatively buoyant can mix with the lower stratospheric environment and eventually subside. Several overshooting tops cooling below -72 °C can be found in our analysis. It is well known that there is a general relationship between the updraft strength and the amount of cloud top overshoot into the tropopause. Under favorable conditions, such as warmer SST and low vertical wind shear (not shown), this concentrates into a depression over the same area.
The eye pattern represents the temperature contrast between the warmest part of the eye and the coldest surrounding convection. The greater this temperature contrast is, the stronger the TC will be. The curved band pattern is based on the idea that the more the rainbands wrap around the area of low pressure, the greater the system vorticity is. This curved band pattern is often easier to follow in Enhanced IR images than in visible images. The shear pattern examines the distance from the low-level center to the MCV, with the principle being that greater involvement of the low-level center with the deep convection indicates a stronger system. The rain region is also larger and is located on the opposite side to the surface strongest winds in respect to the low pressure centre.
The vertical wind shear in a TC's environment is very important. Wind shear is often defined as the vector difference between winds at two altitudes (850 and 200 hPa). As shown in the schematic below, when the wind shear is weak, the storms that are part of the cyclone grow vertically, and the latent heat from condensation is released into the air directly above the storm, supporting its development. When there is stronger wind shear, this means that the storms become more slanted and the latent heat release is dispersed over a much larger area. Thus, strongly sheared TCs (>10-15 m/s over 850-200 hPa) weaken as the upper circulation is blown away from the low-level center.
|
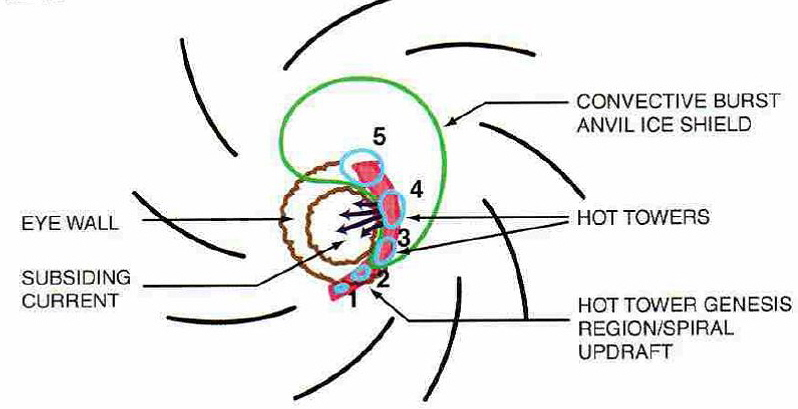
Schematic of overshooting and diverging convection at upper levels showing asymmetric mesoscale descent (adiabatic warming) in the eye, which lowers the pressure, increasing the pressure gradient and tangential winds.
|
|
Typical paths for TC development
There are three commonly identified potential paths to cyclogenesis in the tropical North Atlantic basin:
- Inter-Tropical Convergence Zone (ITCZ). ITCZ is where the Northern Hemisphere and the Southern Hemisphere trade winds converge.
- Eastwardly moving atmospheric waves, known as easterly waves. Easterly waves are similar to waves in the mid-latitudes, except that they are in low-level easterly trades (below 700 hPa). Convergence associated with these waves creates storms that can ultimately reach TC strength.
- This is along old frontal boundaries that drift into the Gulf of Mexico or coastal Florida. The lift associated with these fronts can be enough to initiate storms, and if the atmospheric and oceanic conditions are sufficient, subtropical cyclones could form and develop into tropical cyclones.
Some tropical cyclones, such as Bill (2009), began as African Easterly Waves (AEWs) over the Caribbean. They formed over the African continent during the monsoon season. These waves are often associated with clusters of well-defined convective systems (MCSs) which also propagate westwards above this oceanic region. MCS is a source of potential vorticity for tropical cyclogenesis.
Easterly waves are well-defined wave perturbations with periods of roughly 3-5 days and a spatial scale of about 1000 km. They occur as maximum amplitude waves, close to the level of the African Easterly Jet (AEJ) and low-level maximum amplitude, north of the jet. They move westward at speeds of 7-8 m/s.
|
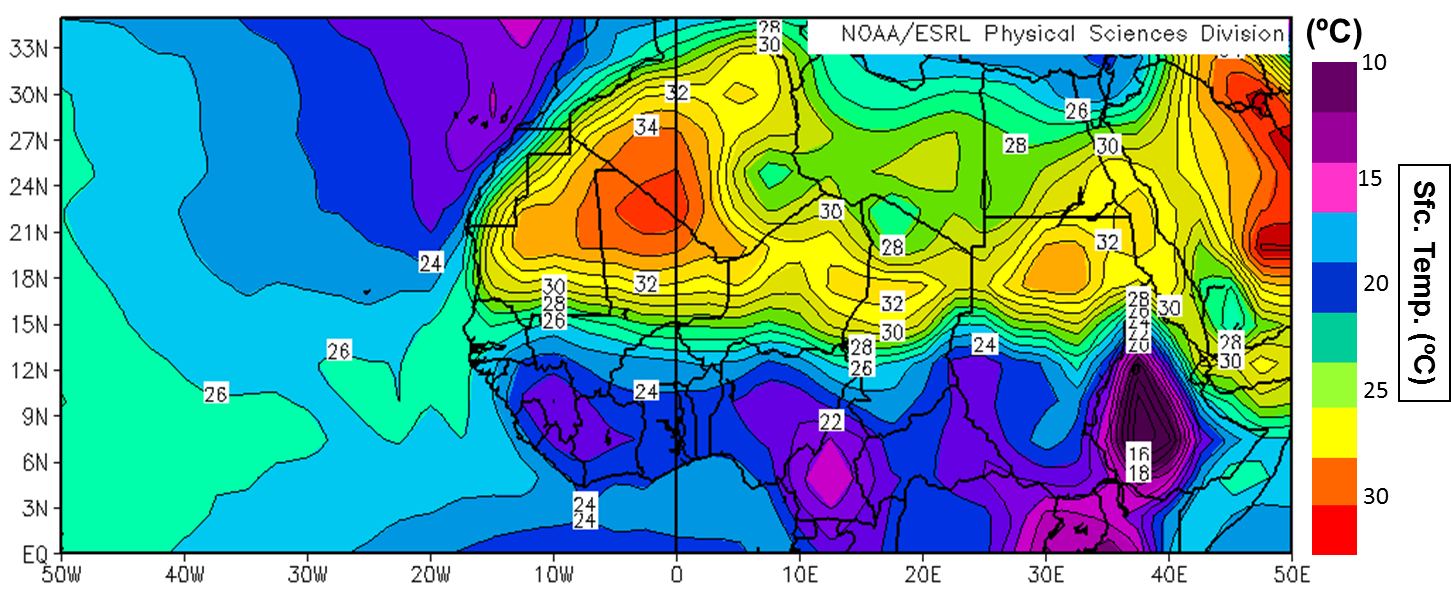
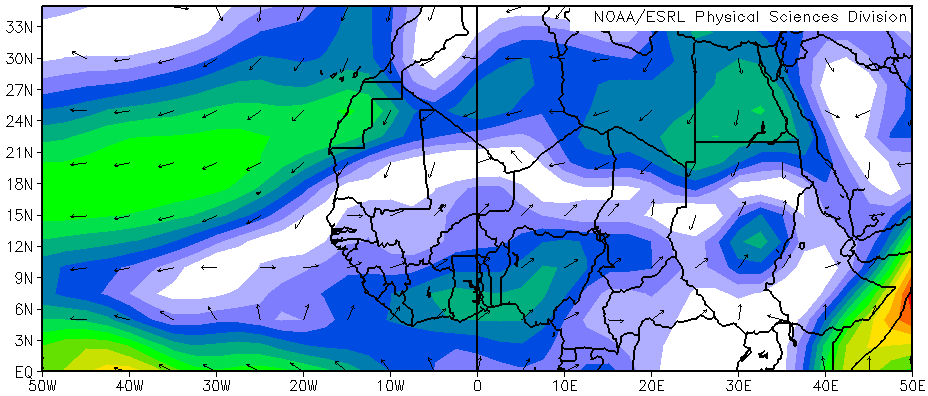
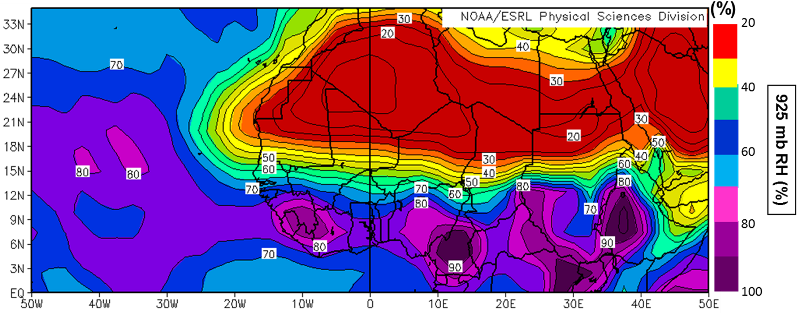
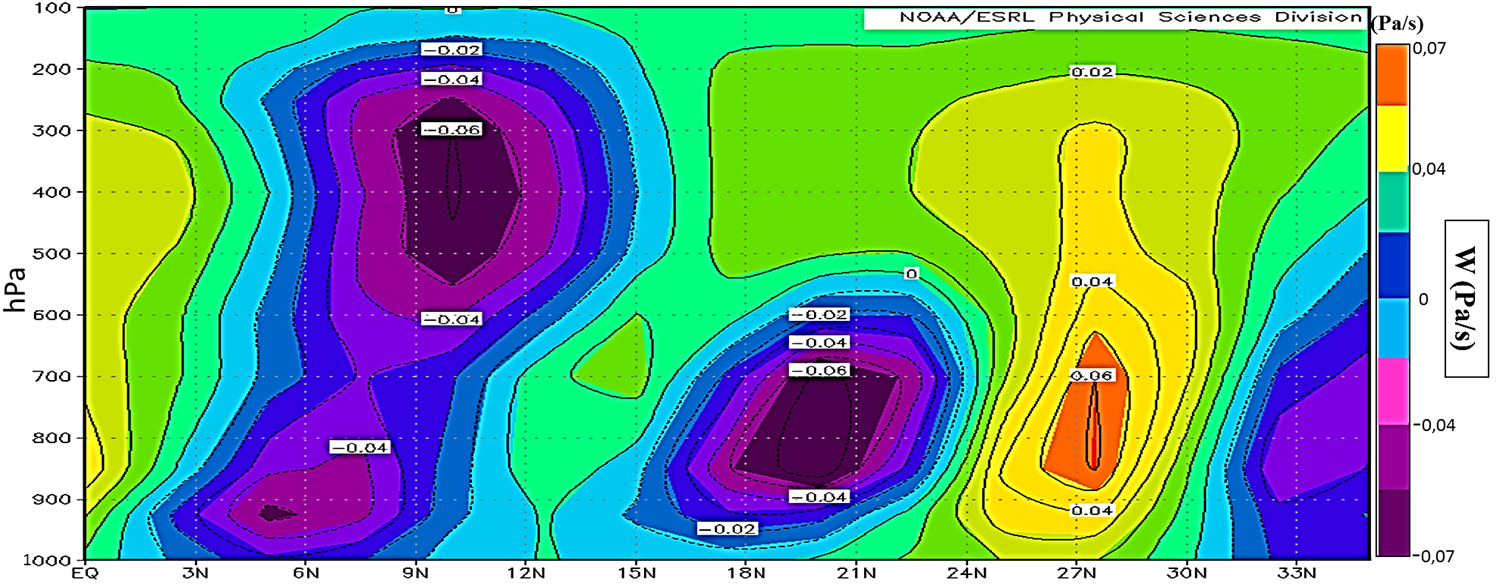
Schematic of an African Easterly Jet (AEJ) over sub-Saharan Africa during the monsoon season. The thermodynamic environment is able to develop instabilities along the AEJ. These often contain mid-level (but not surface) vortices. Cross-section of vertical velocity (omega) at 5°W. Systems "pre-conditioned" for successful TC genesis.
|
|
|
|
|
|
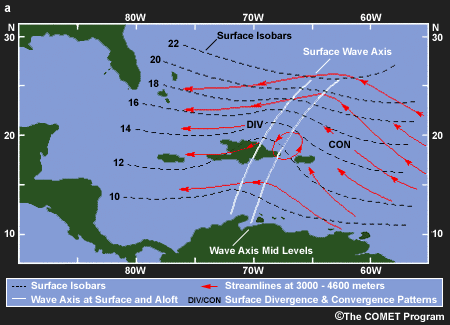
Schematic of an African easterly wave over the Caribbean, illustrating: the "inverted V" structure; surface isobars (dark dash); 700 hPa streamlines (red); regions of surface convergence and divergence; and eastward tilt of the wave with height (white lines with upper trough axis to east).
|
|