Appearance in Satellite Data
Tropical Cyclones (TCs) evolve through a transformation cycle of stages from a tropical depression (stage #1) to tropical cyclone (stage #3). When viewed on the visible (VIS) , infrared (IR) and water vapor (WV) images, we can see that these tropical disturbances show several common features throughout their transformation in all channels (VIS,IR and WV).
|
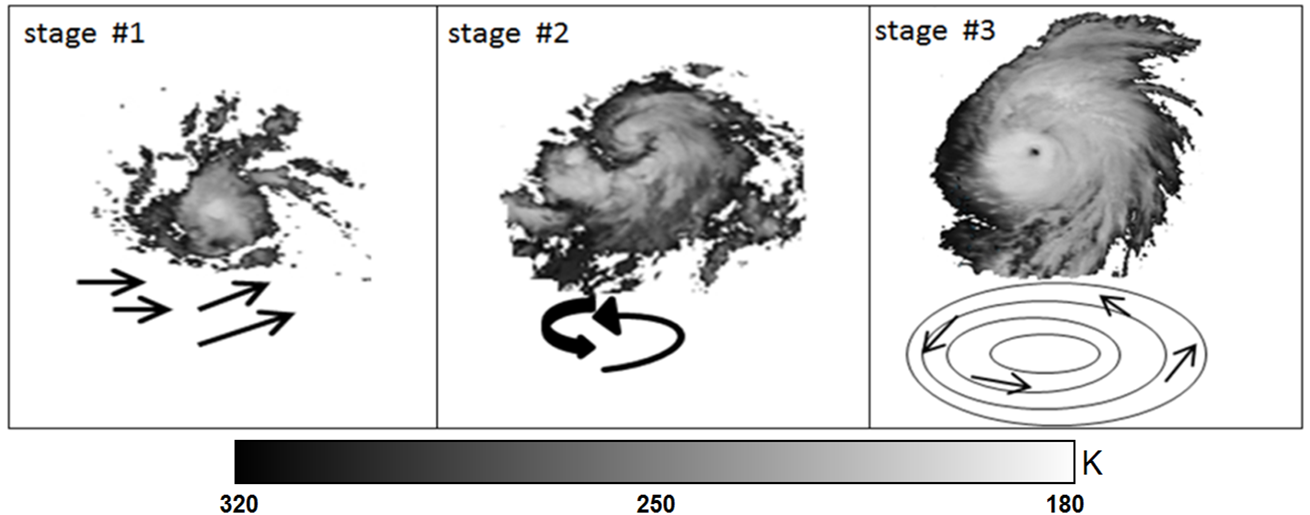
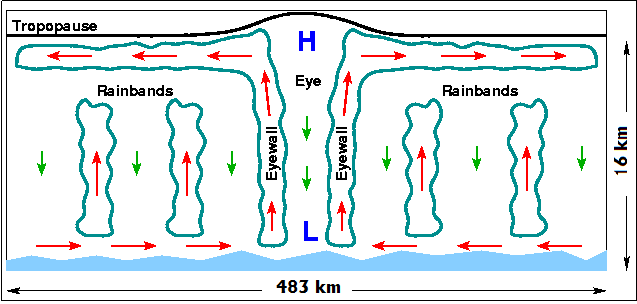
A schematic of a TC at different stages of development. The stronger storm (stage#3) demonstrates the spiral banding, increasing centralization, eye and eyewall (features of TC).
|
|
|
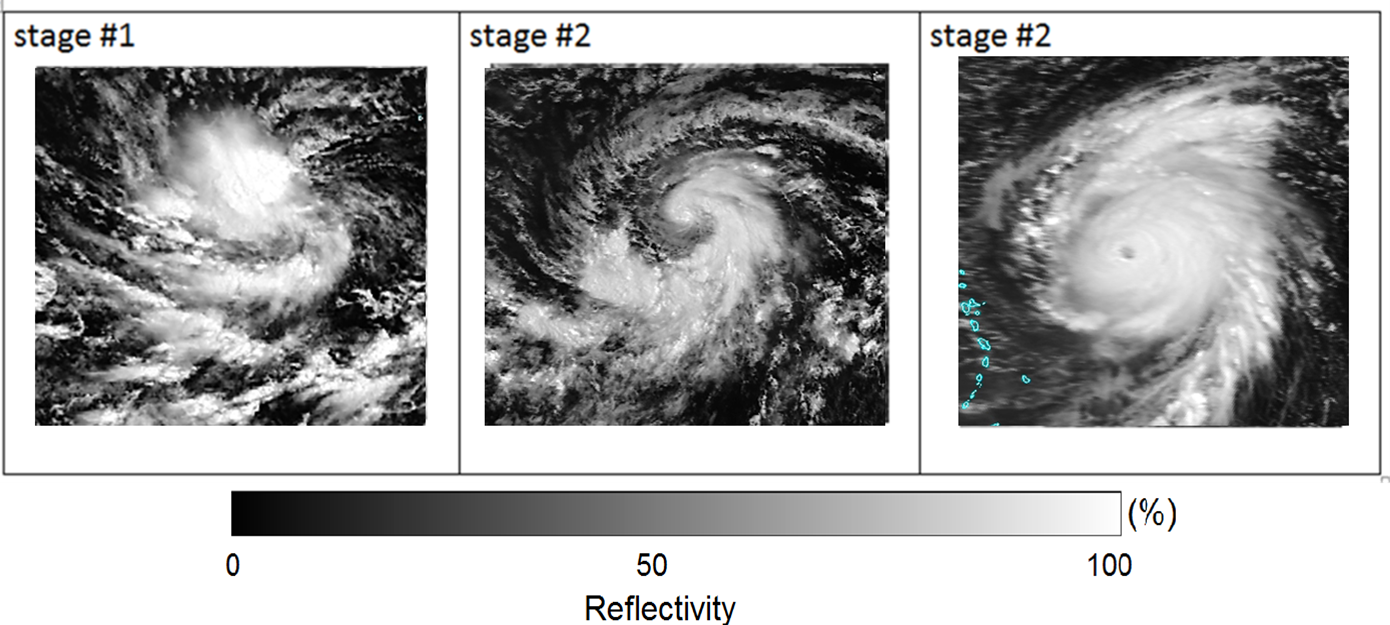
18 August 2009 / 12:00 UTC. Meteosat-9 Visible images of TC Bill (2009) at different stages of development.
|
|
|
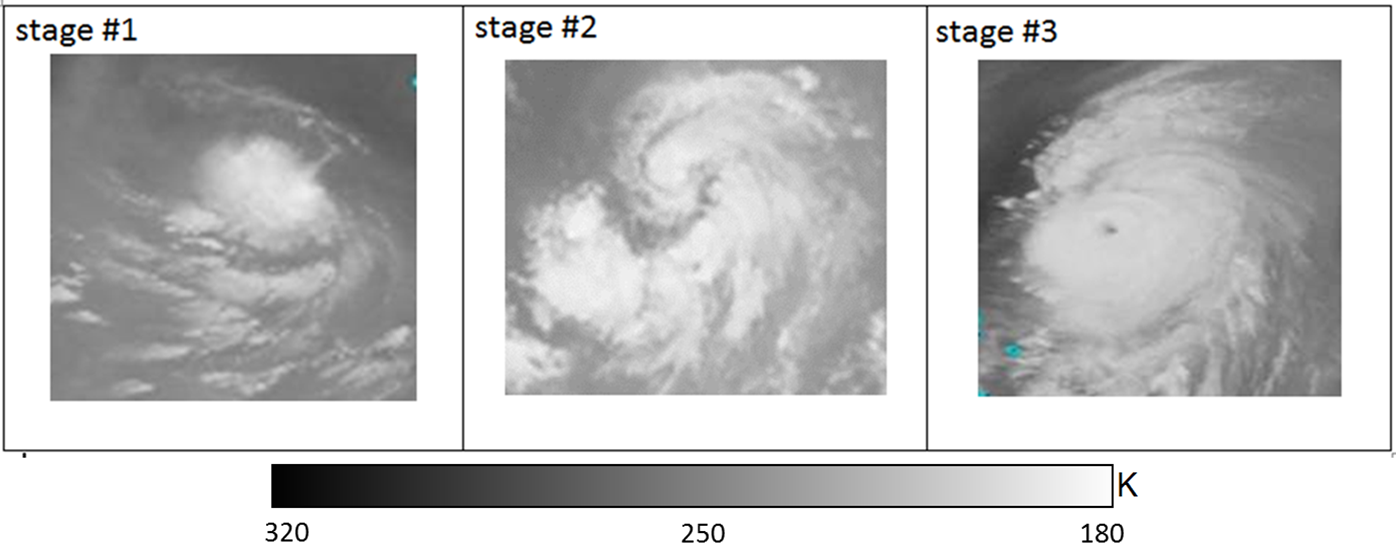
18 August 2009 / 12:00 UTC. Meteosat-9 WV images of TC Bill (2009) at different stages of development.
|
|
|
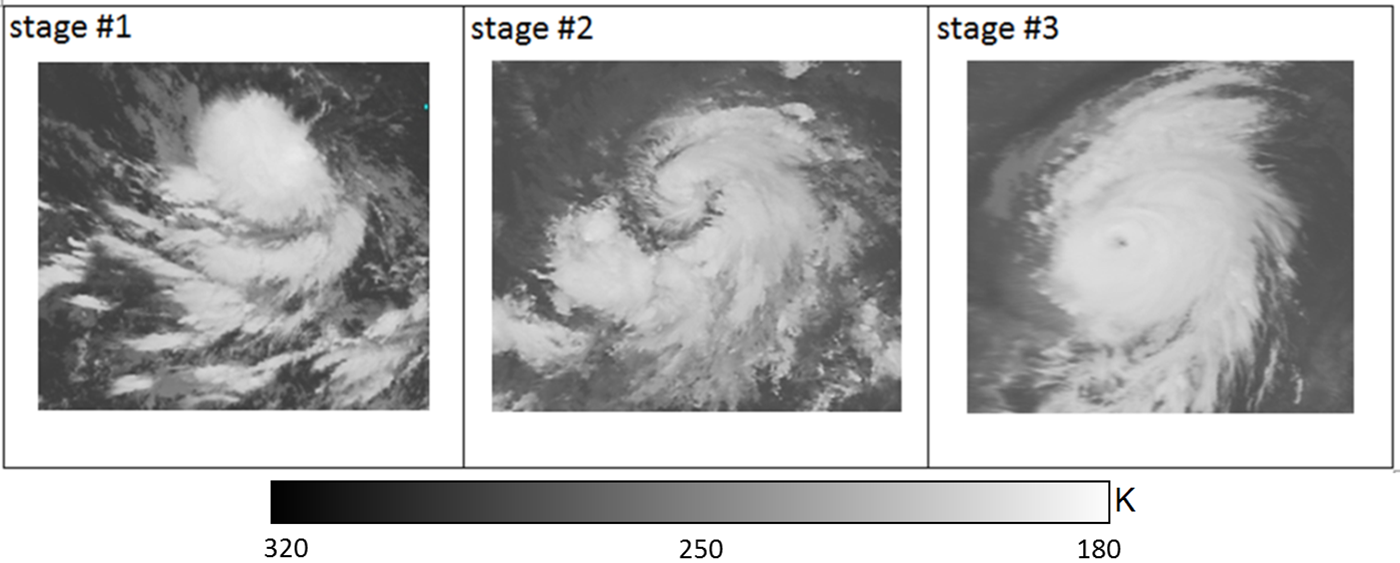
18 August 2009 / 12:00 UTC. Meteosat-9 IR images of TC Bill (2009) at different stages of development.
|
|
Tropical depressions appear to have little organization when viewed from a satellite. Instead of the circular appearance similar to TCs, tropical depressions look more like a group of individual thunderstorms. Once a tropical depression has intensified to the point where its maximum sustained winds are between 63-118 km/h, it becomes a tropical storm. Its rotation becomes more clearly recognizable than that of a tropical depression.
A tropical storm becomes a TC when sustained wind speeds reach 119 km/h. A pronounced rotation develops around the central core. Because of the Earth's rotation, tropical cyclones rotate clockwise in the Southern Hemisphere and counterclockwise in the Northern Hemisphere. They can reach 80-800 km in diameter. The Meteosat-9 IR images, when combined with NWP information, highlight the intense eyewall convection, spiral cloud bands (red) with subsidence between them (light to dark blue) and a clear eye. These features are evident in the enhanced IR images below (stage#3). The eyewall is the region of intense winds and rainfall surrounding the eye. The wide bands of clouds and precipitation spiraling away from the eye wall are known as spiral rain bands.
|
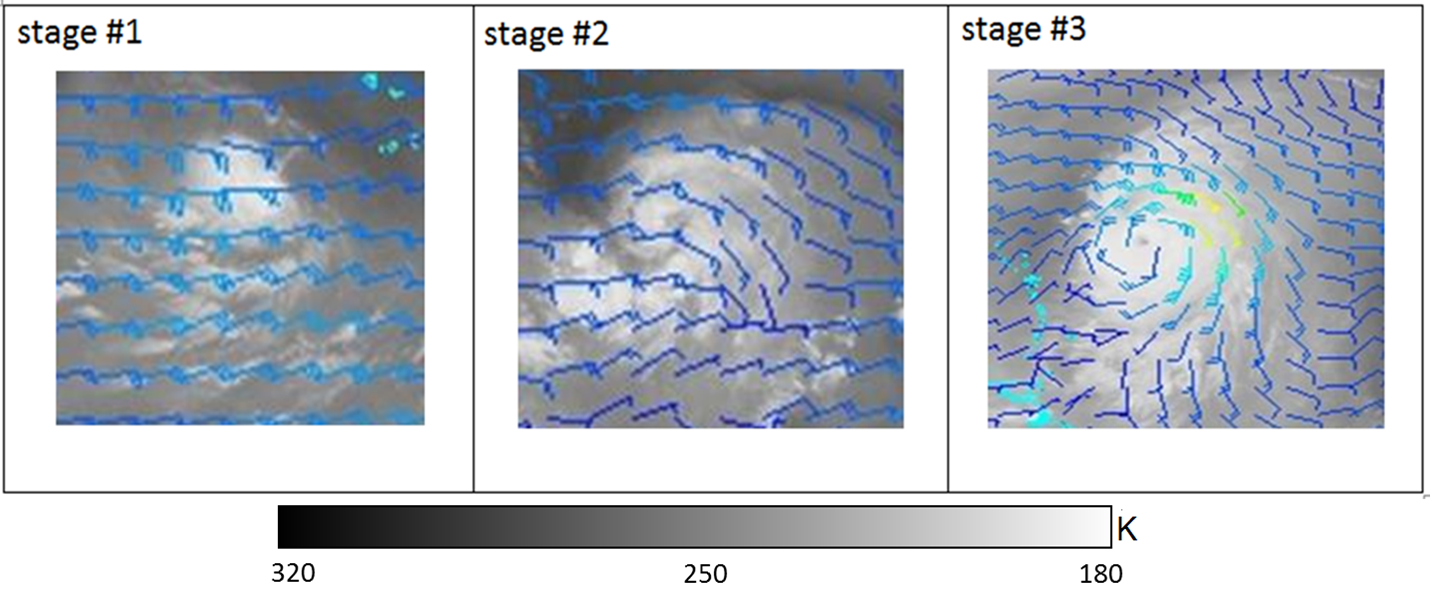
18 August 2009 / 12:00UTC. Combined Meteosat-9 WV images and zonal winds vectors (direction and intensity at 250 hPa) in TC Bill (2009) at different stages of development. Wind vectors based on GFS reanalysis data.
|
|
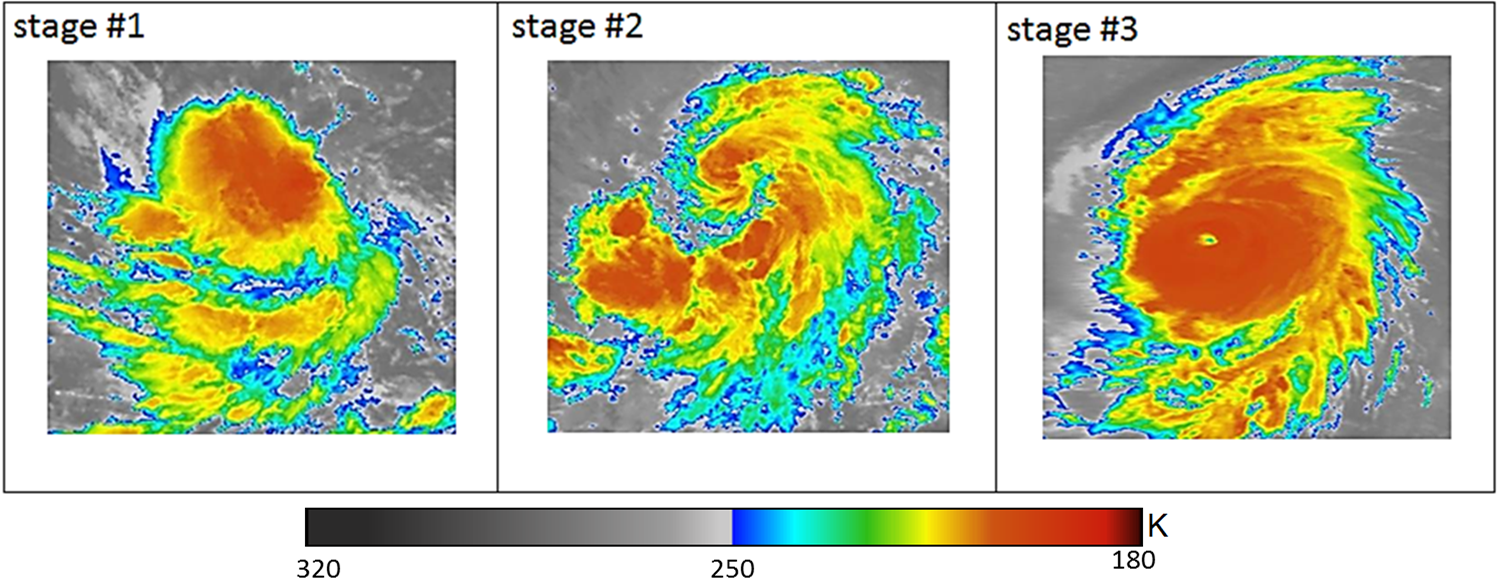
The Meteosat-9 Enhanced IR images also identify regions of enhanced thermal contrast for the three stages of development in TC Bill (2009). Stage#3 demonstrates the most basic circular shape around the eye, while stage#2 shows a curved band pattern. This curved band pattern is often easier to follow in Enhanced IR images than in visible, WV and IR images.
|
18 August 2009 / 12:00 UTC. Meteosat-9 Enhanced IR images of TC Bill (2009) at different stages of development.
|
|
|
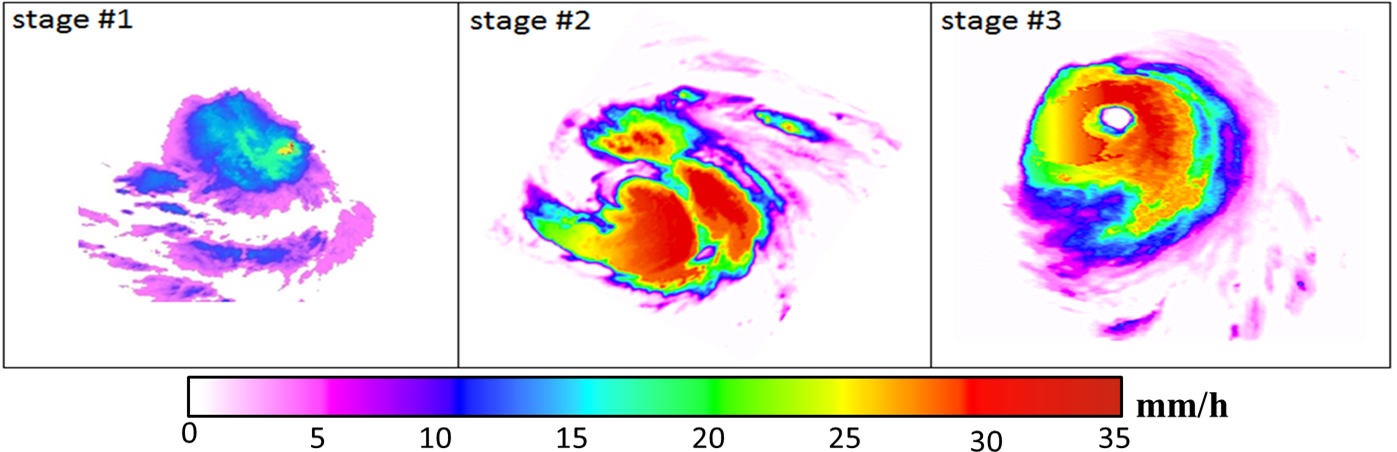
18 August 2009 / 12:00 UTC. Meteosat-9 Multi-sensor Precipitation Estimate (MPE) images of TC Bill (2009) at different stages of development.
|
|
The IR and MPE images can identify the eye pattern, such as the location of the eye, due to the clear contrast between the warmest part of the eye and the coldest convective areas surrounding the eyewall. Convection is often organized into multiple distinct "cells" that rotate cyclonically around the eyewall. These cells are the detectable result of strong updrafts.
The idea behind the curved band pattern is that the intensity of system vorticity is indicated by the extent to which the rainbands are wrapped around the eyewall. Typically, the curved band structure is positioned outside the eyewall, which is associated with stratiform precipitation dominant due to occasional cold pools near the surface. Downdrafts are more common; often containing cool/dry air.
|
A schematic of radial and vertical wind fields at low and upper levels can be seen in the diagram above (stage#3). The radial inflow and vertical velocity components at low levels are driven by friction in the boundary layer. These components supply the rainbands and eyewall with warm moist air. The radial outflow and vertical velocity at upper levels are driven by the ascending features from below and the pressure gradient associated with the upper- level anticyclone. The ascending features of vertical velocity are driven by low-level convergence and local buoyancy. The descending features of the vertical wind field are driven by mass balance and convergence aloft.
|
|
At the surface, the winds rush towards the center of a TC, where air is then forced upwards. The Coriolis force acts on these surface winds and, in the Northern Hemisphere, the deflection is to the right. The convergence at the eye wall is so strong that the air is lifted faster and with much greater force here than at any other location of the TC. This maximizes moisture transport from the ocean and the subsequent production of latent heat. Outward aloft (below the tropopause) from the eye wall, we can see a a structure of cloud bands. These clouds are known as spiral rain bands (or spiral bands). These features can usually be seen clearly in the visible, infrared and water vapour images.
|
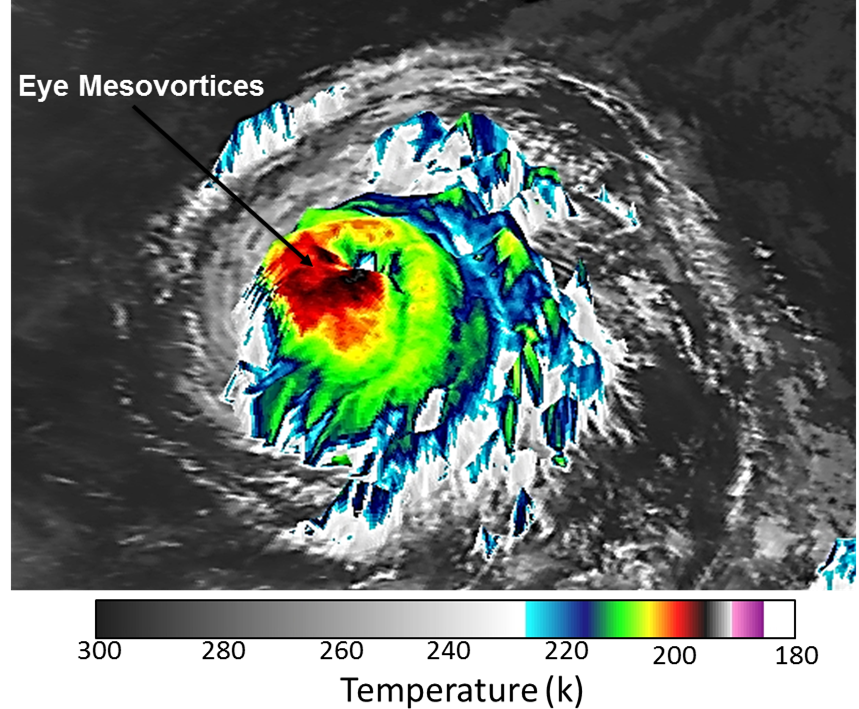
18 August 2009 / 12:00 UTC. 3-D view of TC Bill (2009) observed by Meteosat-9 Enhanced IR imagery.
|
|
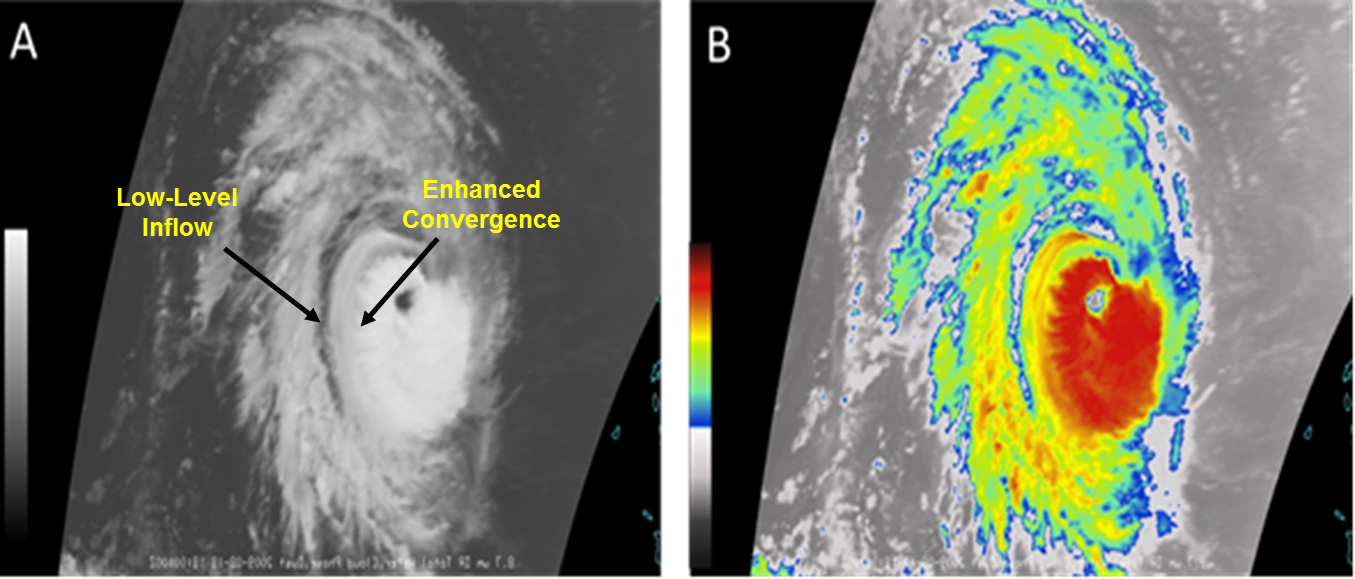
In the eye, the winds drop abruptly to light breezes or even complete calm. The lowest sea-level pressures occur in or near the eye. Eye mesovortices (distinct cyclonic and anti-cyclonic features in the low-level clouds) generate buoyant convection in the eyewall by ejecting the warm, moist air from the low-level eye and producing enhanced convergence at the eyewall cloud base. The most distinctive characteristic of a TC is the horizontal (or tangential) circulation that results from horizontal pressure gradients (primary circulation). These features can usually be seen clearly in the visible, infrared and water vapour images.
|
19 August 2009 / 06UTC. Meteosat-9 IR images of the TC Bill. A) IR imagery and B) Enhanced IR imagery.
|
|
Meteosat-9 Imagery Examples: TC Bill(2009)
As an example, here are the satellite animation of the cyclogenesis and path taken by TC Bill (2009) in the North Atlantic basin. Based on the Meteosat-9 Enhanced infrared (IR) animation of Hurricane Bill in the period from 14 through 18 August 2009, we can see the transformation from stages 1 to 3. The origin of Hurricane Bill can be traced to the eastern tropical North Atlantic and, more precisely to a vigorous tropical wave with an associated broad area of low pressure that emerged from western Africa on 12 August, and then moved westwards, well south of the Cape Verde Islands, a day later. By 14 August, the deep convection associated with the system had consolidated and a few curved rainbands developed, primarily on the south side of the disturbance. By 18 August, it became a Hurricane.

|
Press "Play Button" to see the loop; The Meteosat-9 Enhanced IR animation of TC Bill (2009) over the North Atlantic, showing different stages of development that are associated with changes in the storm intensity and structure. |
The cloud features of Hurricane Bill which are visible at the beginning of the intensification stage appear to play a distinctive role in determining its final structure. We see a distinct eye, surrounded by very cold convective tops (less than 200 K in red color). During stage#3, the Intertropical Convergence Zone (ITCZ) is very active. As a result of increasing convection under the influences of cyclonic circulation, a diverging convection at upper levels drives asymmetric mesoscale descent (adiabatic warming) in the eye, which lowers the pressure, increasing the pressure gradient and tangential winds.
The Meteosat-9 IR animations are supplemented with Multi-sensor Precipitation Estimate (MPE) images of TC Bill from 14 to 18 August 2009 at 12.00 UTC, to confirm that the transformation stages of Bill have begun. The MPE is an instantaneous rain rate product, which is a proxy for rainfall from deep convective clouds. We can see several strong precipitation anomalies (> 30 mm) during this period, of which only some seem to be directly related to the Atmospheric Easterly Waves (AEWs). These became more marked and confined, with intensification of the ITCZ.
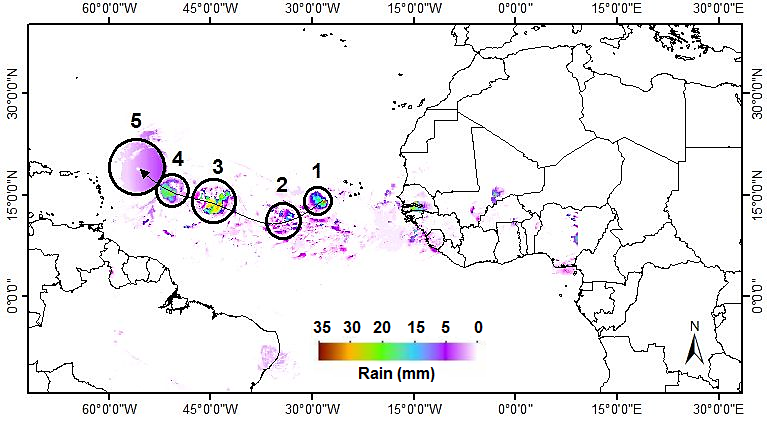
The rainband image for a TC is one of the most prominent satellite signatures. TC Bill (2009) provides a good example of this structure. In all five steps, a marked increase of deep clouds and rainbands outside the inner core, during the transformation from a tropical disturbance, suggests that convection is seldom organized into a uniform ring of ascent. The result is an asymmetric appearance of clouds and deep convection (rainfall) compared to the more symmetric structure during the mature stage of TC Bill.
|
Daily evolution of TC Bill for Meteosat MPE product on 1) Aug 14th 2009, 2) Aug 15th 2009, 3) Aug 16th 2009, 4) Aug 17th 2009 and 5) Aug 18th 2009. Open circles mark the day at 12.00 UTC positions.
|
|