Key Parameters
The numerical parameters in this chapter are calculated from ERA INTERIM reanalysis. They present two types of EOF analysis.
Low levels
- Temperature at 1000 hPa shows the surface temperature gradient accompanying the passing frontal system. Temperature is also one of the factors contributing to the triggering of convection.
- Mean sea level pressure shows surface lows and highs, as well as pressure gradients accompanying frontal system passages.
- Wind (850 hPa) shows the large-scale low-level flow that transports moisture.
- Moisture convergence is one of the factors contributing to the development of convection. Moisture convergence is strongest in low levels.
|
|
|
|---|---|
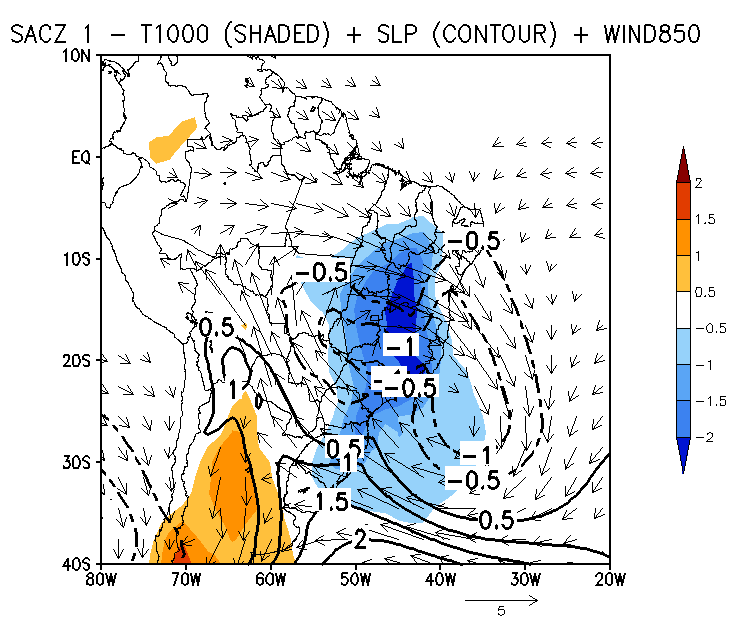
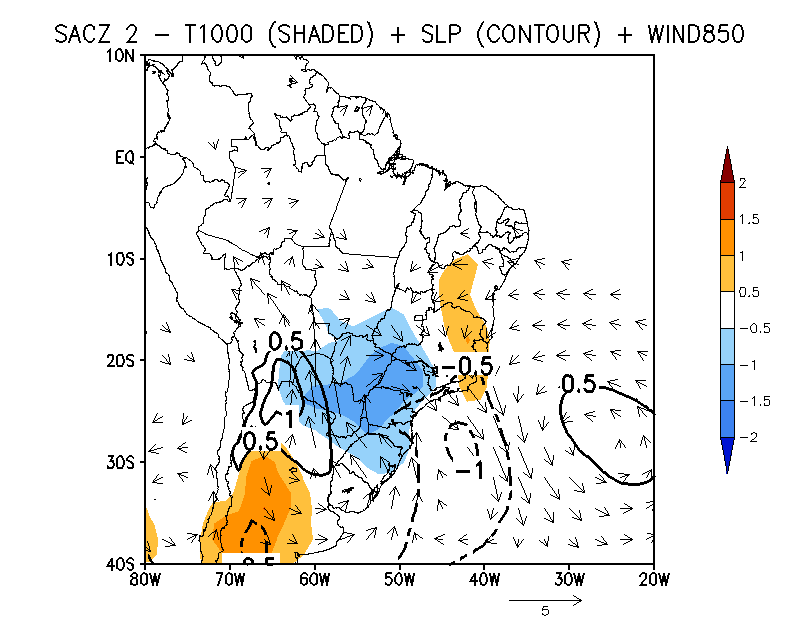
| There is well-defined low-level cyclonic circulation over southeastern Brazil (centered over the state of Espírito Santo) accompanied by negative anomalies of mean sea level pressure and wind convergence. The main low-level flow arises from the Amazon Region, transporting moisture to the southeast. There is also a negative temperature anomaly over the region. As seen in the previous section, the pressure and temperature fields have two poles and the convergence zone lies north of its mean position. | There's a cyclonic circulation over southeastern Brazil (centered over São Paulo), accompanied by weak negative anomalies of mean sea level pressure and temperature. The flow and the anomalies are less prominent than in Type 1, but there is a flow from the Atlantic to the continent. As seen in the previous section, the pressure and temperature fields have three poles and the convergence zone lies near the mean location. |
|
|
|
Figure 1: Anomalies of temperature at 1000 hPa (shaded), mean sea level pressure (black isolines) and wind vectors at 850 hPa for Type 1.
|
Figure 2: Anomalies of temperature at 1000 hPa (shaded), mean sea level pressure (black isolines) and wind vectors at 850 hPa for Type 2.
|
|
|
|
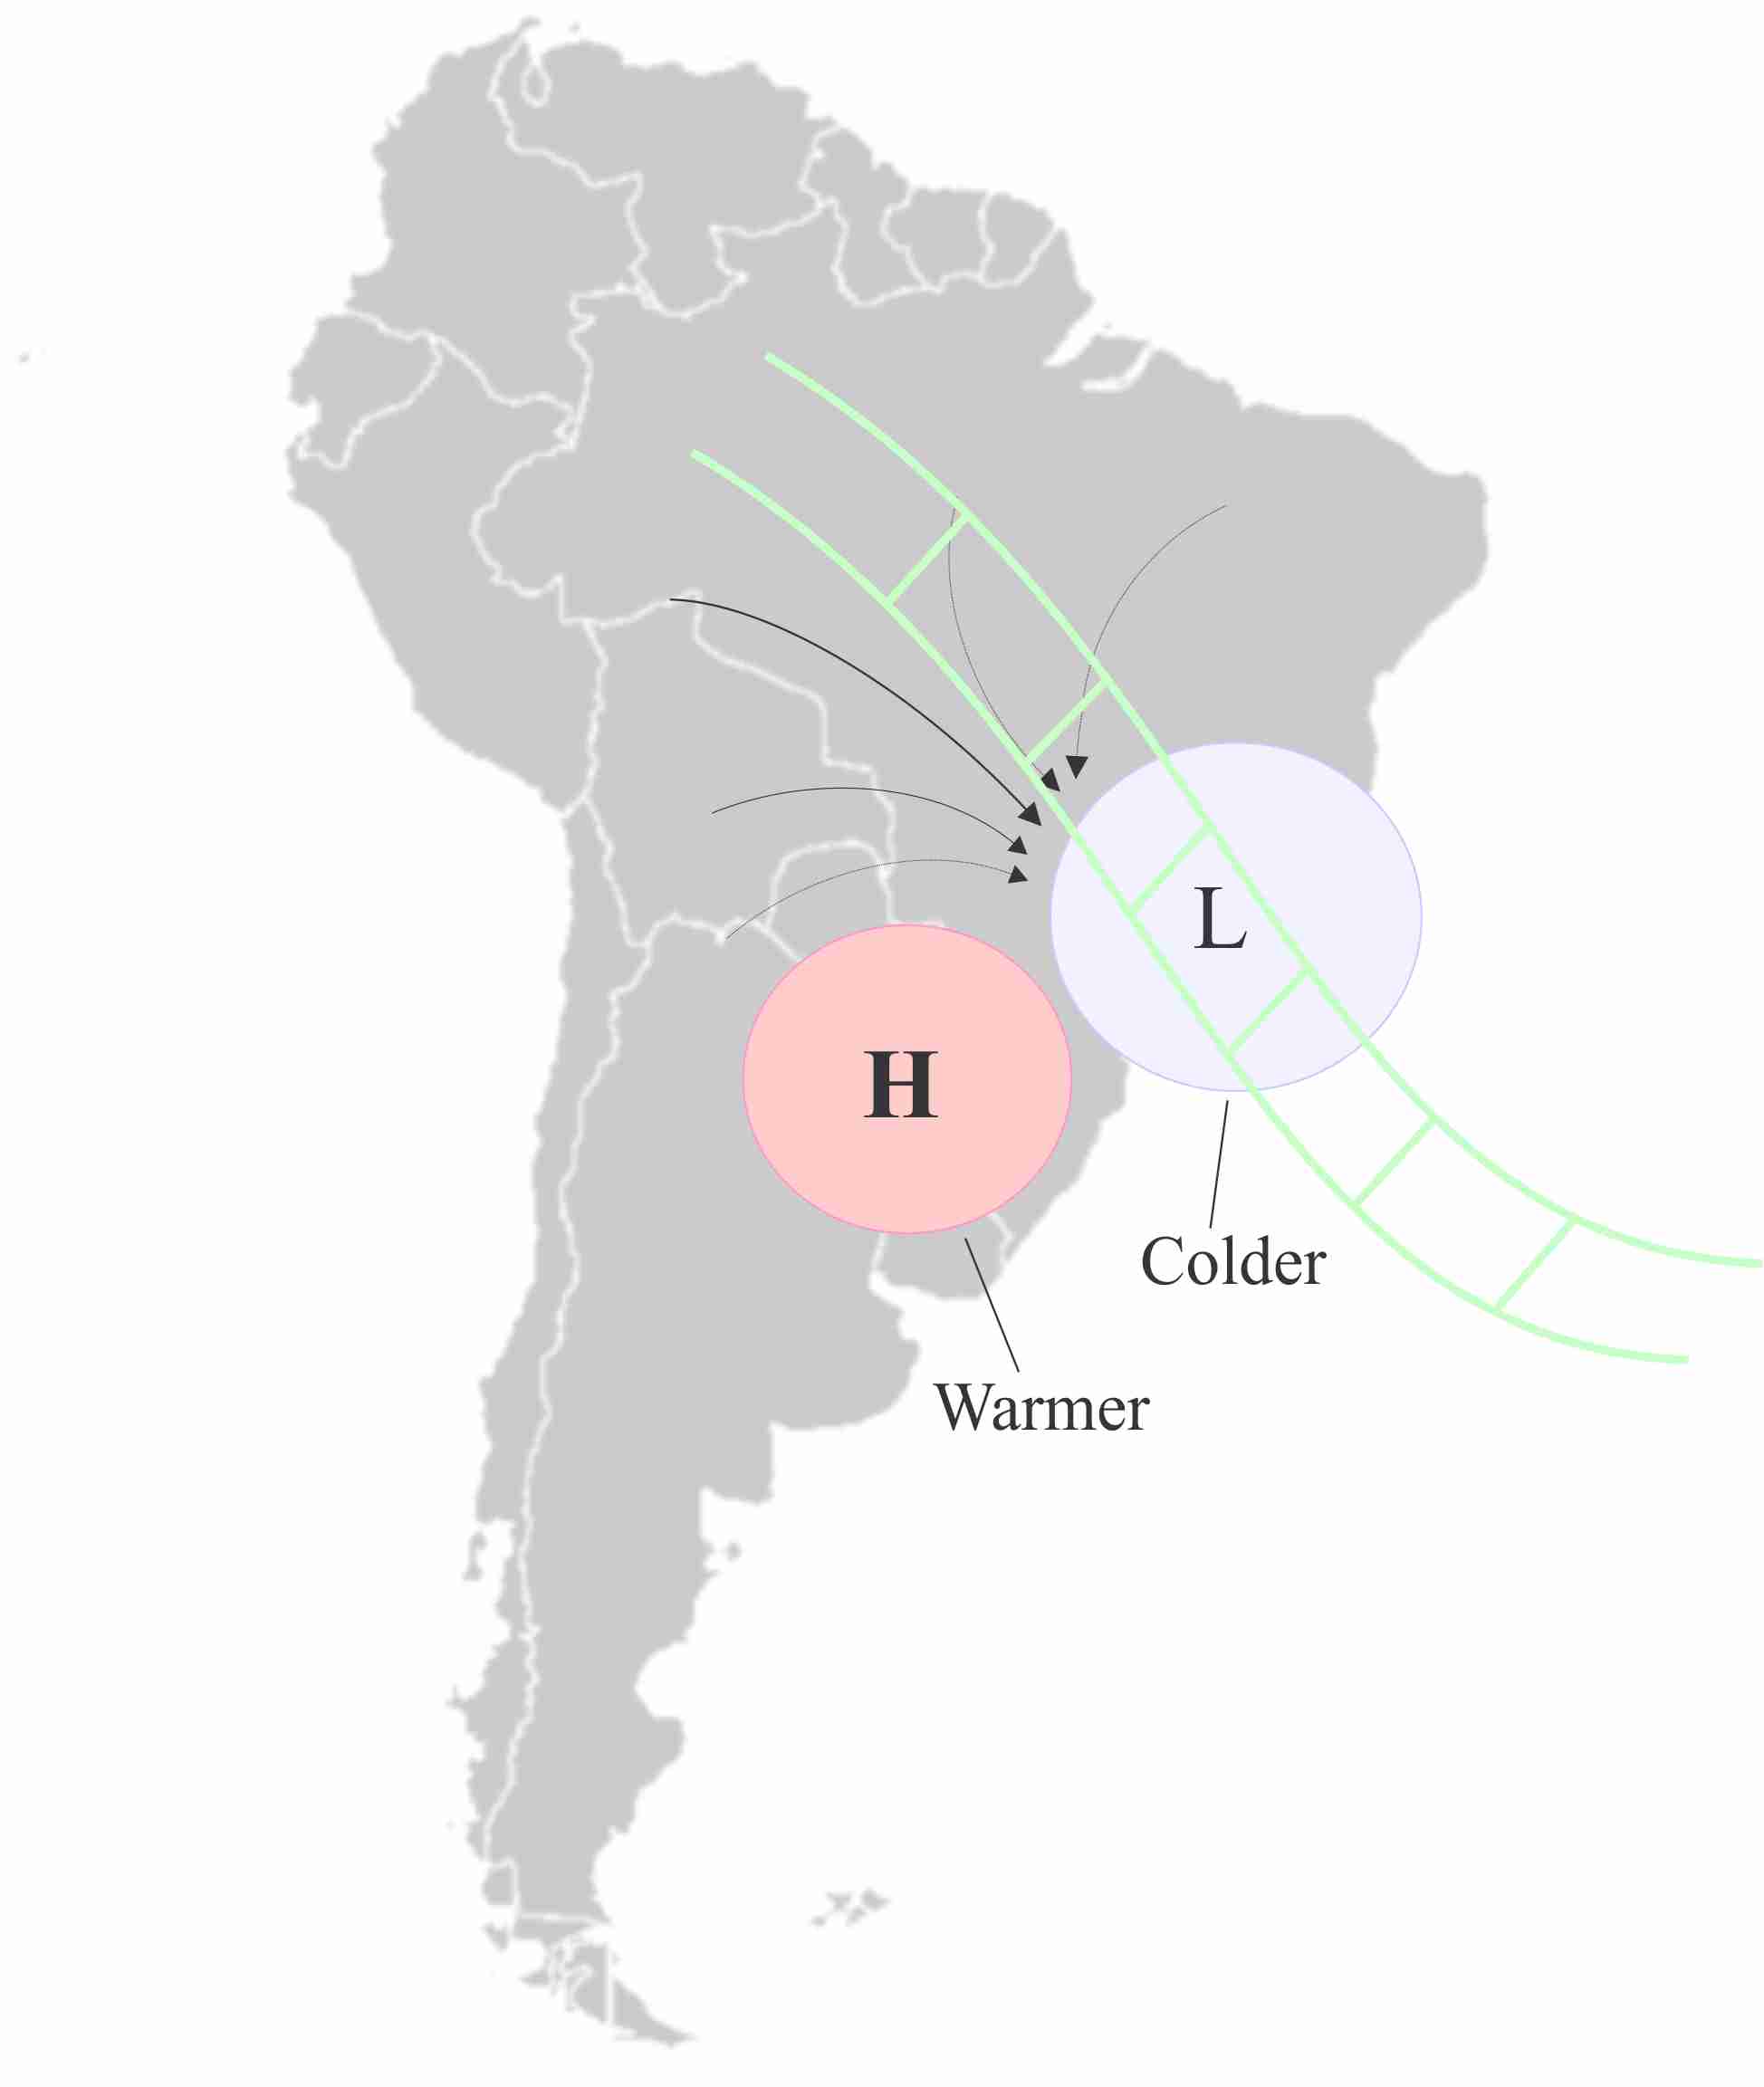
Figure 3: Schematics for Type 1 at low levels (Figure 1): 'dipole pattern' of surface pressure with strong wind convergence. A low over southeast region of Brazil (accompanied by negative temperature anomalies) and a high over south Brazil, Uruguay and Argentina (accompanied by positive temperature anomalies). Green lines: location of the SACZ.
|
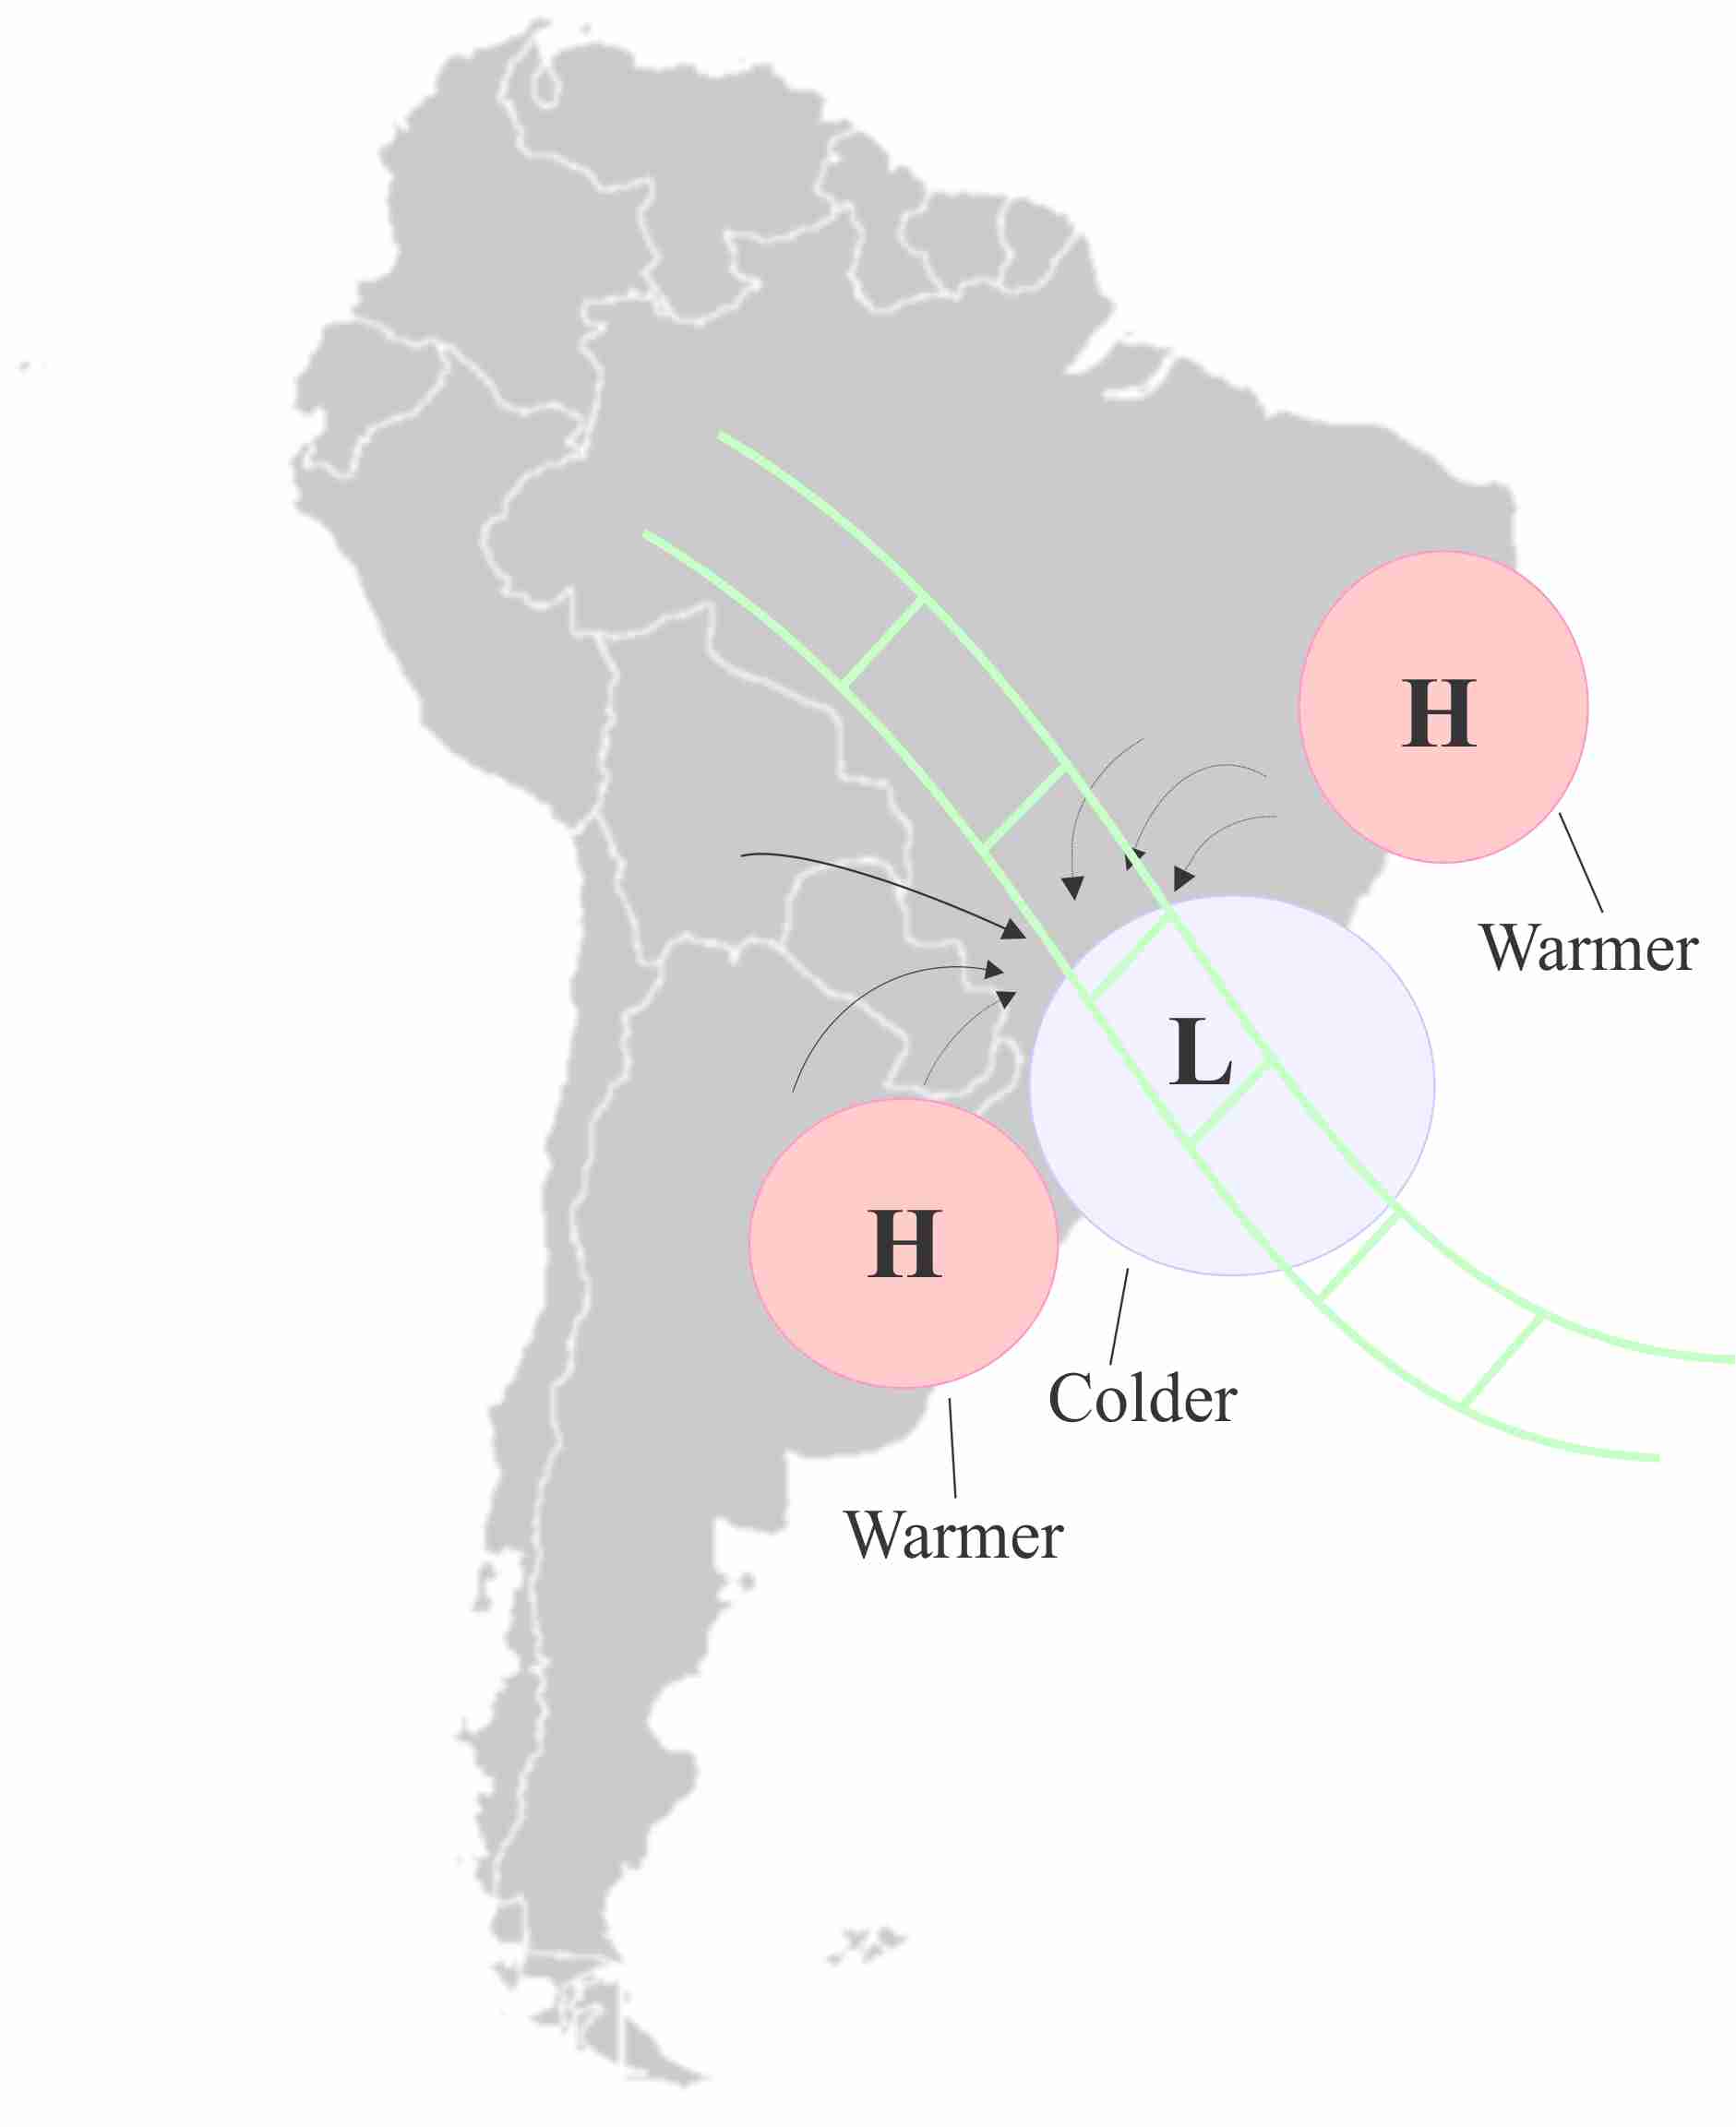
Figure 4: Schematics for Type 2 at low levels (Figure 2): 'tripole pattern' of surface pressure with weak wind convergence. A low over southeastern Brazil (accompanied by negative temperature anomalies) and highs over south Brazil, Uruguay and Argentina and also over northeast Brazil (accompanied by positive temperature anomalies). Green lines: location of the SACZ.
|
Middle levels (500 hPa):
- Vertical velocity (omega) shows the areas of upward motion, contributing to the persistence of convection.
- Geopotential height shows the thermal and pressure distribution of the middle troposphere.
- Wind shows the basic synoptic flow.
|
|
|
|---|---|
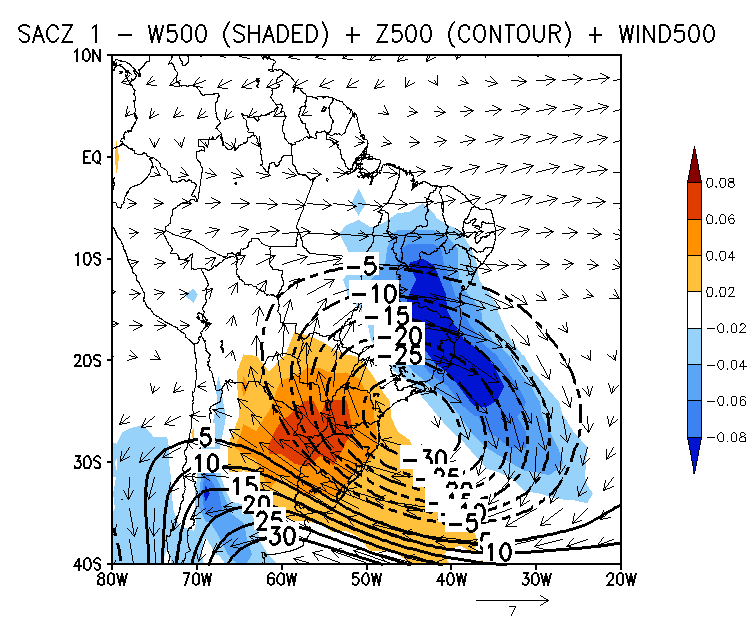
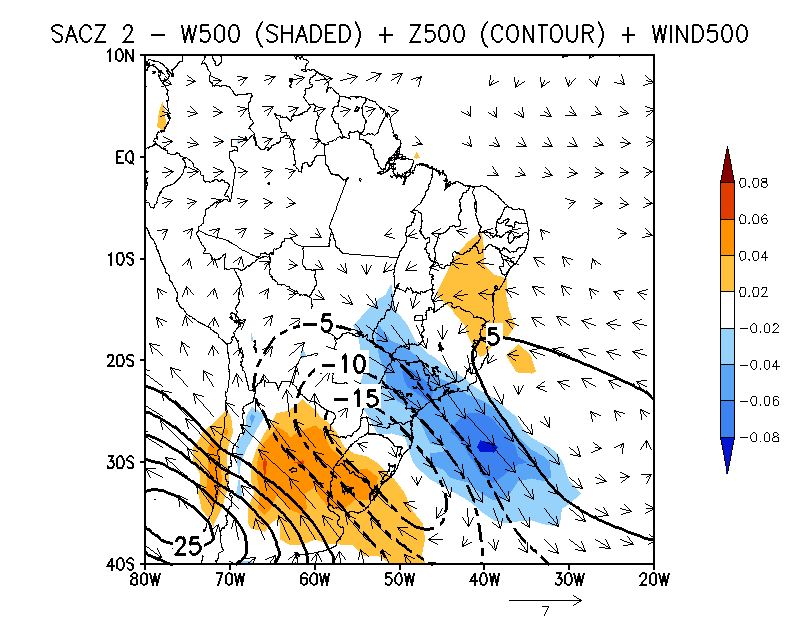
| The geopotential at 500 hPa shows the synoptic scale circulation of a SACZ event. There are negative values of omega over the eastern part of the circulation, which means that there is upward motion in the middle troposphere and convergence below. There is downward motion over southern Brazil. | The 500 hPa geopotential anomalies are weaker than in Type 1. The upward motions are located over the state of São Paulo. The basic flow consists of components coming from Amazonia and the Atlantic Ocean. |
|
|
|
Figure 5: 500 hPa omega (shaded), geopotential (black isolines) and wind vectors for Type 1.
|
Figure 6: 500 hPa omega (shaded), geopotential (black isolines) and wind vectors for Type 2.
|
|
|
|
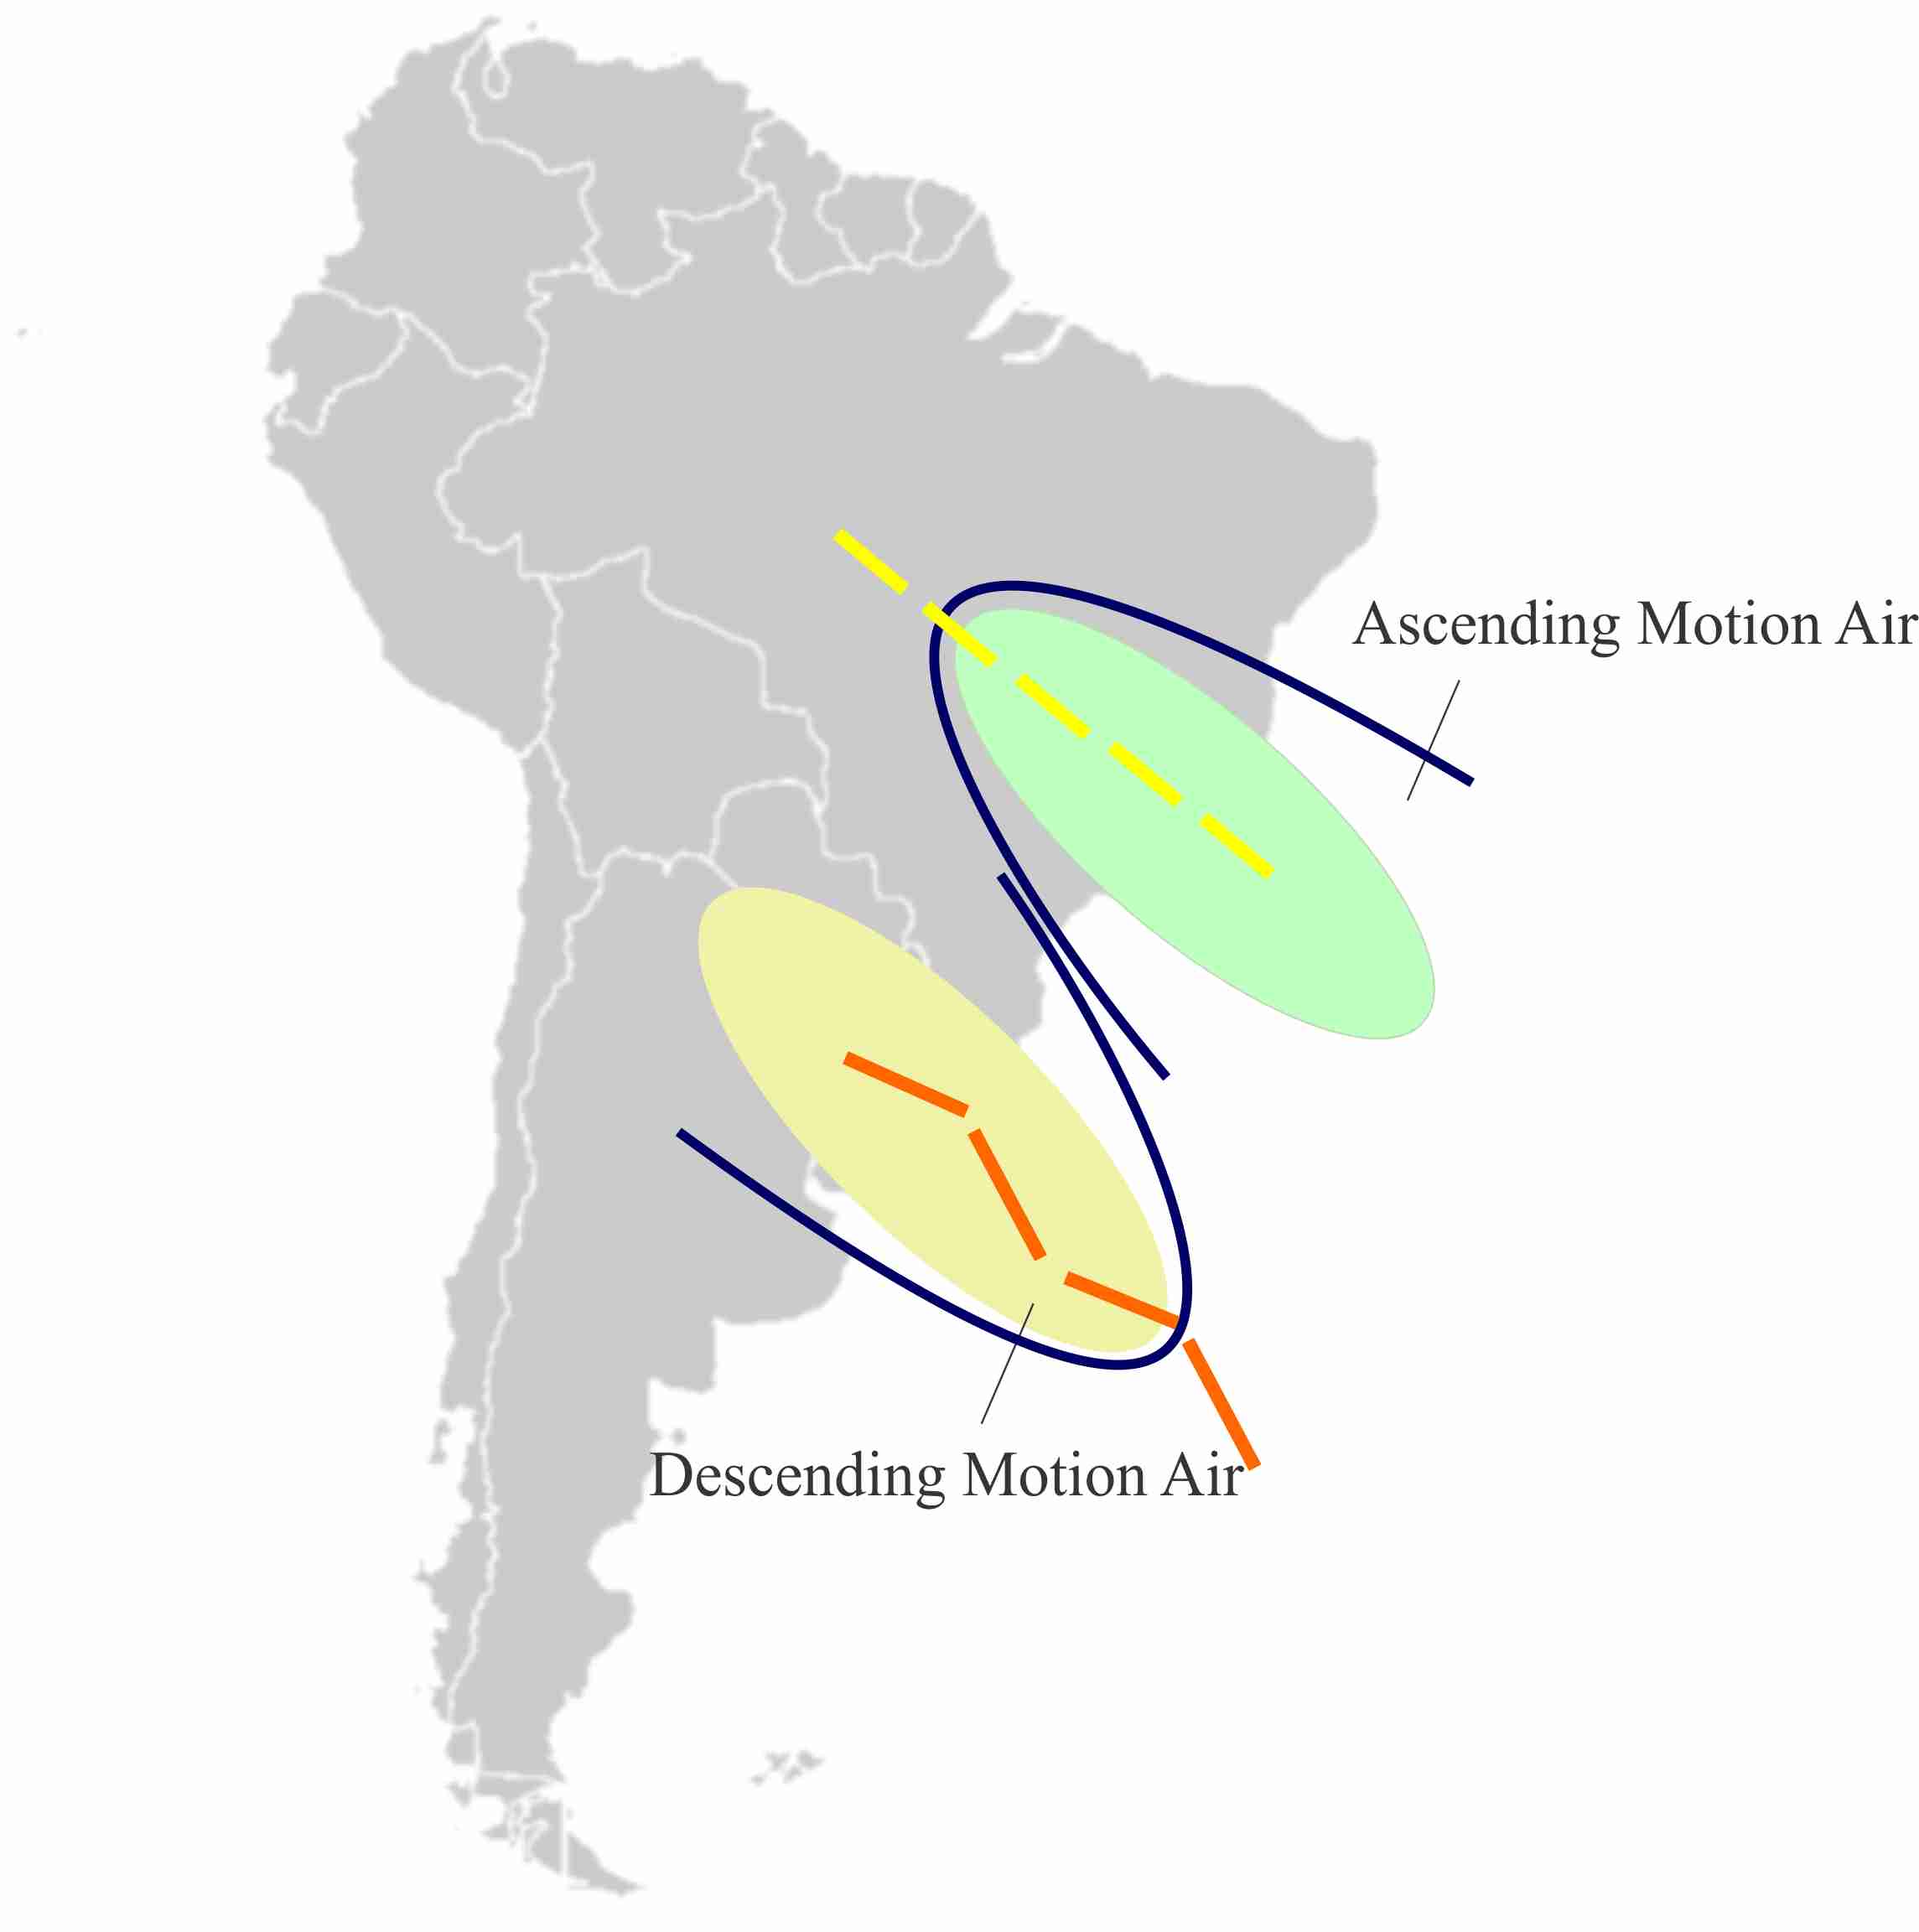
Figure 7: Schematics for Type 1 at middle levels (Figure 5): a trough (axis marked with a dashed yellow line) with ascending motion and a ridge (axis marked with a dashed orange line) with descending motion and clear skies.
|
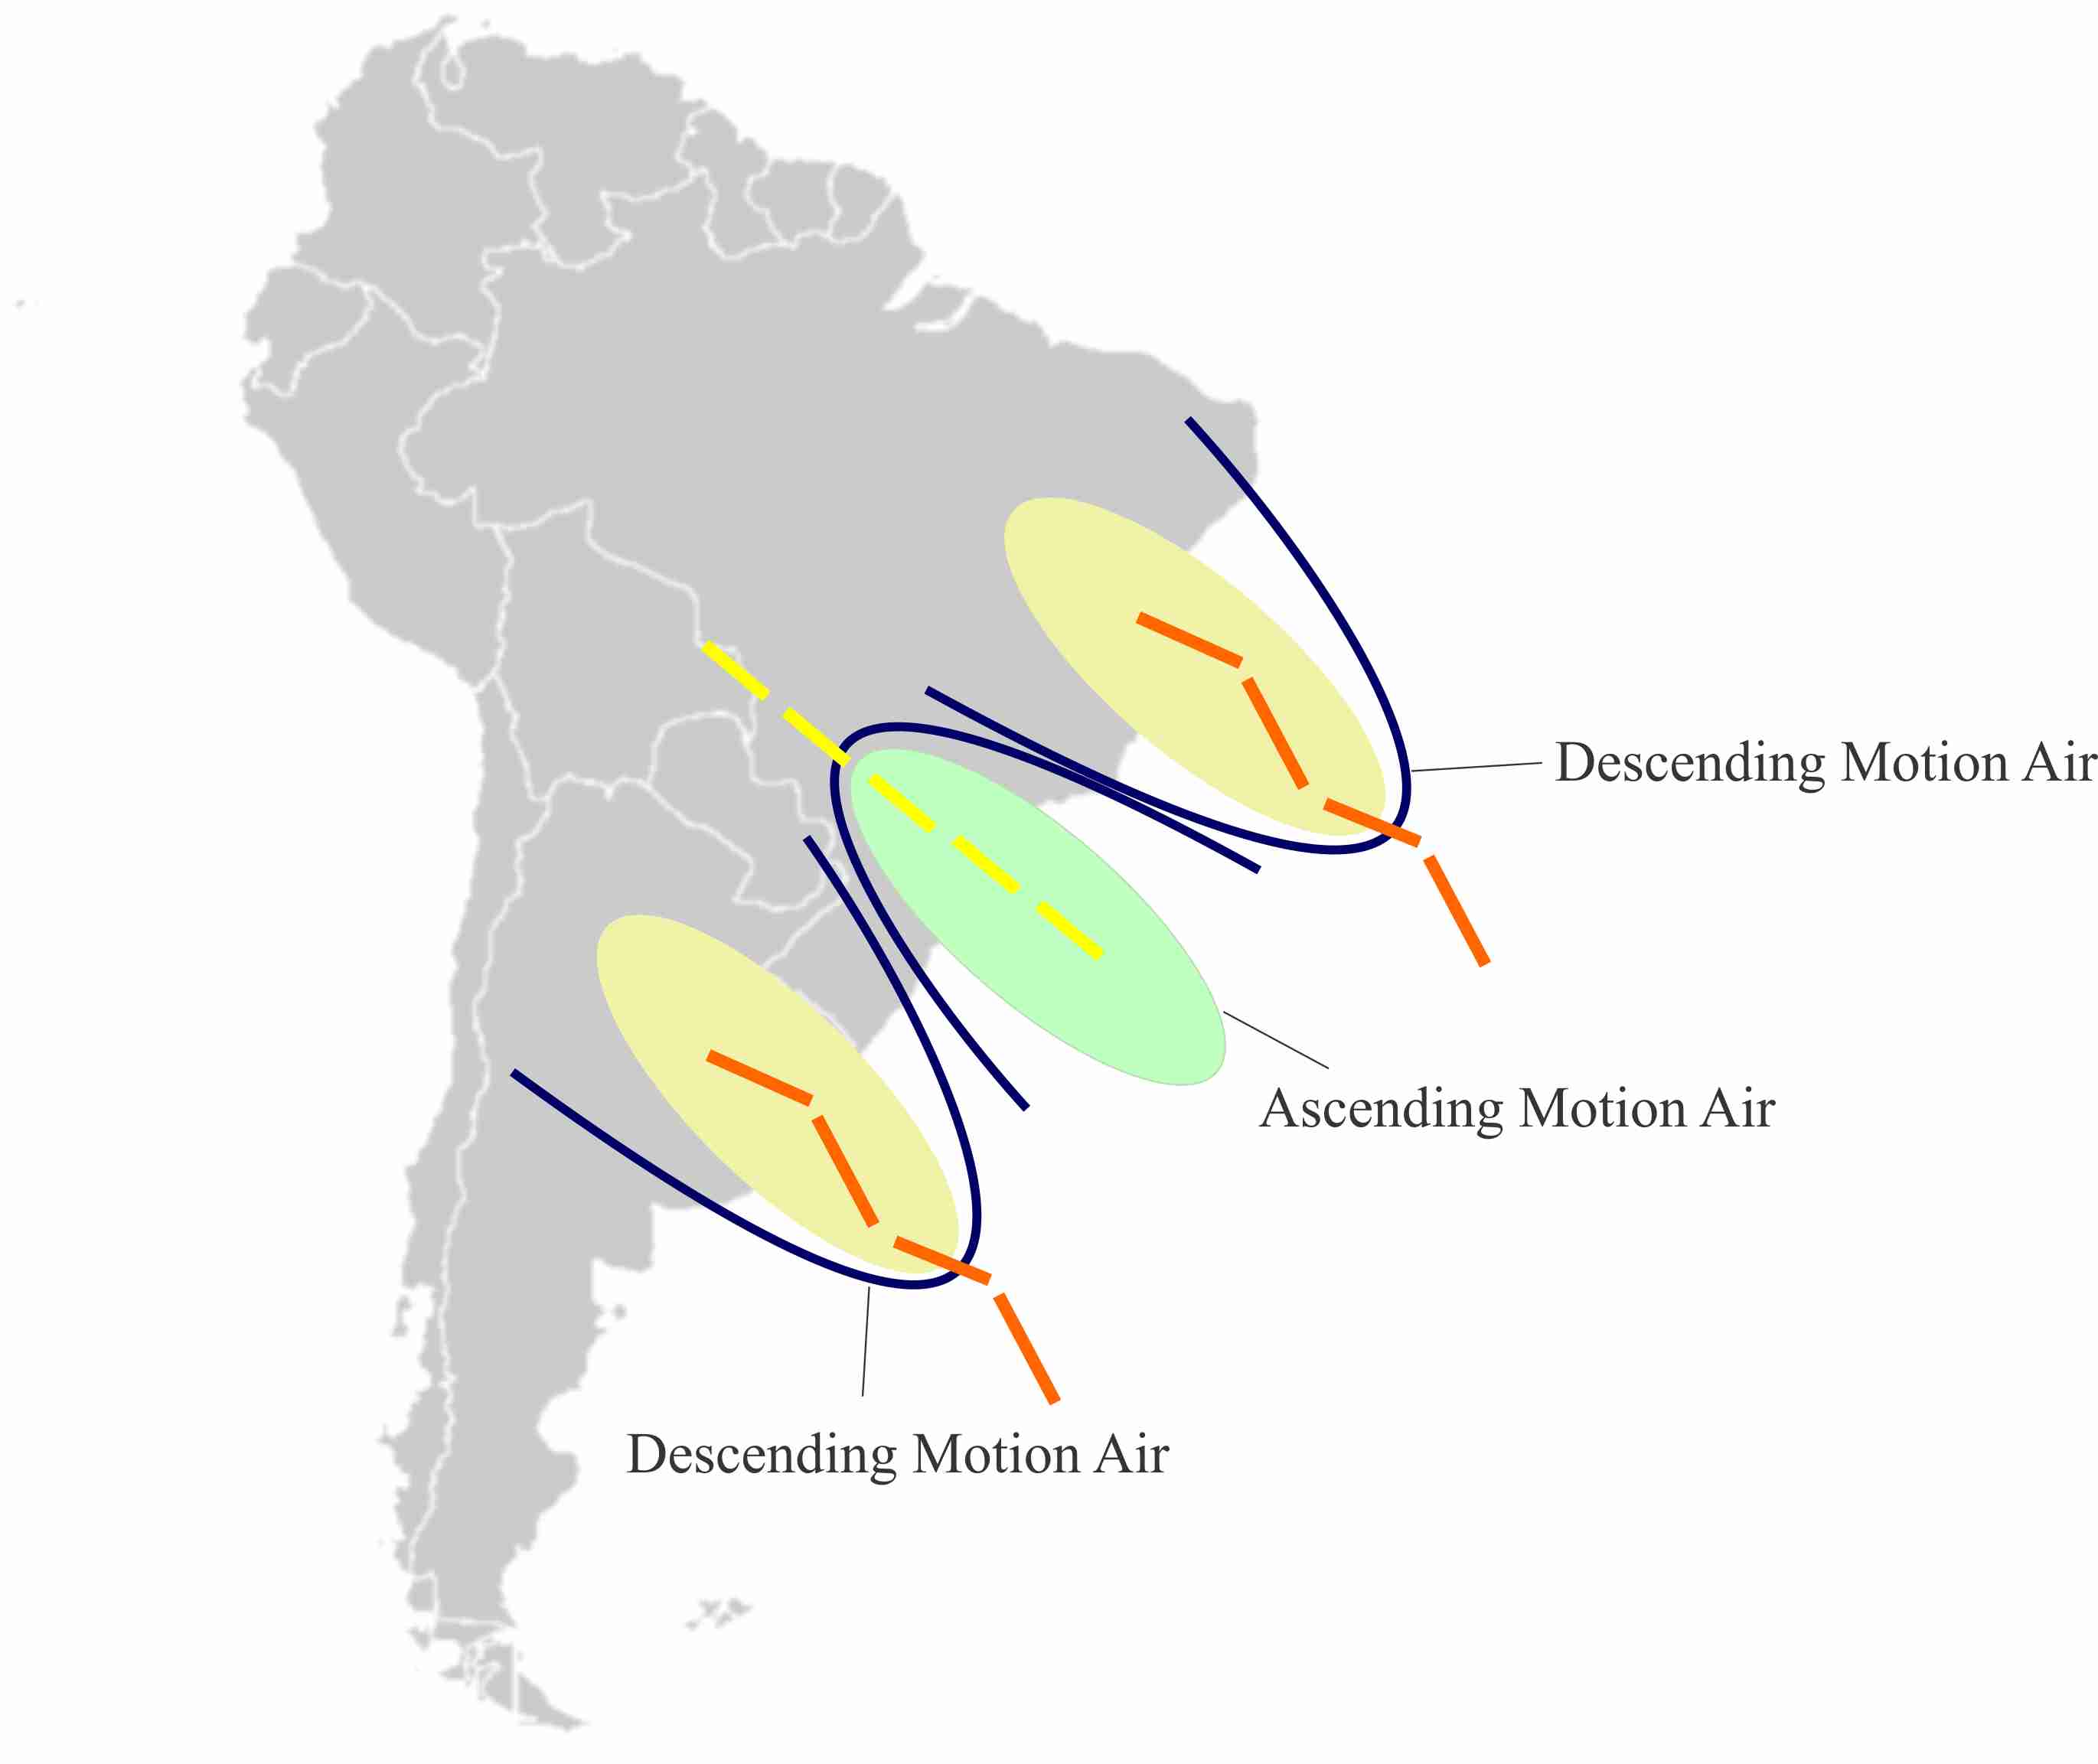
Figure 8: Schematics for Type 2 at middle levels (Figure 6): a trough (axis marked with a dashed yellow line) with ascending motion and two ridges (axes marked with dashed orange lines) with descending motion and clear skies.
|
High levels (200 hPa):
- Zonal wind provides information about high level jet streams.
- Wind shows the basic flow and the waves in it.
- Divergence shows the areas of upward and downward motion in the troposphere.
|
|
|
|---|---|
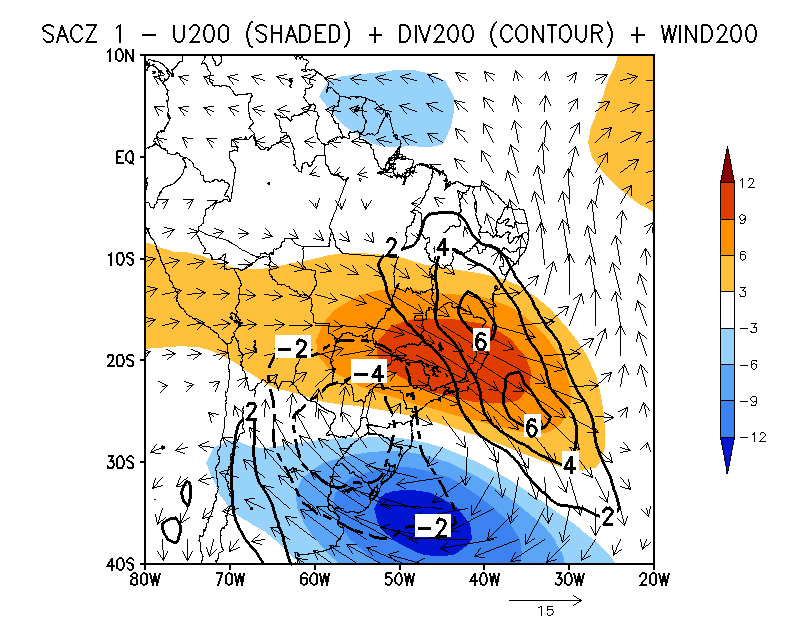
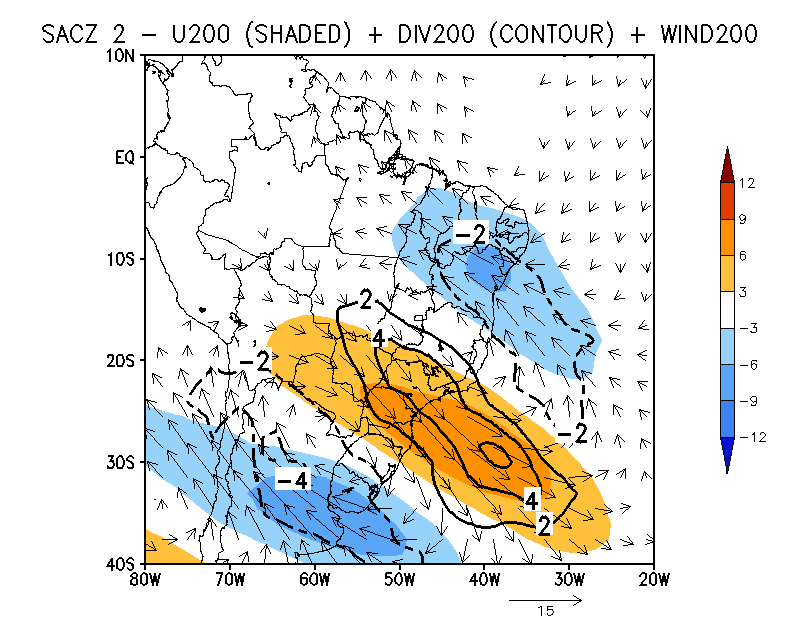
| The jet stream can be found within the region of positive anomalies of zonal wind velocity and divergence. There is a trough with positive values of divergence in the northern part of the circulation. There are easterly winds and negative divergence values over southern Brazil, which imply descending motion and dry air. The 'dipole pattern' is seen here as well as at lower levels. | A westerly wind with positive values of divergence prevails over southern Brazil. Over northeast and southern Brazil there are easterly winds and negative values of divergence. The 'tripole pattern' is seen here as well as at lower levels. |
|
|
|
Figure 9: 200 hPa zonal wind (shaded), divergence (black isolines) and wind vectors for Type 1.
|
Figure 10: 200 hPa zonal wind (shaded), divergence (black isolines) and wind vectors for Type 2.
|
|
|
|
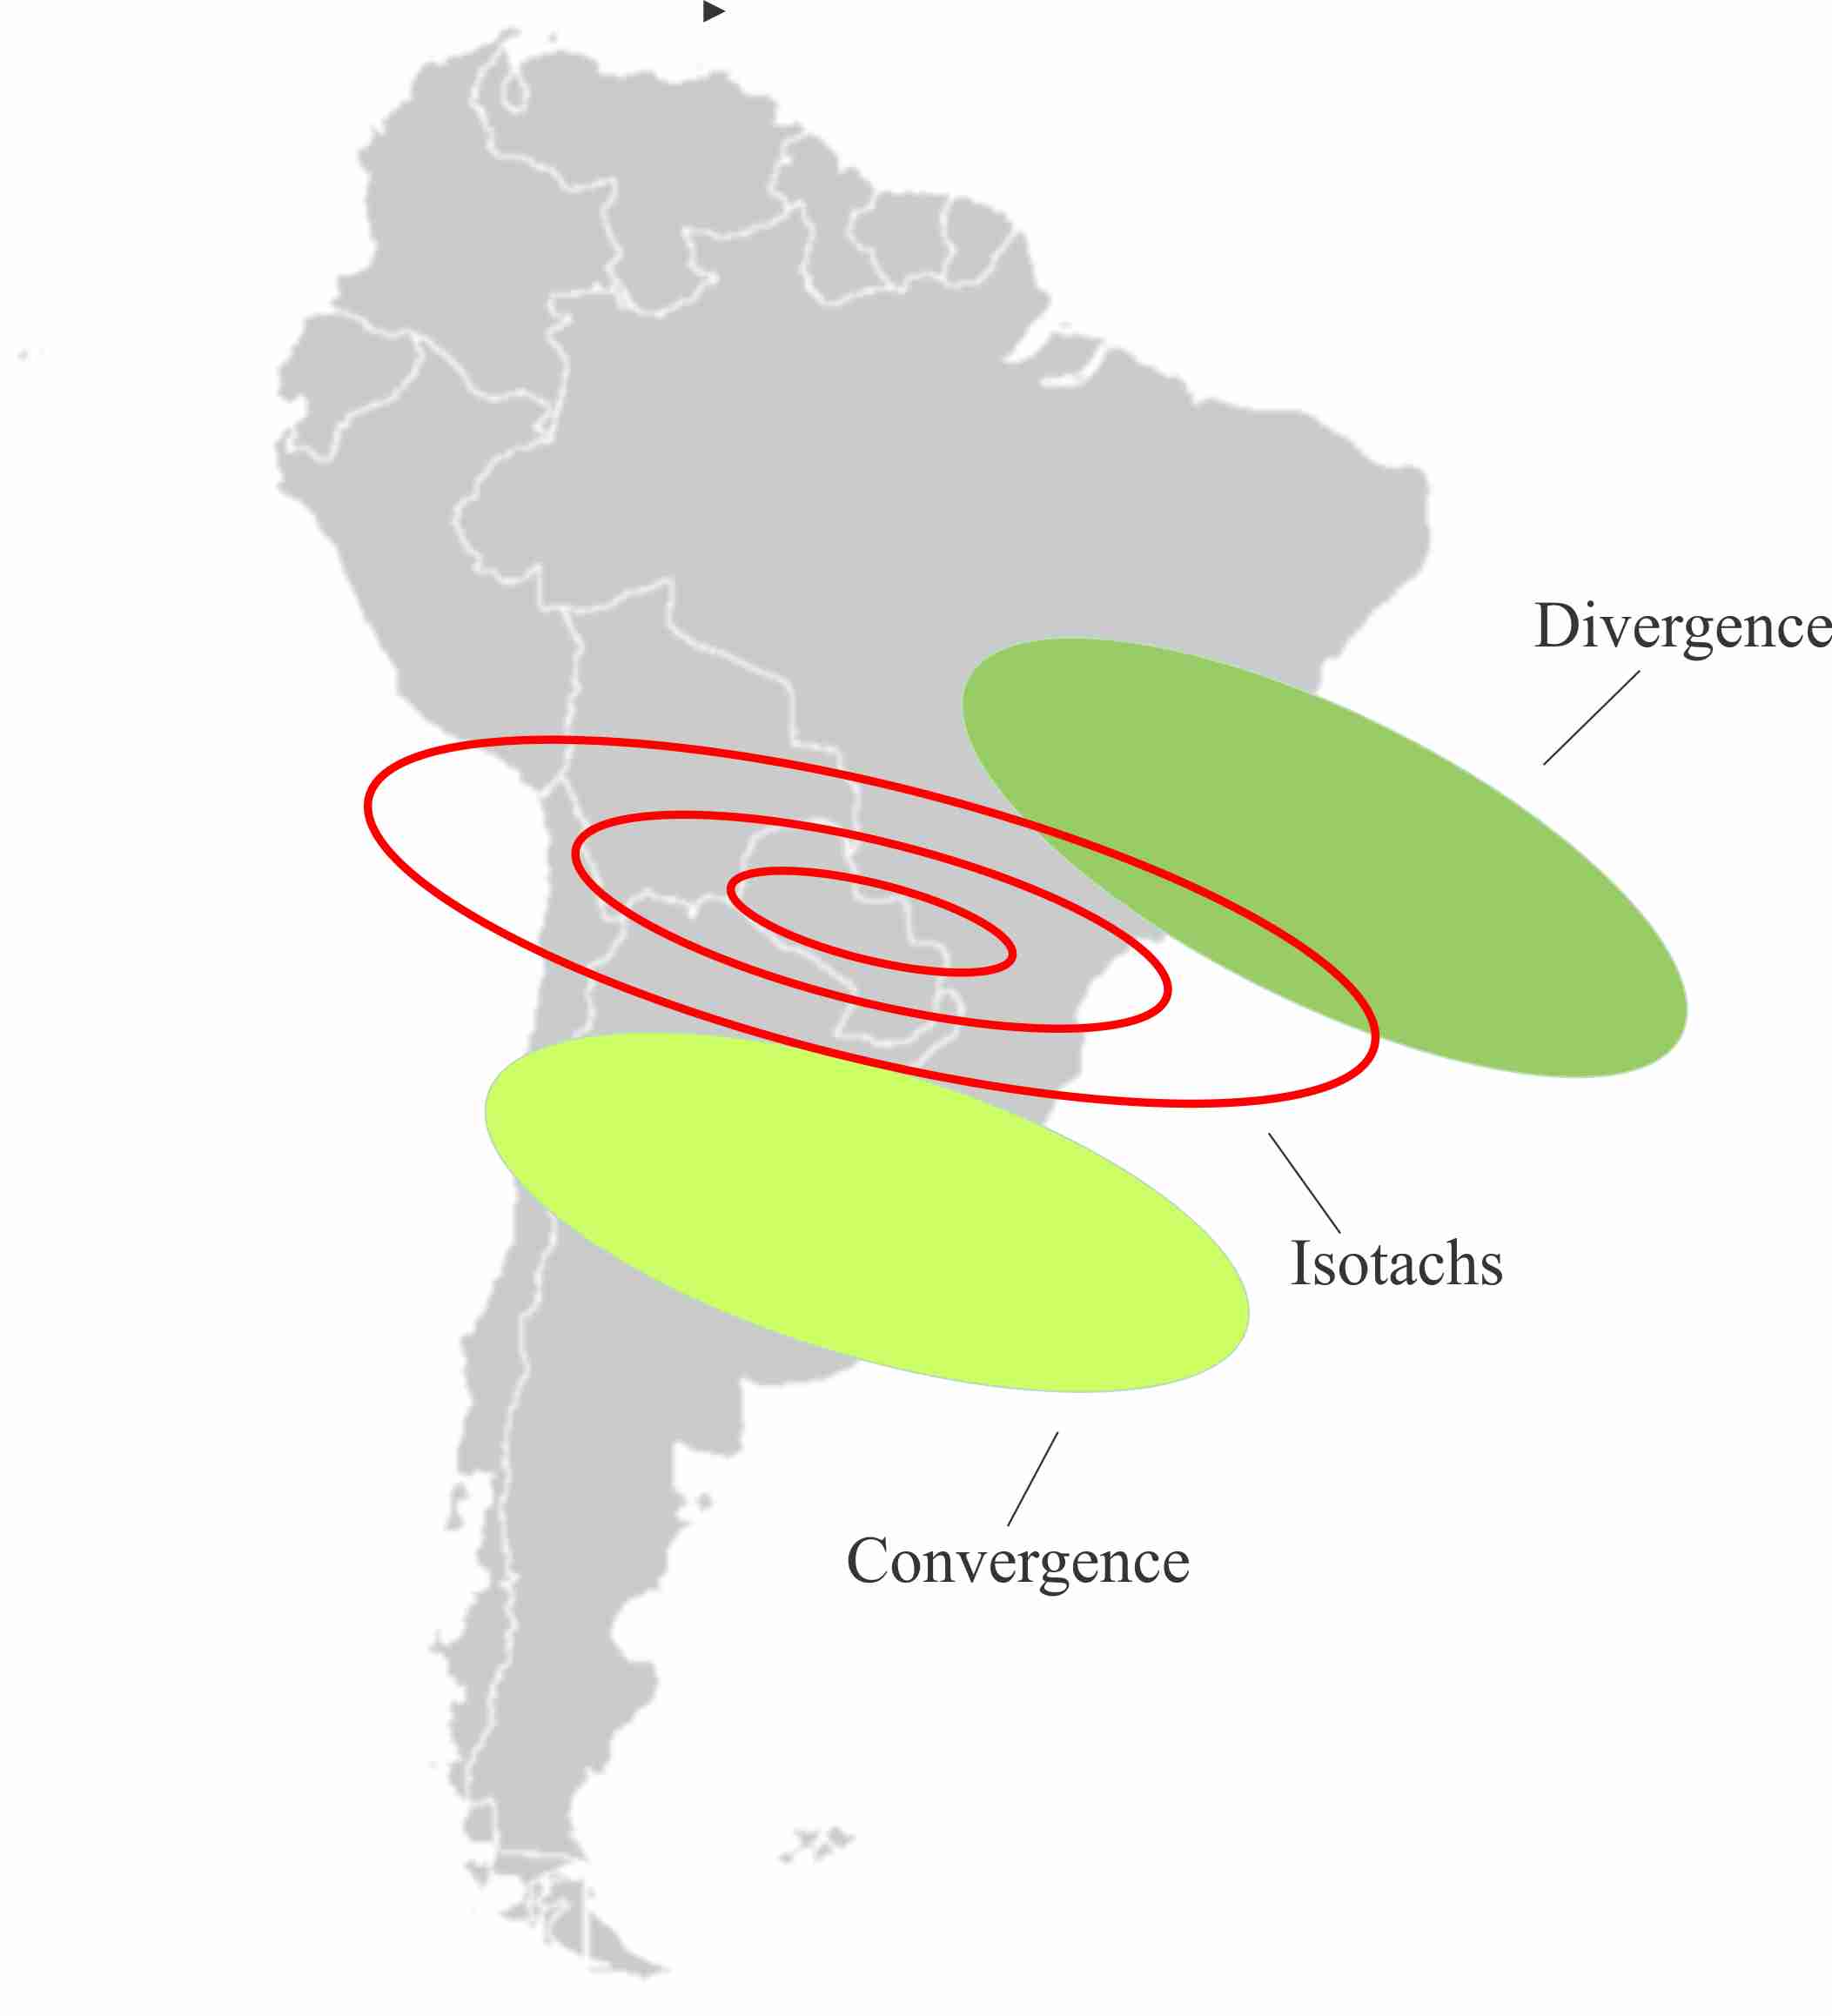
Figure 11: Schematics for Type 1 at high levels (Figure 9): isotachs of the jet stream, divergence over the location of the SACZ and convergence over south Brazil, Uruguay and Argentina.
|
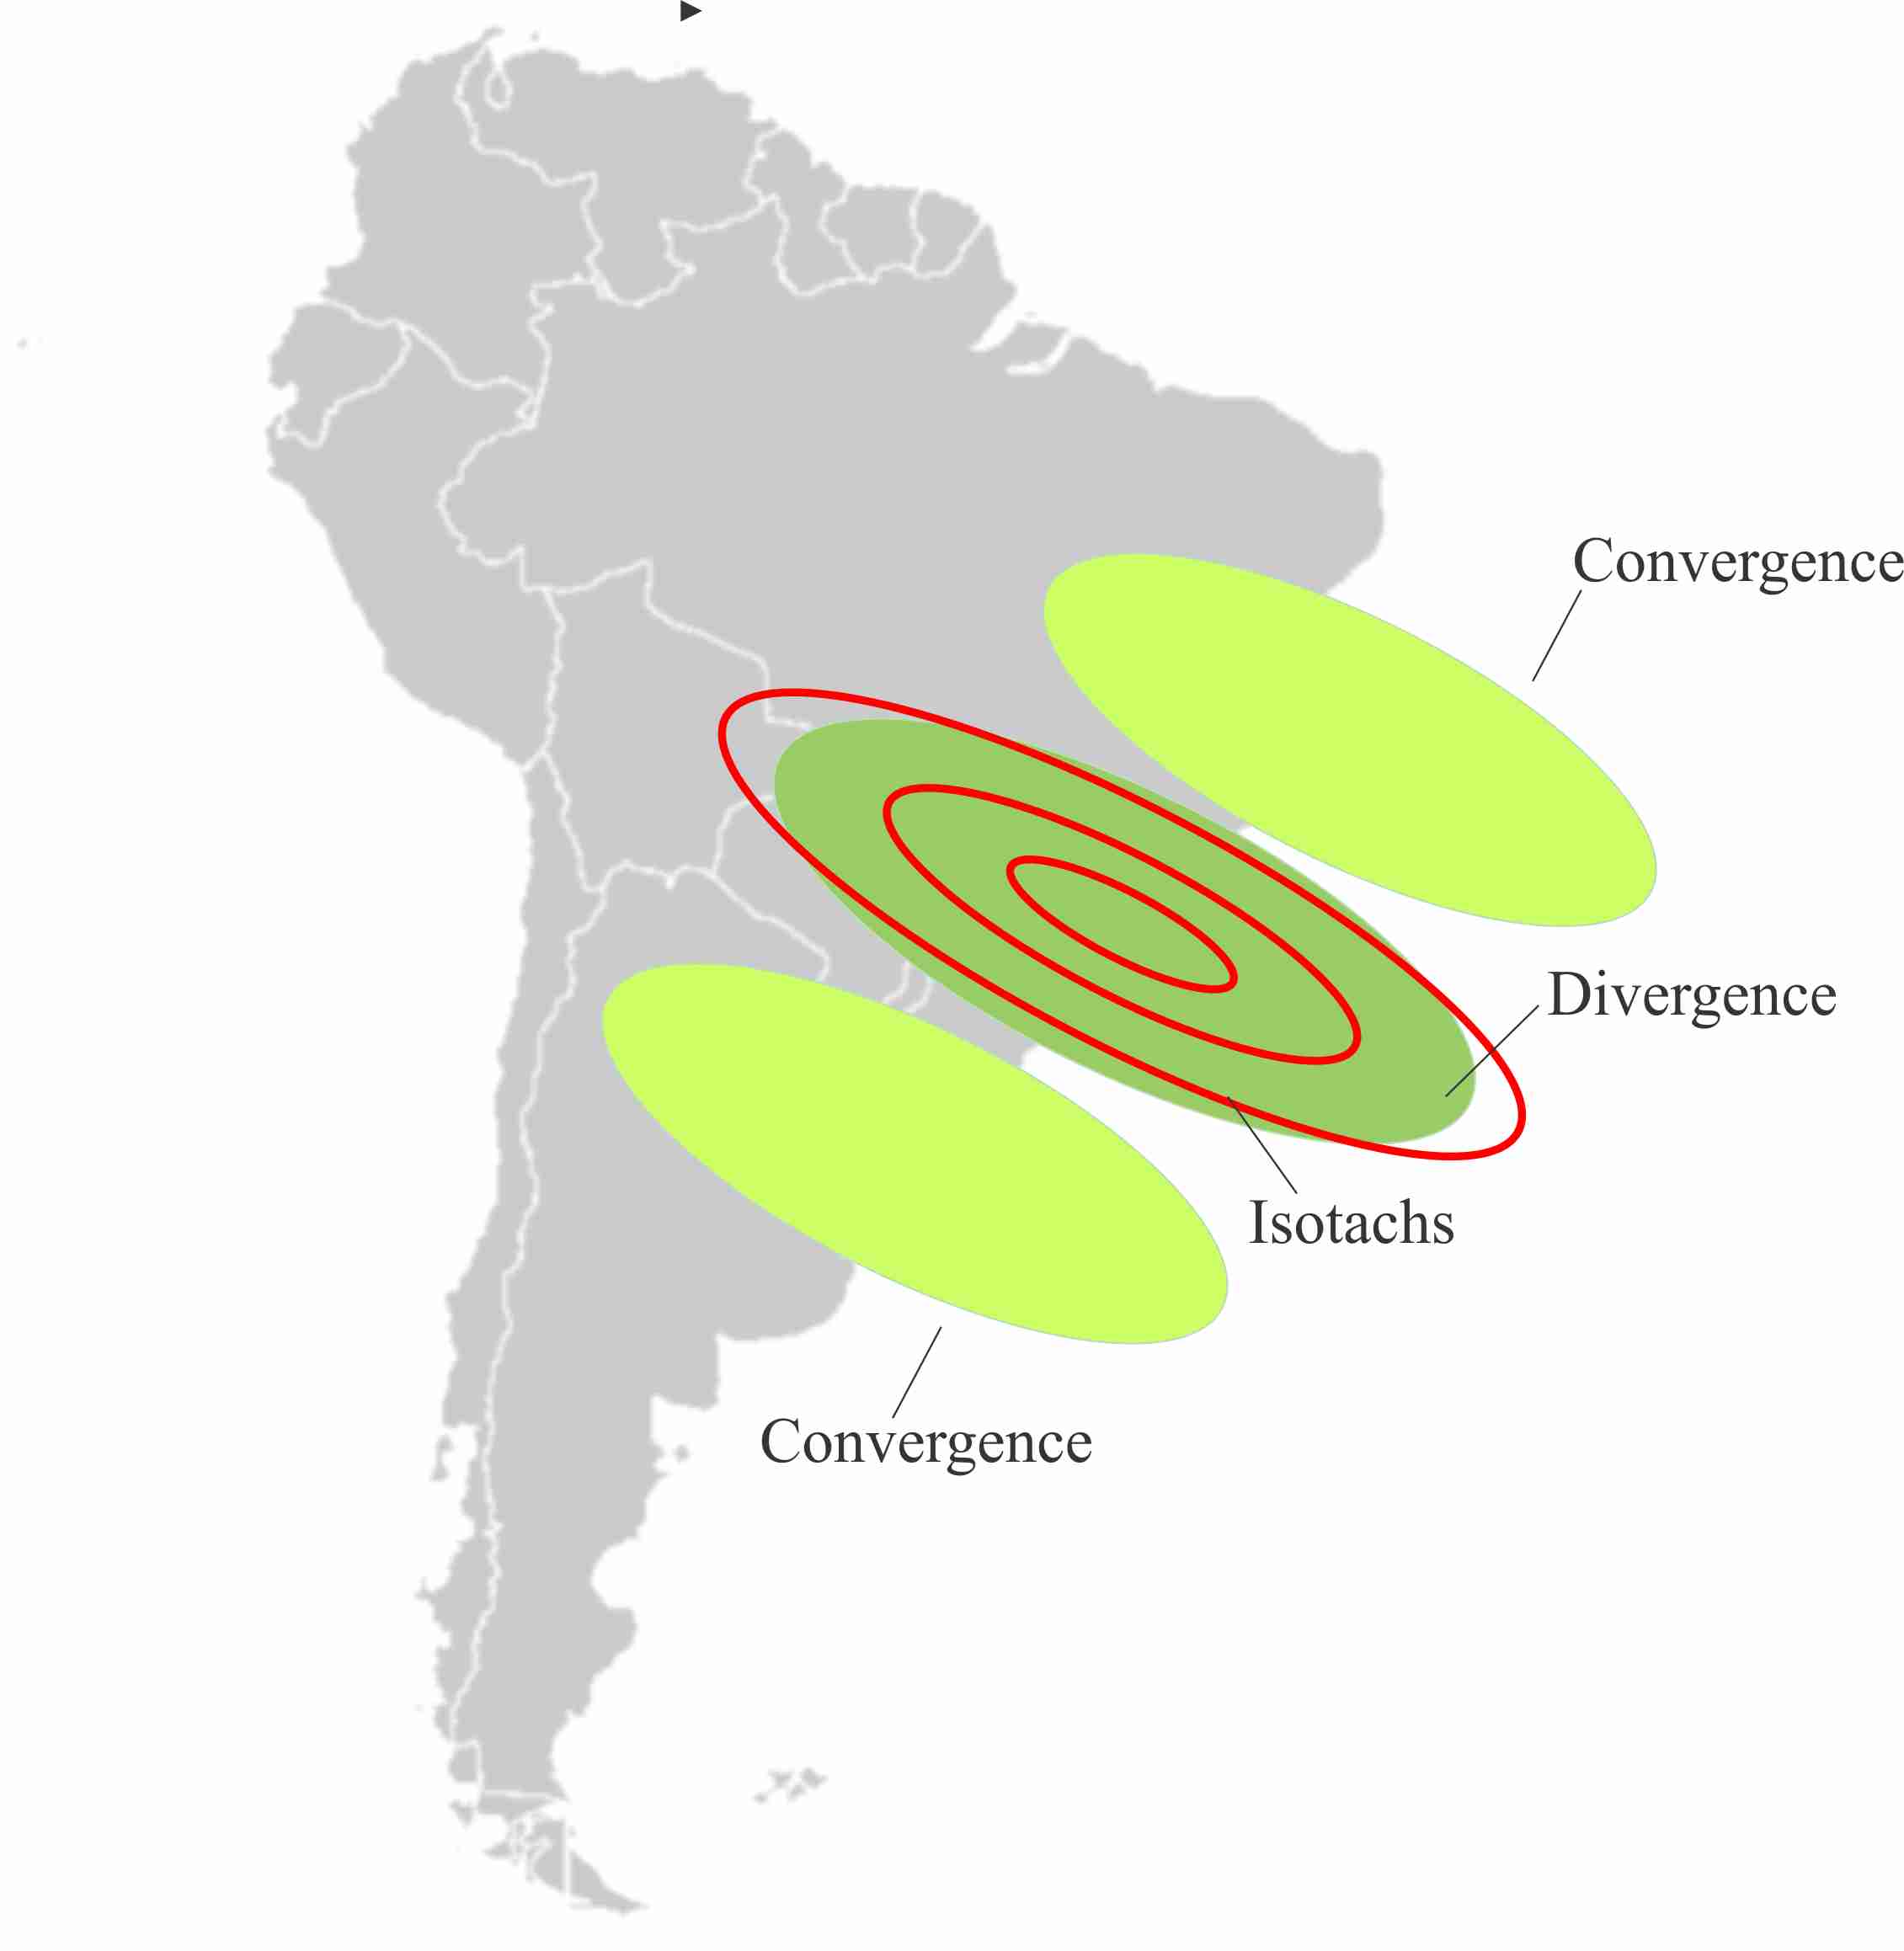
Figure 12: Schematics for Type 2 at high levels (Figure 10): isotachs of the jet stream, divergence over the location of SACZ and convergence over south Brazil, Uruguay and Argentina, and northeast Brazil.
|