Meteorological Physical Background
Introduction
The SACZ is the main source of large-scale rainfall in Brazil during the austral summer, which covers the period from November to March. Similar structures are found in the South Pacific and South Indian Ocean, though the South Indian Convergence Zone (SICZ) is not as pronounced as the others.
SACZs occur north of their mean climatological location in the first months of summer. As the summer monsoon intensifies over South America in January and February, the SACZs occurs more frequently in the south.
Observations show a clear correlation between summer floods in the southeast and dry spells in the southern parts of the SACZ. In cases where the SACZ persists for an extended period in the southeast, extremely rainy periods coincide with Indian summers in southeastern Brazil.
SACZs are generated and maintained primarily by the interaction of tropical convection with the frontal systems of subtropical South Atlantic monsoons. These SACZs have an average life cycle of eight to ten days. The fluctuation and duration of SACZs also depends on intraseasonal oscillations on time scales of 20-30 days and 30-60 days.
Broad Overview
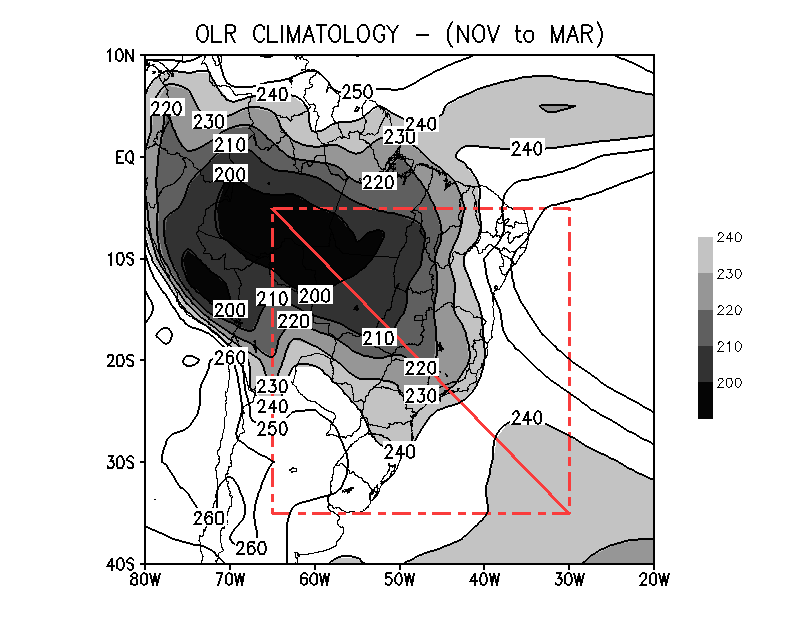
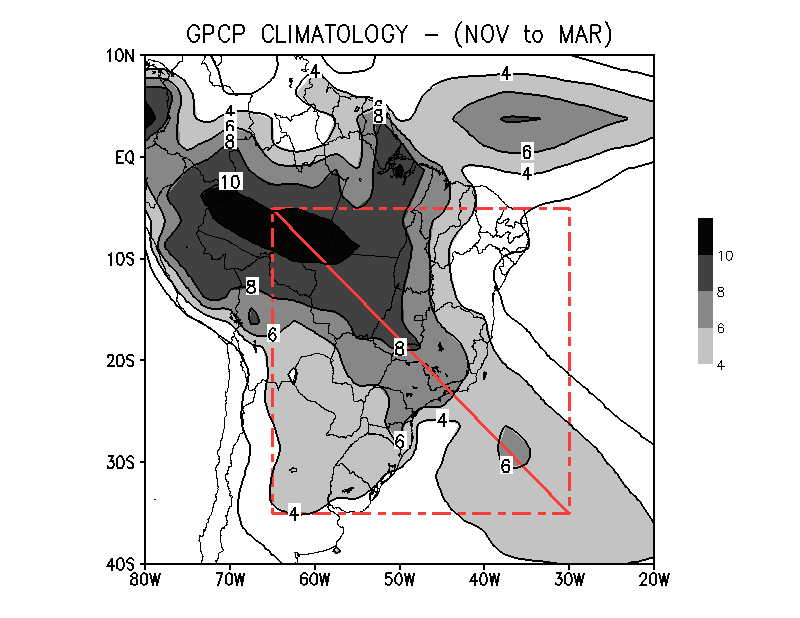
Climatological maps of average outgoing longwave radiation (OLR) and the amount of precipitation in the austral summer months (November to March) from 1982 to 2011 are presented in Figures 1 and 2.
The OLR field is based on ERA INTERIM reanalysis and precipitation data provided by GPCP (Global Precipitation Climatology Project). The location of the convergence zone typically falls inside the red box. The red line shows the mean climatological position of SACZs.
Low longwave radiation values (usually below 220 W/m2) mean cold areas. They may be caused by high clouds (in the tropics) or cold surfaces (in the middle and high latitudes). The location of low OLR values coincides with the highest amounts of precipitation. The precipitation is concentrated in three regions: 1) northern region within the Intertropical Convergence Zone (ITCZ); 2) from the Amazonas Region to southeastern Brazil and 3) subtropical South Atlantic Ocean. The latter two are caused by SACZ.
|
|
|
Figure 1: Average Monthly Climitology of Outgoing Longwave Radiation (OLR - W/m2) from November to March (1982 to 2011)
|
Figure 2: Precipitation (mm) GPCP Climatology, from November to March (1982 to 2011)
|
|
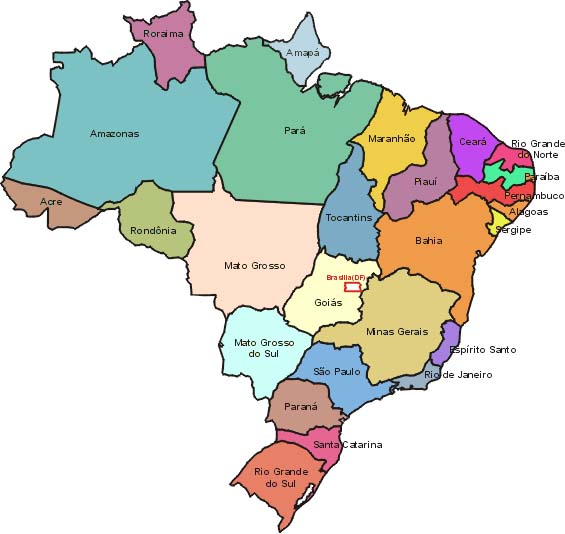
Division of Brazilian States |
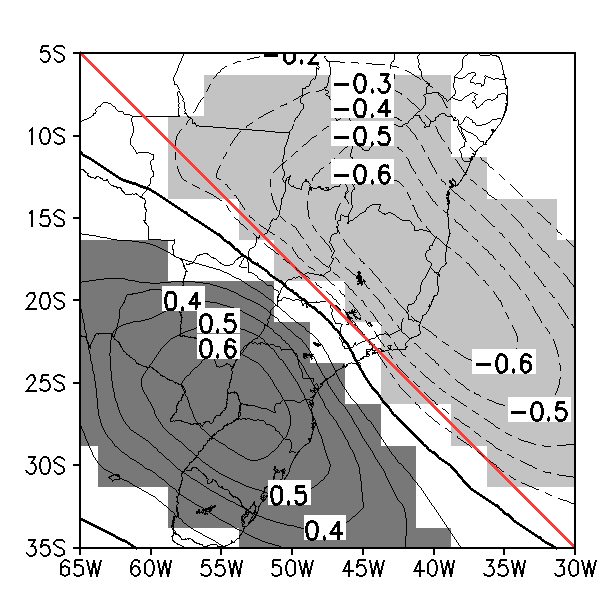
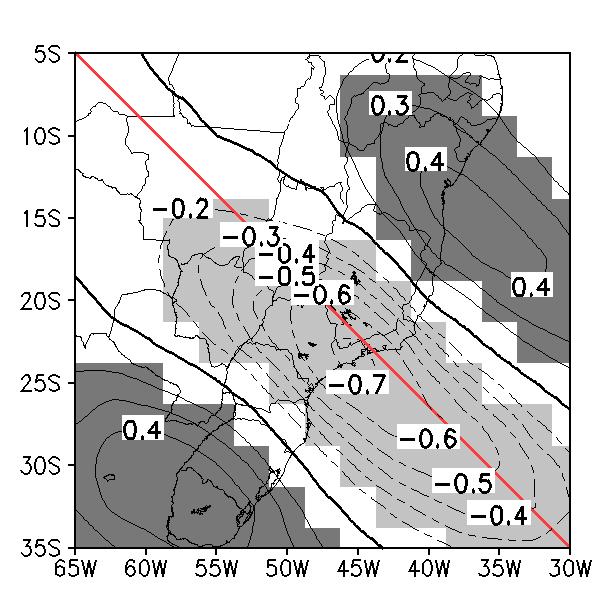
Empirical orthogonal functions (EOF) are used to study the spatial and temporal variations of SACZ. Figure 3 shows the the correlation between the first component of EOF analysis and the OLR anomaly (Type 1), and Figure 4 the correlation between the second component of EOF analysis and the OLR anomaly (Type 2). They reveal a range of variability of around 50%.
Deep clouds within SACZ have negative correlation values. In Figure 3, the highest negative values are located in Espírito Santo and north of Minas Gerais, while in Figure 4 they are located on the border of the states of São Paulo and Rio de Janeiro and south of Minas Gerais. The positive correlation values coincide with strong OLR anomalies, which can result from lack of convection. Note that in Figure 3 there is one maximum for both positive and negative values, while Figure 4 has one maximum of negative values but two maxima of positive values. These will be shown in the case studies below.
|
|
|
Figure 3: Correlation pattern between the OLR anomaly and the first component of EOF analysis.
|
Figure 4: Correlation pattern between the OLR anomaly and the second component of EOF analysis.
|
Type 1: 27 December 2010 at 18:15 UTC
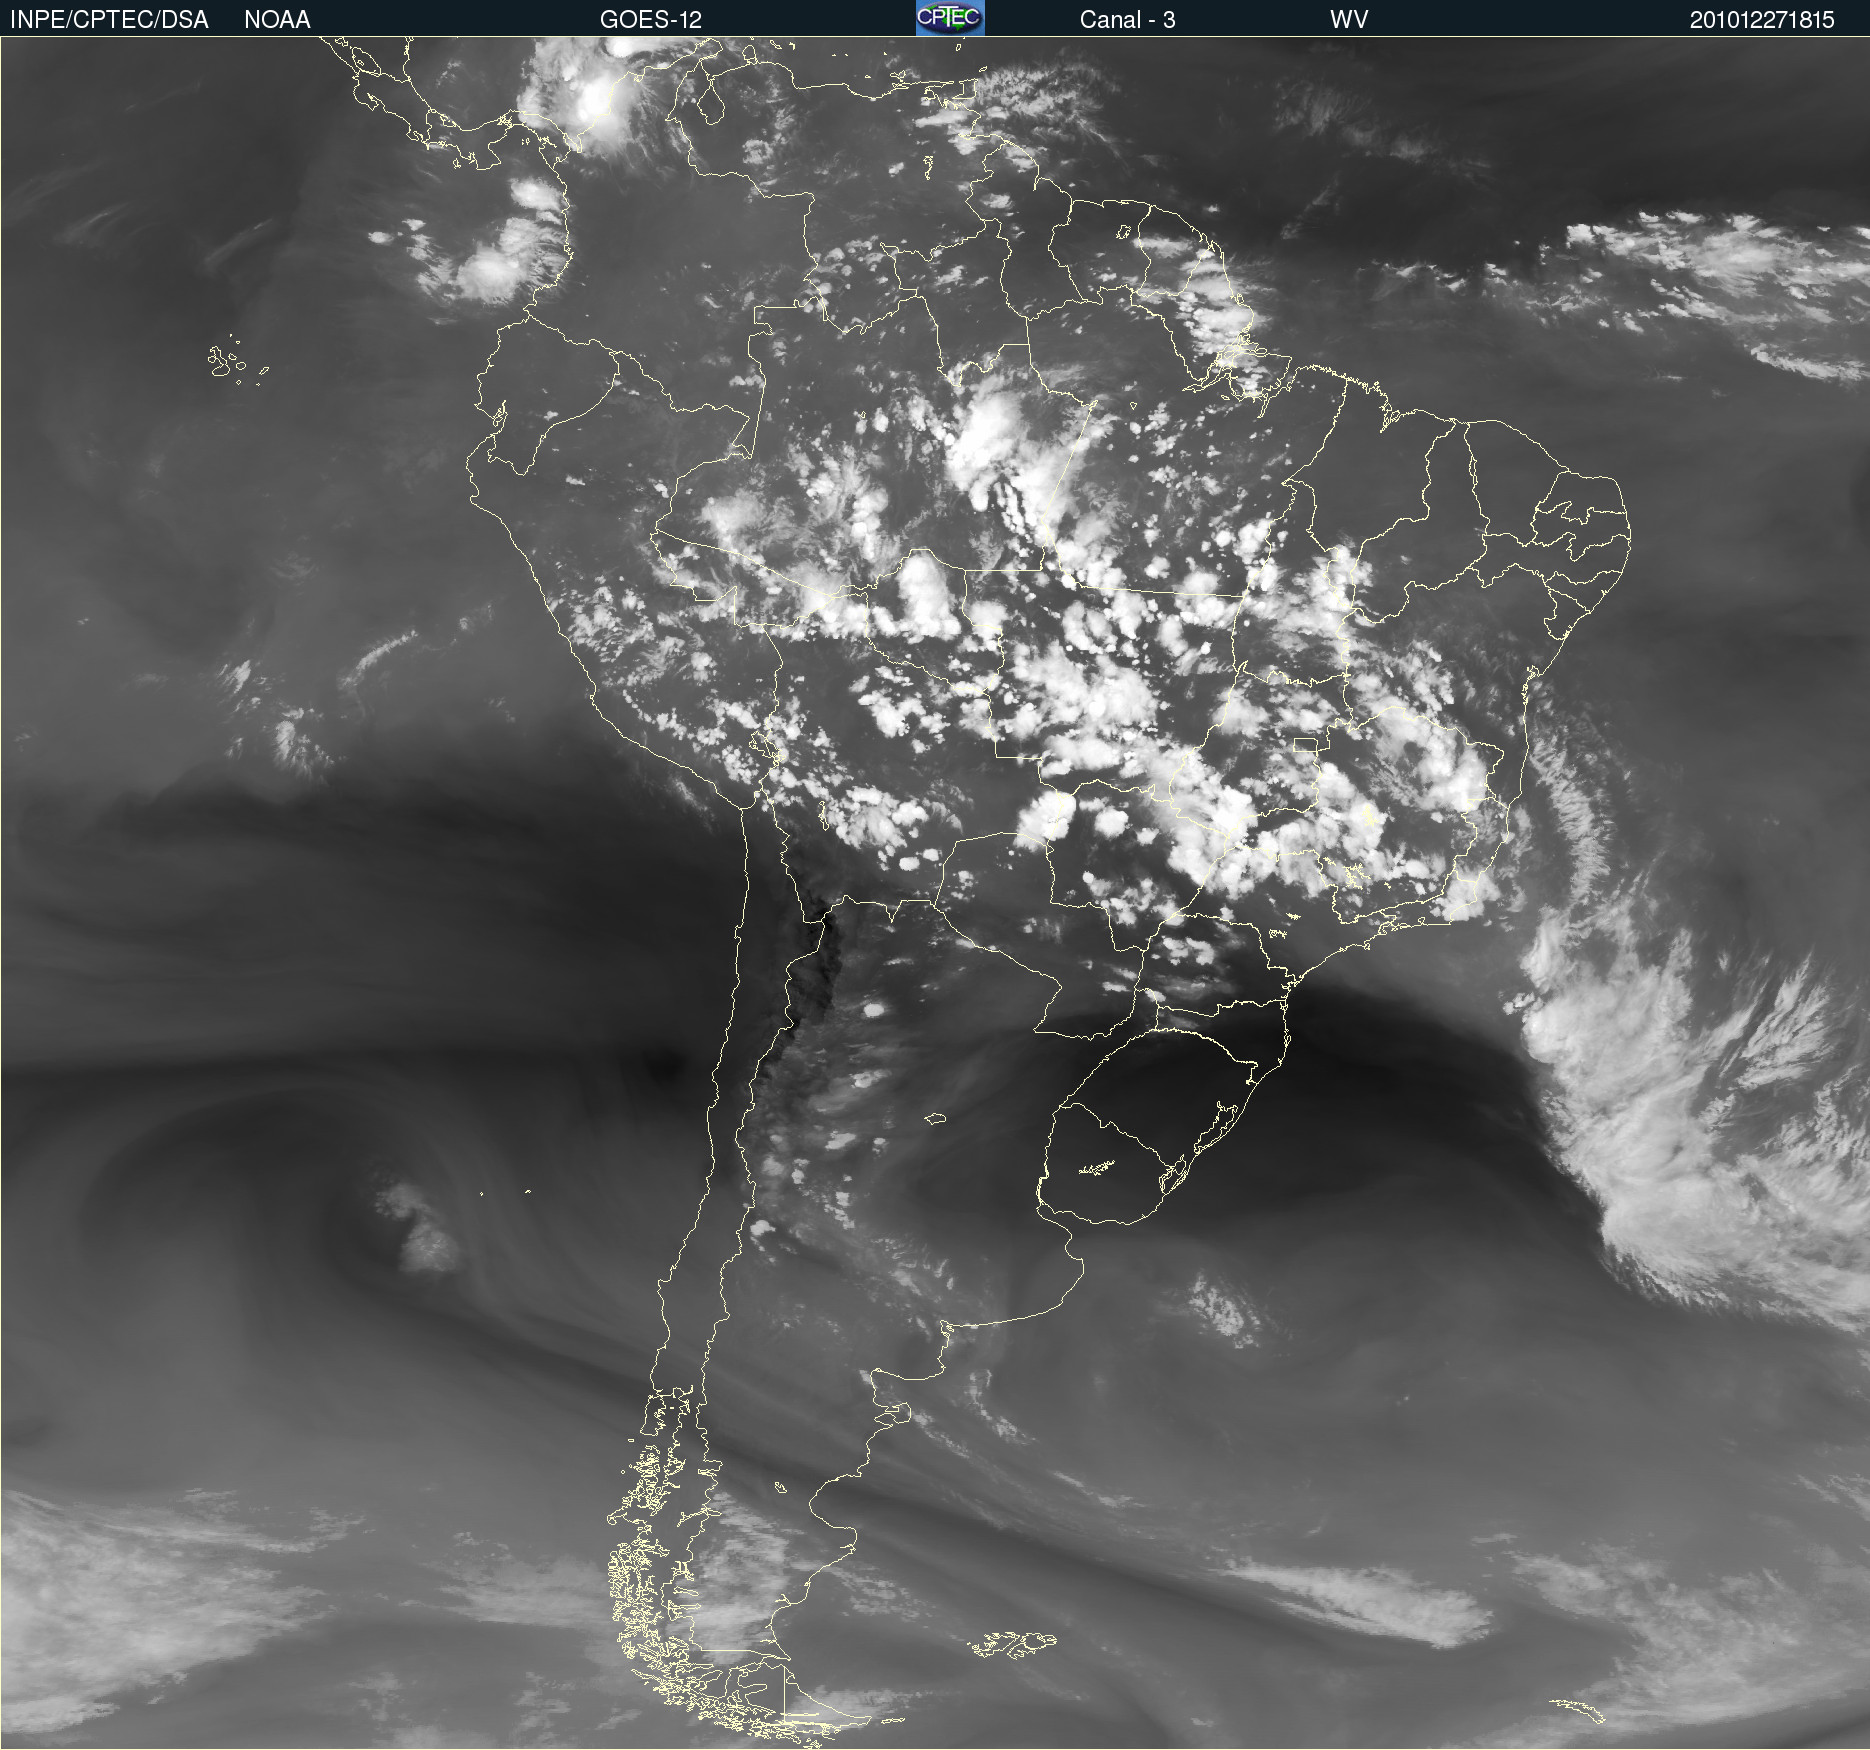
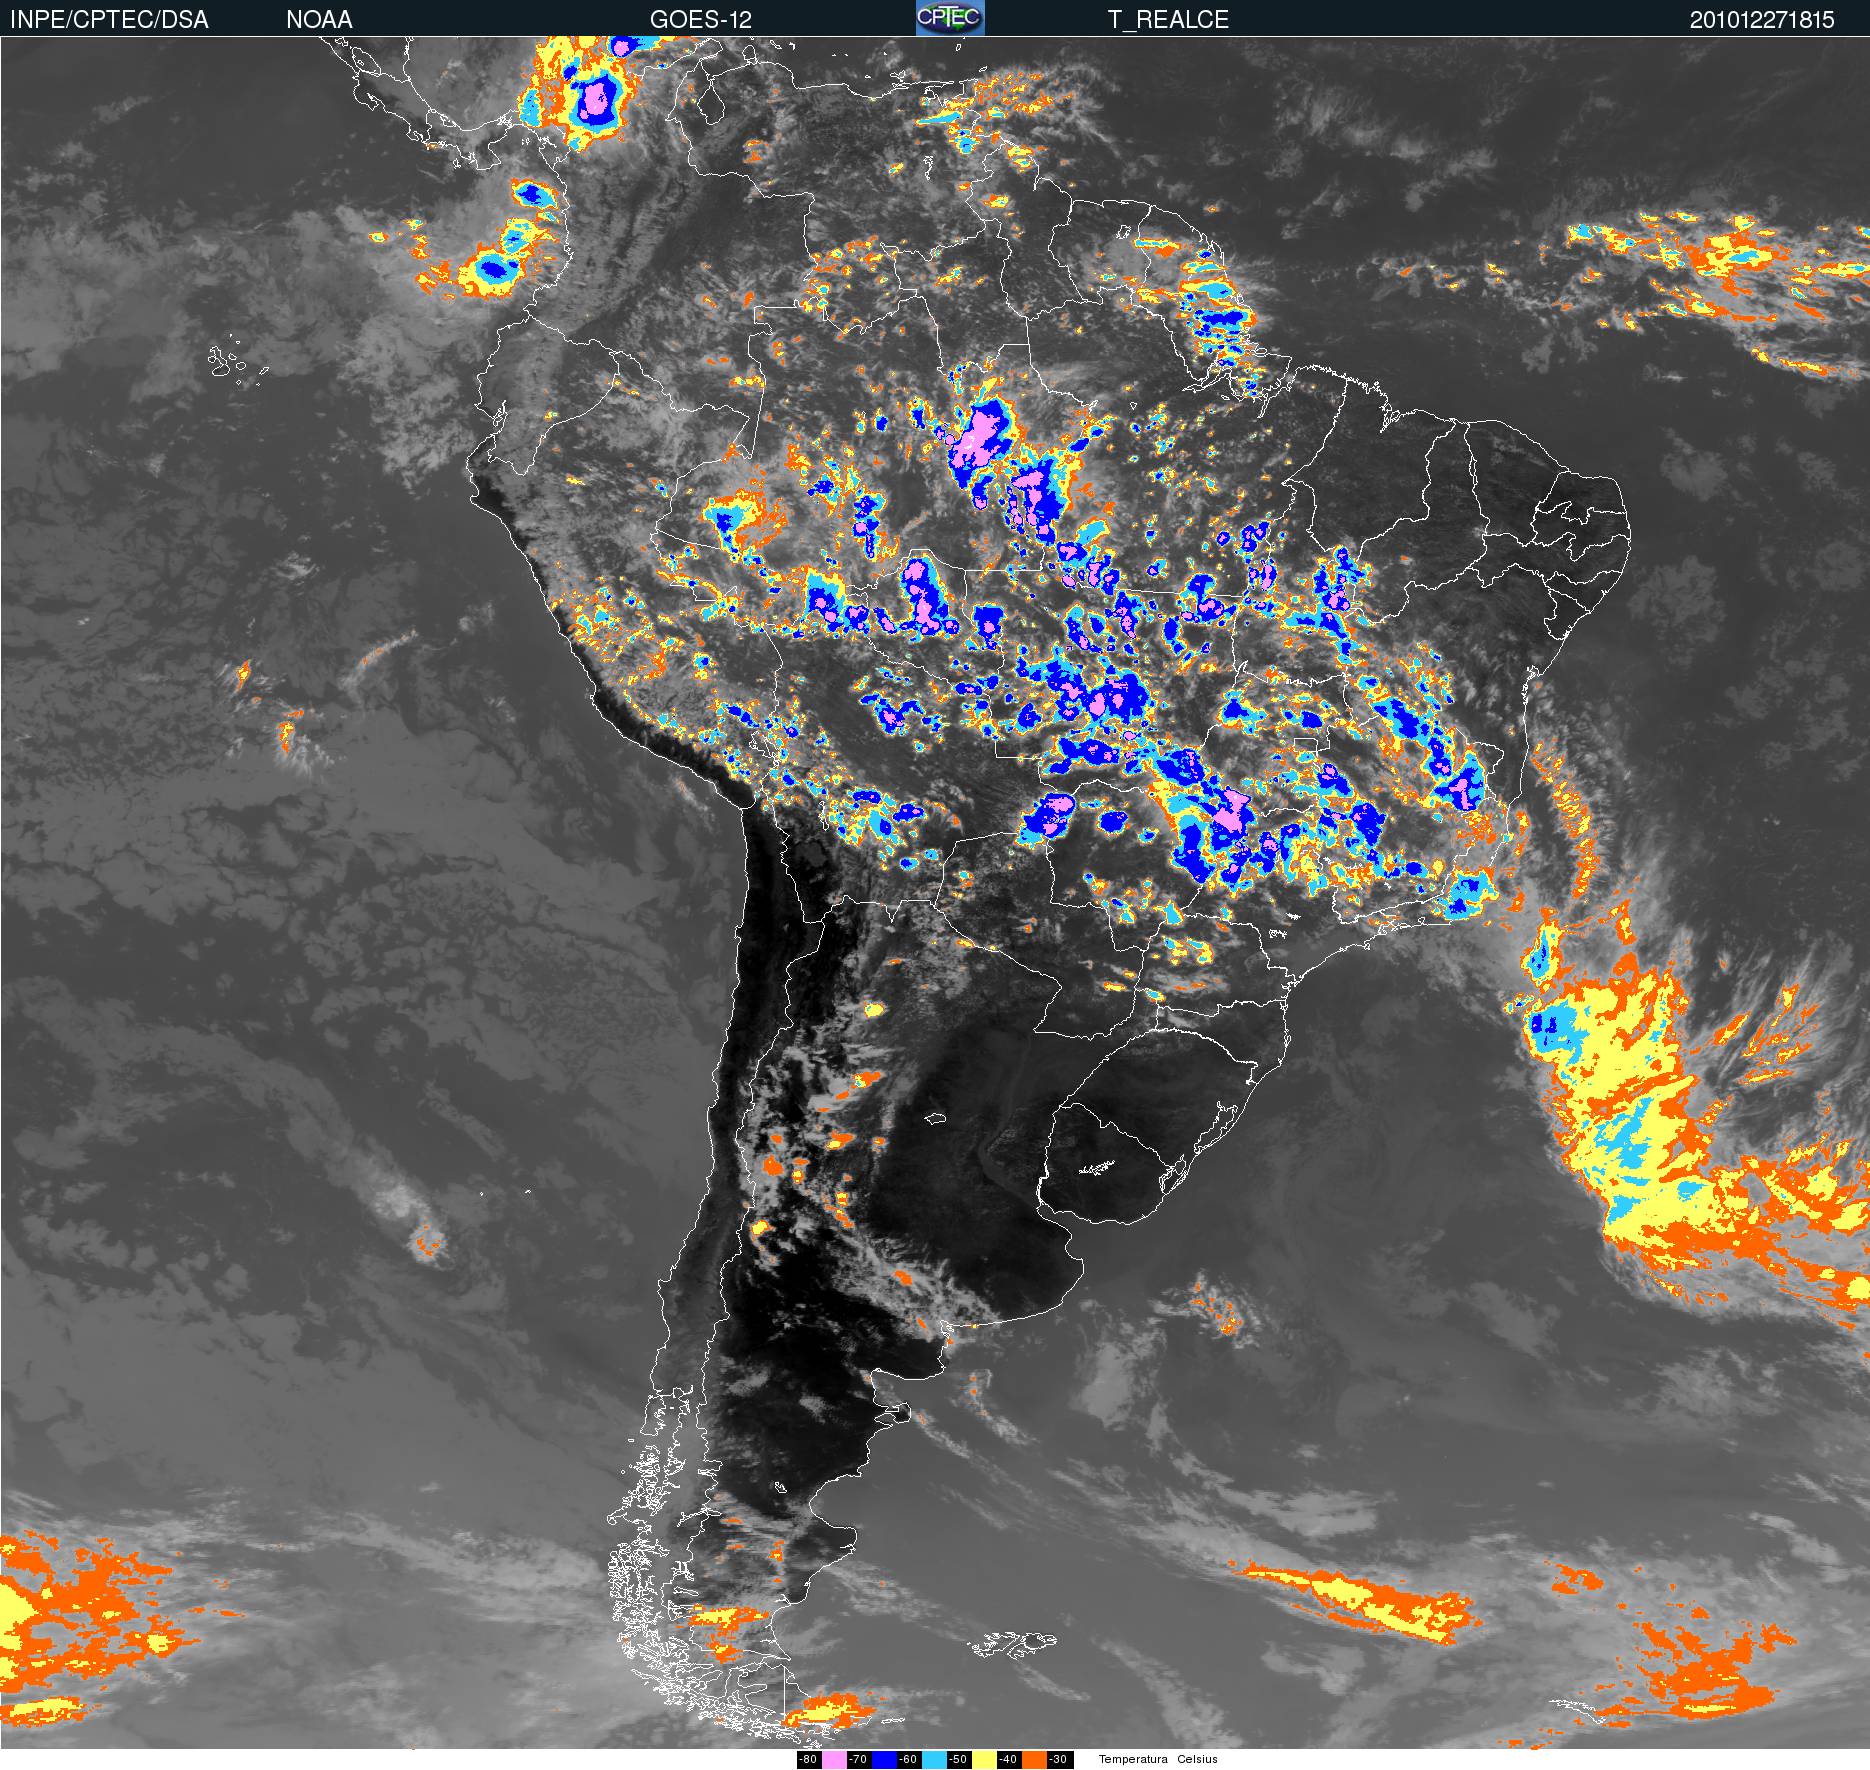
The SACZ reaches from Espírito Santo and north of Minas Gerais to western Amazonia. It is situated slightly to the north of the mean climatological location. The dry air within a high in southern Brazil, eastern Argentina and Uruguay can be detected in WV and IR images (Figures 5 and 6). This pattern is quite similar to the dipole pattern associated with type 1 in Figure 3, which suggests that the statistical analysis has a strong connection with the meteorological physical background.
|
|
|
Figure 5: GOES 12 - WV channel for 27 December 2010 at 18:15 UTC
|
Figure 6: GOES 12 - IR enhanced for 27 December 2010 at 18:15 UTC
|
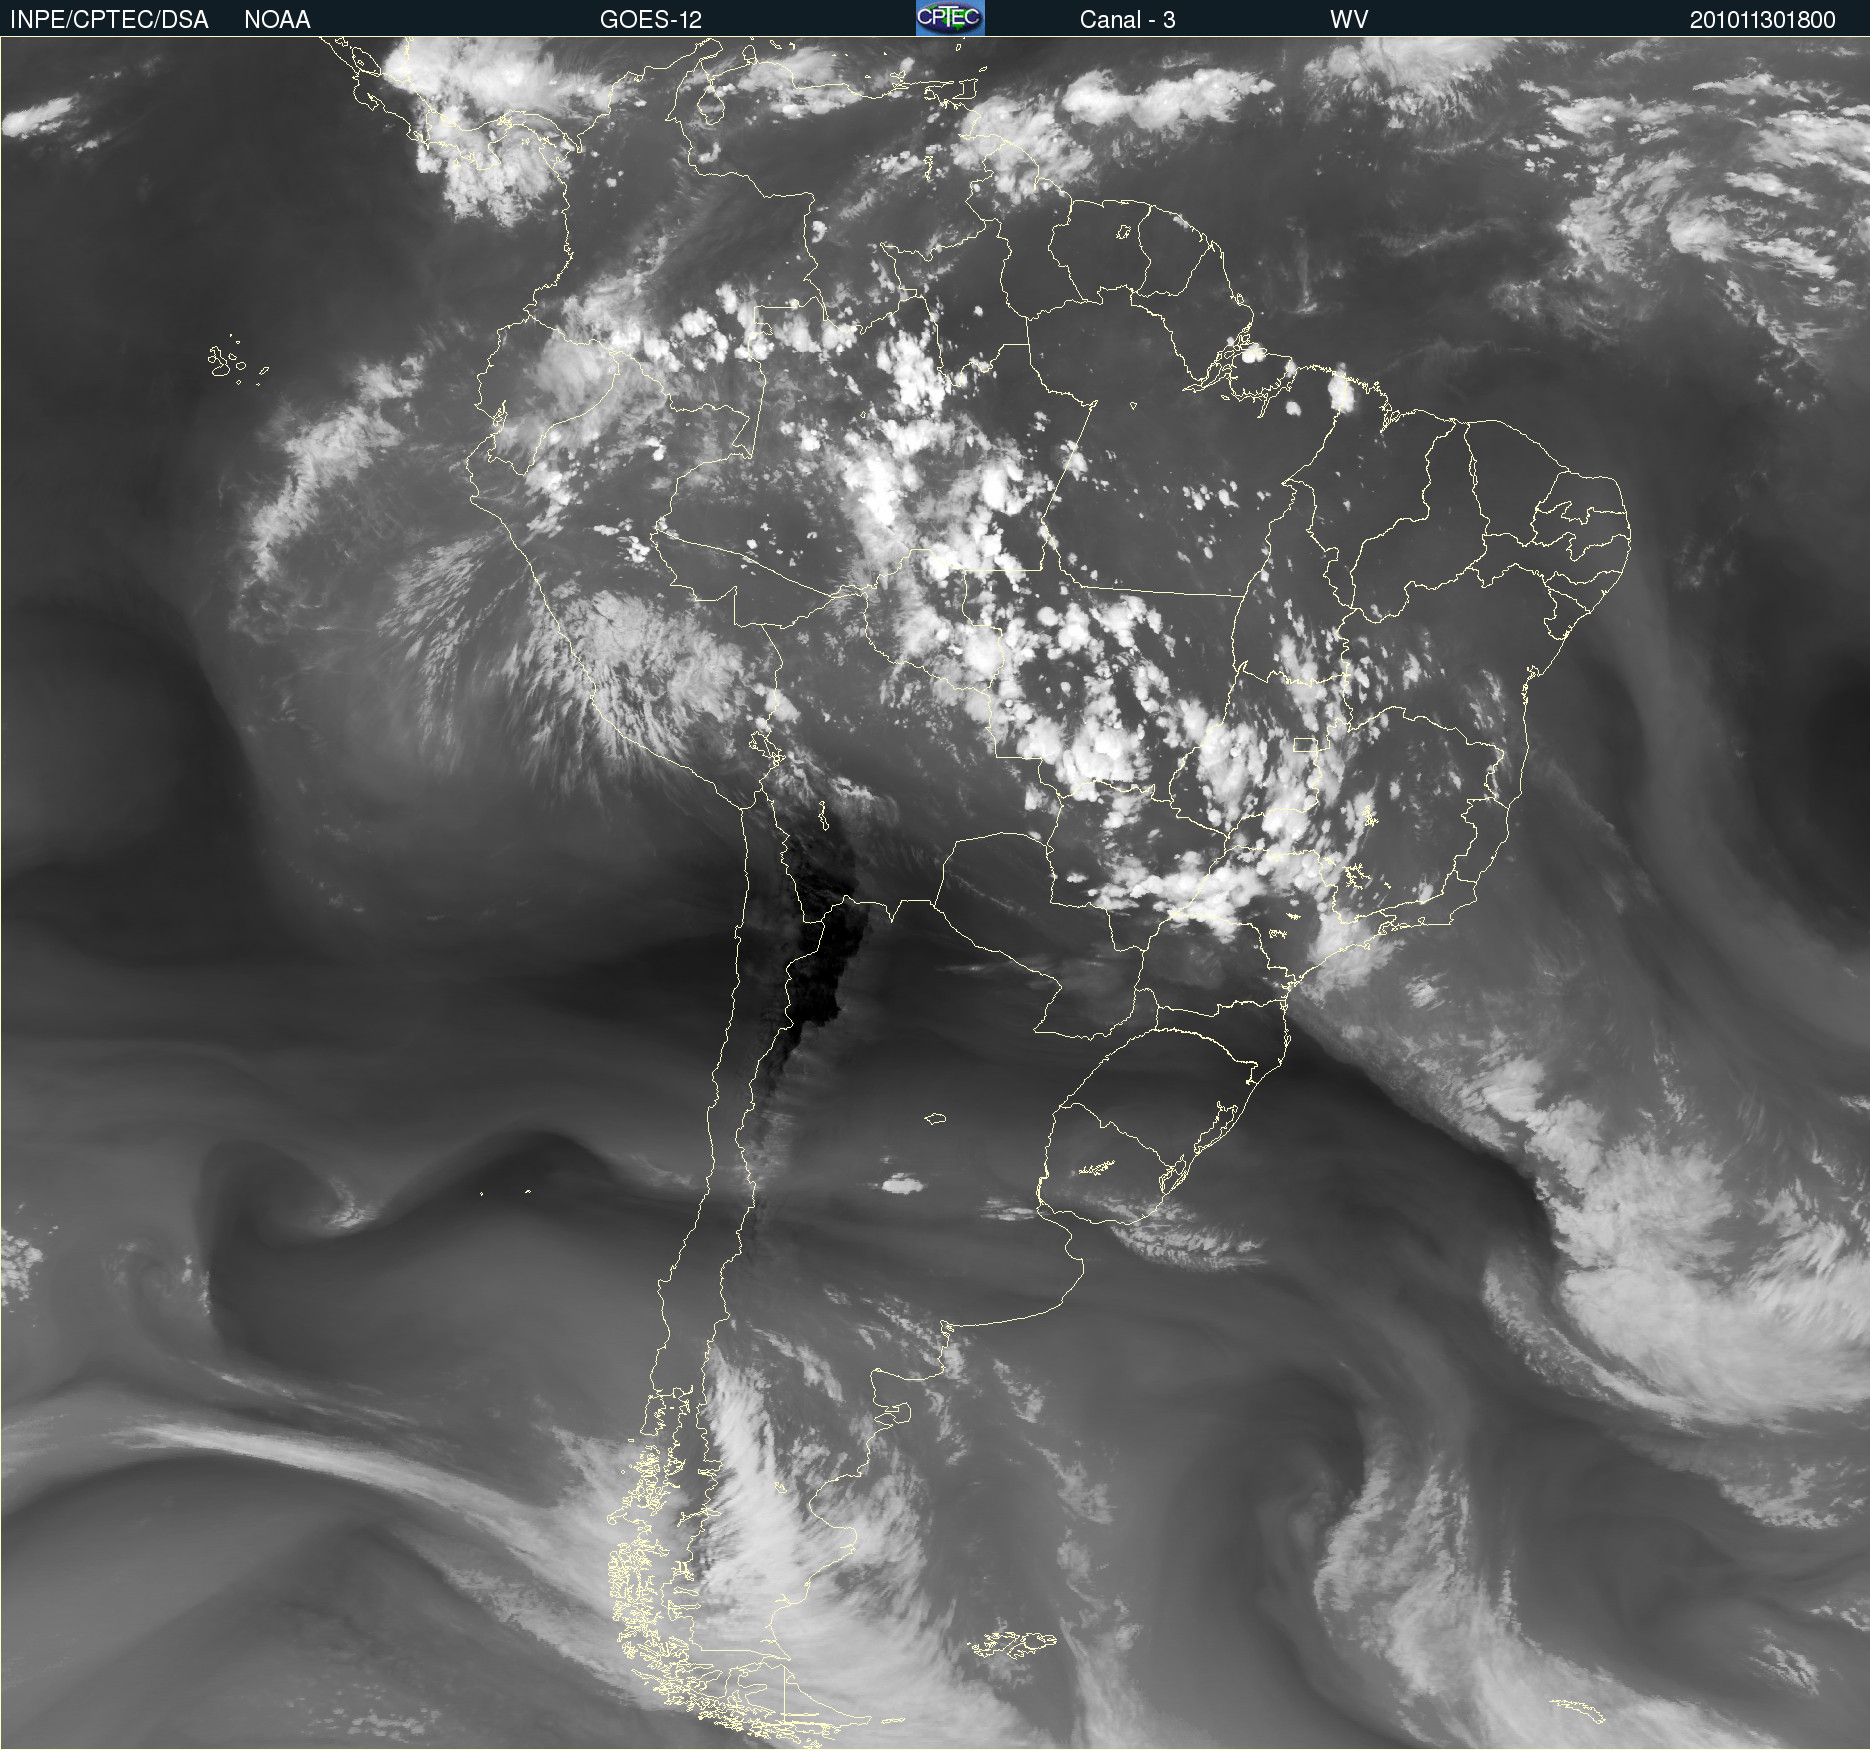
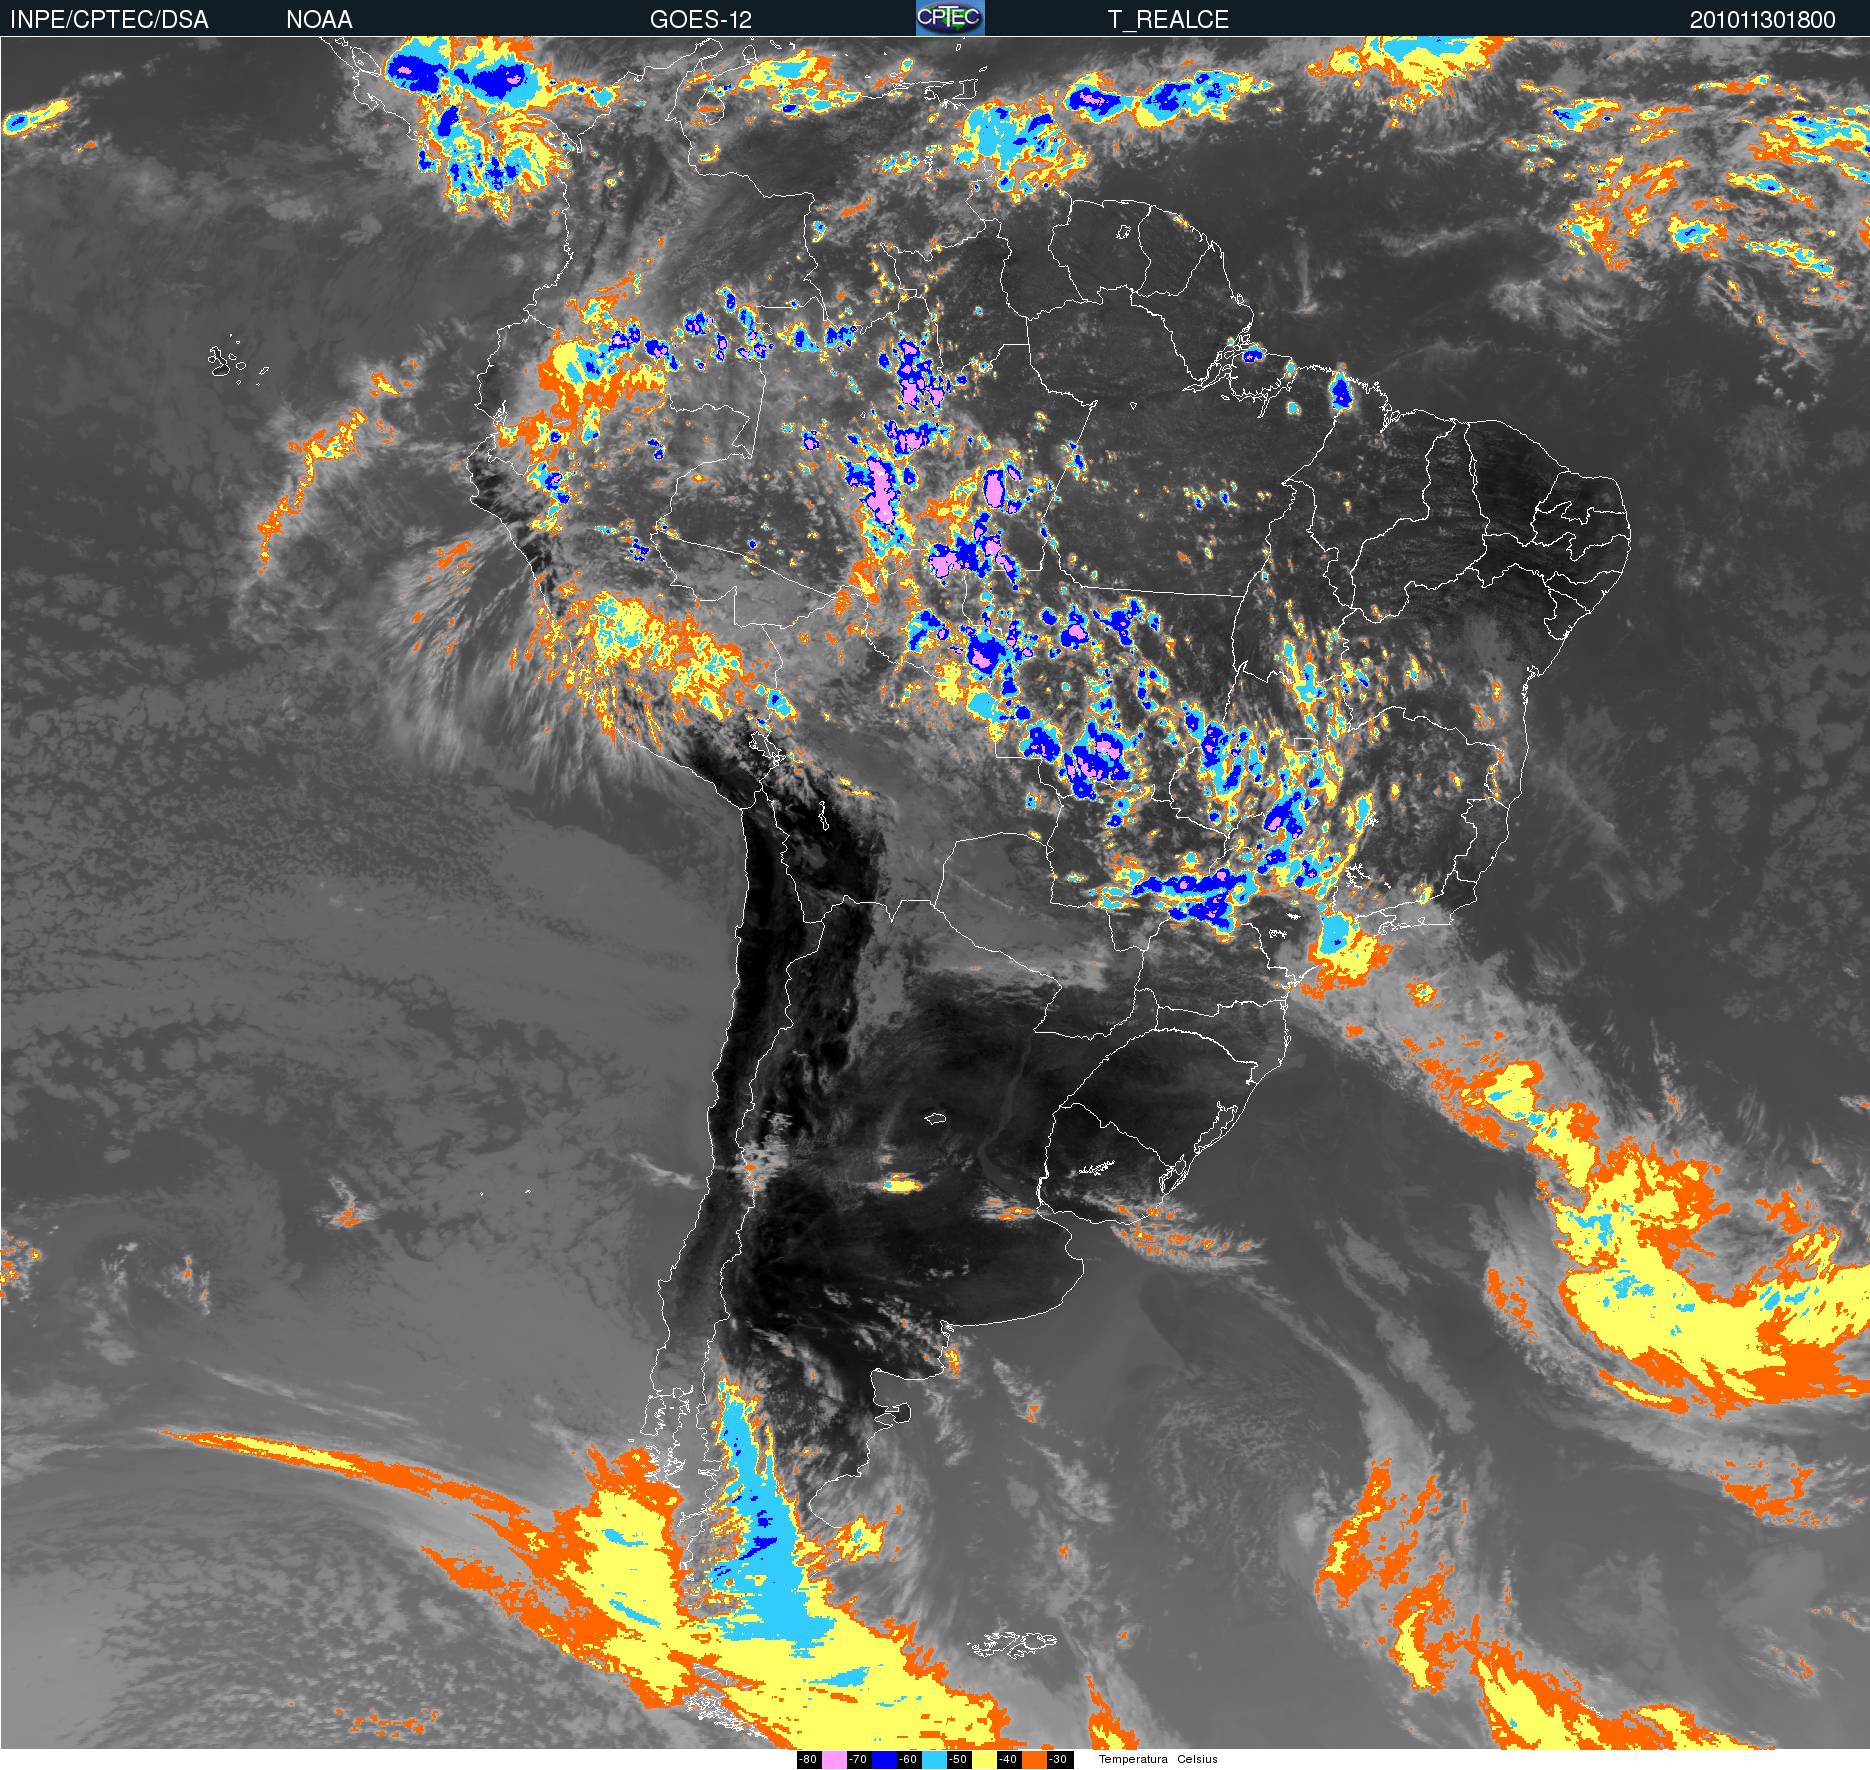
Type 2: 30 November 2010 at 18:00 UTC
The SACZ stretches from the states of São Paulo and Rio de Janeiro toward western Amazonia. In this case, the SACZ is close to its mean climatological location (figure 2), unlike in the previous case (27 December 2010 at 18:15 UTC). In this case, the convection is restricted to a narrow cloud band. There are two highs, one in southern and the other in northeastern Brazil, which is compatible with the tripole structure.
|
|
|
Figure 7: GOES 12 - WV channel for 30 November 2010 at 18:00 UTC
|
Figure 8: GOES 12 - IR enhanced for 30 November 2010 at 18:00 UTC
|