Table of Contents
Cloud Structure In Satellite Images
Introduction
The South Atlantic Convergence Zone (SACZ) is a large cloud system that forms in subtropical South America and in the western South Atlantic Ocean in the summer. It can be seen on climatological maps showing the average outgoing longwave radiation (OLR) and precipitation. Cold cloud tops have the lowest OLR in satellite images (white in VIS, IR and WV channels).
Description
The main features observed in satellite imagery are the following:
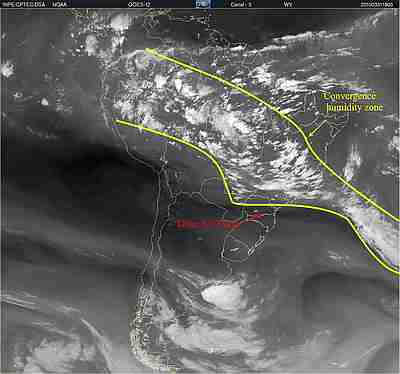
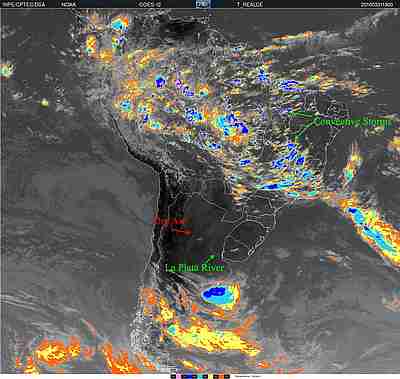
- An elongated zone of clouds, precipitation, and convergent winds with a northwest-southeast orientation across southeastern Brazil to the southwestern Atlantic Ocean. It can be seen on the VIS, IR and WV-channels.
- The WV channel shows deep clouds over Brazil from the western Amazonian region to the state of Rio de Janeiro, while there is drier air in Argentina and southern Brazil.
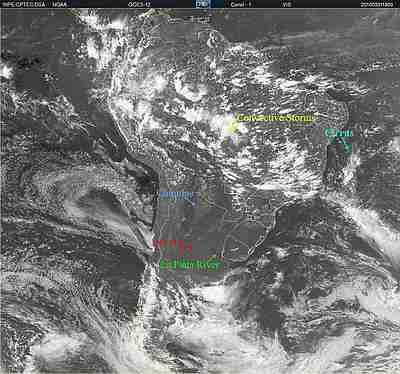
- Northeastern Brazil and Argentina and southern Brazil have clear skies or small cumulus clouds, as seen in the VIS image.
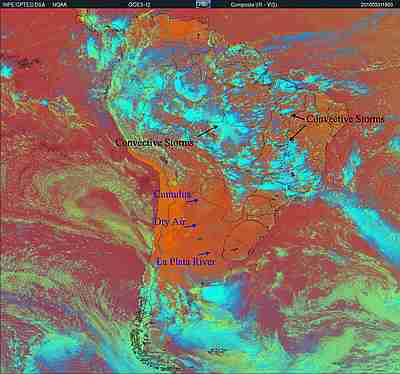
- The combination of IR and VIS channels emphasizes the deep convection within the SACZ (bluish colors) while the orange and red hues represent clear skies around it.
|
Figure 1: 31 March, 2010 - 1800UTC GOES-12 - Channel 3- WV
|
Figure 2: 31 March, 2010 - 1800UTC GOES-12 - Channel 1- Visible
|
|
Figure 3: 31 March, 2010 - 1800UTC GOES-12 - Channel 4- IR Enhanced
|
Figure 4: 31 March, 2010 - 1800UTC GOES-12 - VIS Channel + IR Enhance - Blurish colors indicate deep convection and orange and reddish colors represent clear sky condition.
|
The channels from GOES Imager are presented in the table below:
| Channel number | Wavelength range (µm) | Range of measurement | Meteorological objective |
|---|---|---|---|
| 1 | 0.52 to 0.71 | 0 to 100% albedo | Cloud cover |
| 2 | 3.73 to 4.07 | 4 to 335K | Nighttime clouds |
| 3 | 13.00 to 13.70 | 4 to 320K | Cloud cover and height |
| 4 | 10.20 to 11.20 | 4 to 320K | Sea surface temperature and water vapor |
| 5 | 5.80 to 7.30 | 4 to 320K | Water Vapor |
Typical austral summer circulations within the SACZ:
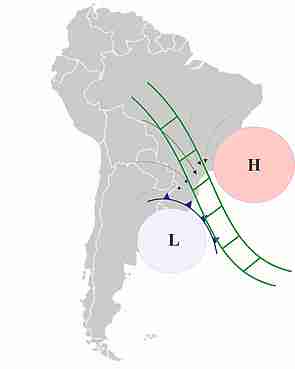
Low levels: Northerly-northwesterly flow transports moisture from the Amazon region to the central and southeastern parts of Brazil.
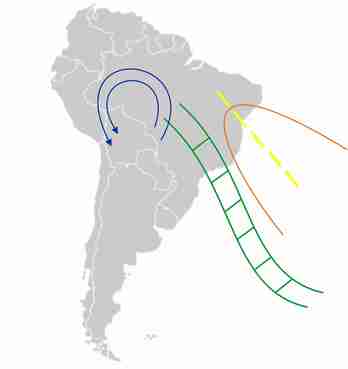
High levels: Anticyclonic circulation (Bolivian high) and a quasi-stationary trough over northeastern Brazil.
|
Typical positions of the SACZ (green) and the quasi-stationary surface frontal system (the low and the cold front), and convergence of low-level winds.
|
Typical configuration at high levels: an anticyclonic circulation (Bolivian high - blue lines) over northwestern South America and a trough over northeastern Brazil (orange and yellow lines).
|
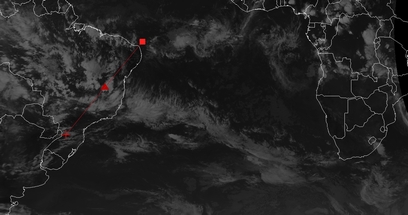
The loop below represents the evolution of SACZ IR Images (Channel 4) from 24-30 March 2009. The most important feature is the persistence of convection over subtropical South America and the western South Atlantic Ocean. The timescale of SACZ varies, but it seldom persists for more than ten days at a time.
Loop: MSG Air Mass RGB of 24/03/2009 - 30/03/2009 18UTC - SACZ |
Meteorological Physical Background
Introduction
The SACZ is the main source of large-scale rainfall in Brazil during the austral summer, which covers the period from November to March. Similar structures are found in the South Pacific and South Indian Ocean, though the South Indian Convergence Zone (SICZ) is not as pronounced as the others.
SACZs occur north of their mean climatological location in the first months of summer. As the summer monsoon intensifies over South America in January and February, the SACZs occurs more frequently in the south.
Observations show a clear correlation between summer floods in the southeast and dry spells in the southern parts of the SACZ. In cases where the SACZ persists for an extended period in the southeast, extremely rainy periods coincide with Indian summers in southeastern Brazil.
SACZs are generated and maintained primarily by the interaction of tropical convection with the frontal systems of subtropical South Atlantic monsoons. These SACZs have an average life cycle of eight to ten days. The fluctuation and duration of SACZs also depends on intraseasonal oscillations on time scales of 20-30 days and 30-60 days.
Broad Overview
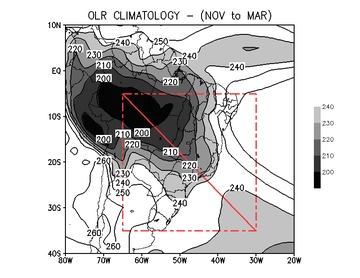
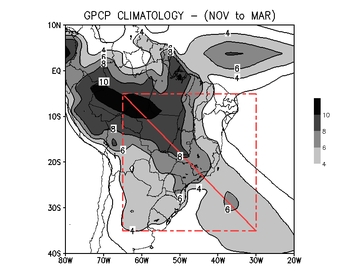
Climatological maps of average outgoing longwave radiation (OLR) and the amount of precipitation in the austral summer months (November to March) from 1982 to 2011 are presented in Figures 1 and 2.
The OLR field is based on ERA INTERIM reanalysis and precipitation data provided by GPCP (Global Precipitation Climatology Project). The location of the convergence zone typically falls inside the red box. The red line shows the mean climatological position of SACZs.
Low longwave radiation values (usually below 220 W/m2) mean cold areas. They may be caused by high clouds (in the tropics) or cold surfaces (in the middle and high latitudes). The location of low OLR values coincides with the highest amounts of precipitation. The precipitation is concentrated in three regions: 1) northern region within the Intertropical Convergence Zone (ITCZ); 2) from the Amazonas Region to southeastern Brazil and 3) subtropical South Atlantic Ocean. The latter two are caused by SACZ.
|
Figure 1: Average Monthly Climitology of Outgoing Longwave Radiation (OLR - W/m2) from November to March (1982 to 2011)
|
Figure 2: Precipitation (mm) GPCP Climatology, from November to March (1982 to 2011)
|
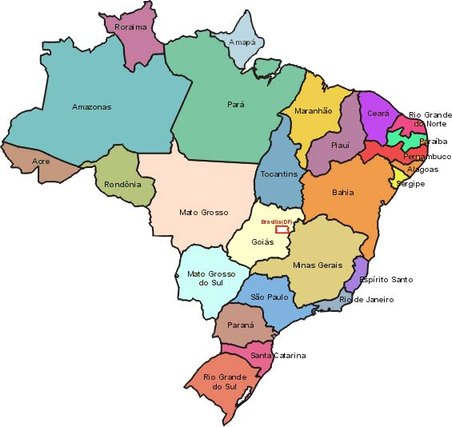
Division of Brazilian States |
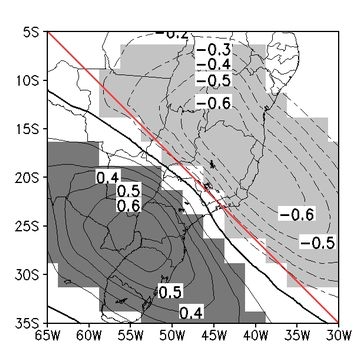
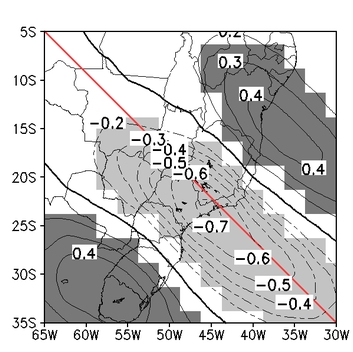
Empirical orthogonal functions (EOF) are used to study the spatial and temporal variations of SACZ. Figure 3 shows the the correlation between the first component of EOF analysis and the OLR anomaly (Type 1), and Figure 4 the correlation between the second component of EOF analysis and the OLR anomaly (Type 2). They reveal a range of variability of around 50%.
Deep clouds within SACZ have negative correlation values. In Figure 3, the highest negative values are located in Espírito Santo and north of Minas Gerais, while in Figure 4 they are located on the border of the states of São Paulo and Rio de Janeiro and south of Minas Gerais. The positive correlation values coincide with strong OLR anomalies, which can result from lack of convection. Note that in Figure 3 there is one maximum for both positive and negative values, while Figure 4 has one maximum of negative values but two maxima of positive values. These will be shown in the case studies below.
|
Figure 3: Correlation pattern between the OLR anomaly and the first component of EOF analysis.
|
Figure 4: Correlation pattern between the OLR anomaly and the second component of EOF analysis.
|
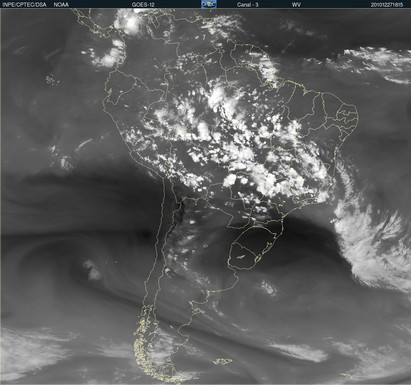
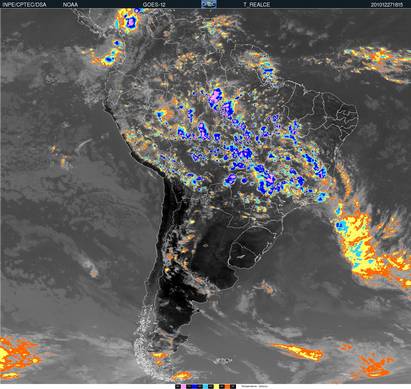
Type 1: 27 December 2010 at 18:15 UTC
The SACZ reaches from Espírito Santo and north of Minas Gerais to western Amazonia. It is situated slightly to the north of the mean climatological location. The dry air within a high in southern Brazil, eastern Argentina and Uruguay can be detected in WV and IR images (Figures 5 and 6). This pattern is quite similar to the dipole pattern associated with type 1 in Figure 3, which suggests that the statistical analysis has a strong connection with the meteorological physical background.
|
Figure 5: GOES 12 - WV channel for 27 December 2010 at 18:15 UTC
|
Figure 6: GOES 12 - IR enhanced for 27 December 2010 at 18:15 UTC
|
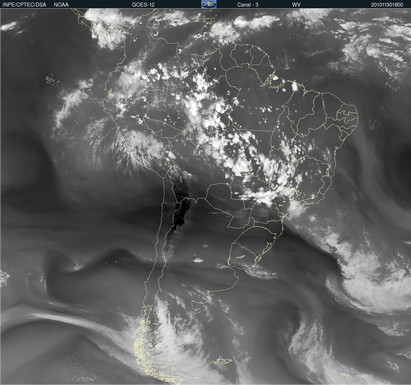
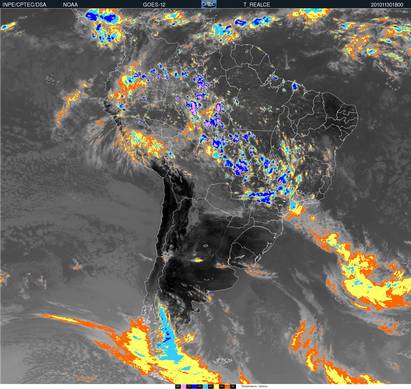
Type 2: 30 November 2010 at 18:00 UTC
The SACZ stretches from the states of São Paulo and Rio de Janeiro toward western Amazonia. In this case, the SACZ is close to its mean climatological location (figure 2), unlike in the previous case (27 December 2010 at 18:15 UTC). In this case, the convection is restricted to a narrow cloud band. There are two highs, one in southern and the other in northeastern Brazil, which is compatible with the tripole structure.
|
Figure 7: GOES 12 - WV channel for 30 November 2010 at 18:00 UTC
|
Figure 8: GOES 12 - IR enhanced for 30 November 2010 at 18:00 UTC
|
Key Parameters
The numerical parameters in this chapter are calculated from ERA INTERIM reanalysis. They present two types of EOF analysis.
Low levels
- Temperature at 1000 hPa shows the surface temperature gradient accompanying the passing frontal system. Temperature is also one of the factors contributing to the triggering of convection.
- Mean sea level pressure shows surface lows and highs, as well as pressure gradients accompanying frontal system passages.
- Wind (850 hPa) shows the large-scale low-level flow that transports moisture.
- Moisture convergence is one of the factors contributing to the development of convection. Moisture convergence is strongest in low levels.
|
|
|
|---|---|
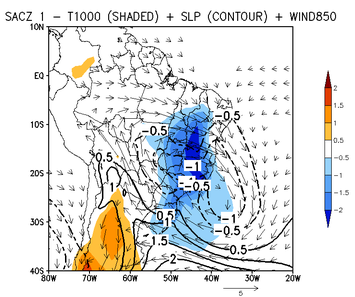
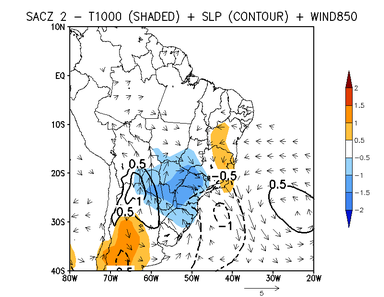
| There is well-defined low-level cyclonic circulation over southeastern Brazil (centered over the state of Espírito Santo) accompanied by negative anomalies of mean sea level pressure and wind convergence. The main low-level flow arises from the Amazon Region, transporting moisture to the southeast. There is also a negative temperature anomaly over the region. As seen in the previous section, the pressure and temperature fields have two poles and the convergence zone lies north of its mean position. | There's a cyclonic circulation over southeastern Brazil (centered over São Paulo), accompanied by weak negative anomalies of mean sea level pressure and temperature. The flow and the anomalies are less prominent than in Type 1, but there is a flow from the Atlantic to the continent. As seen in the previous section, the pressure and temperature fields have three poles and the convergence zone lies near the mean location. |
|
Figure 1: Anomalies of temperature at 1000 hPa (shaded), mean sea level pressure (black isolines) and wind vectors at 850 hPa for Type 1.
|
Figure 2: Anomalies of temperature at 1000 hPa (shaded), mean sea level pressure (black isolines) and wind vectors at 850 hPa for Type 2.
|
|
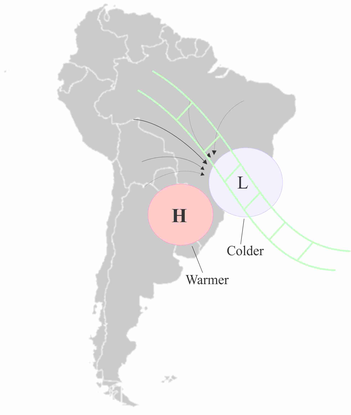
Figure 3: Schematics for Type 1 at low levels (Figure 1): 'dipole pattern' of surface pressure with strong wind convergence. A low over southeast region of Brazil (accompanied by negative temperature anomalies) and a high over south Brazil, Uruguay and Argentina (accompanied by positive temperature anomalies). Green lines: location of the SACZ.
|
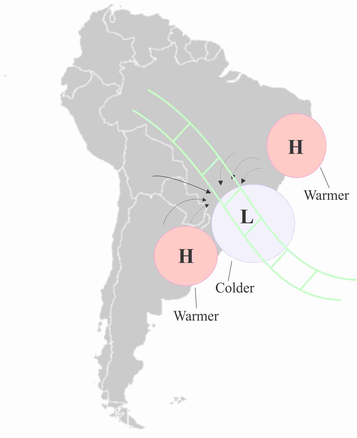
Figure 4: Schematics for Type 2 at low levels (Figure 2): 'tripole pattern' of surface pressure with weak wind convergence. A low over southeastern Brazil (accompanied by negative temperature anomalies) and highs over south Brazil, Uruguay and Argentina and also over northeast Brazil (accompanied by positive temperature anomalies). Green lines: location of the SACZ.
|
Middle levels (500 hPa):
- Vertical velocity (omega) shows the areas of upward motion, contributing to the persistence of convection.
- Geopotential height shows the thermal and pressure distribution of the middle troposphere.
- Wind shows the basic synoptic flow.
|
|
|
|---|---|
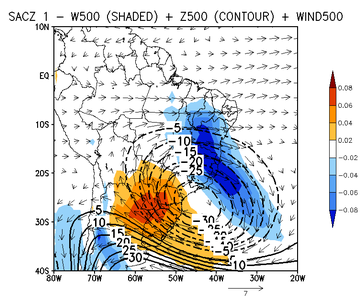
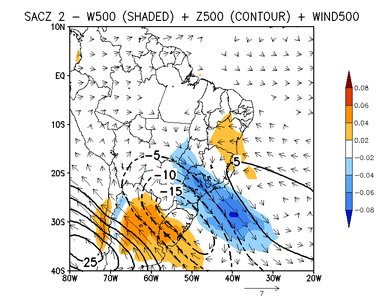
| The geopotential at 500 hPa shows the synoptic scale circulation of a SACZ event. There are negative values of omega over the eastern part of the circulation, which means that there is upward motion in the middle troposphere and convergence below. There is downward motion over southern Brazil. | The 500 hPa geopotential anomalies are weaker than in Type 1. The upward motions are located over the state of São Paulo. The basic flow consists of components coming from Amazonia and the Atlantic Ocean. |
|
Figure 5: 500 hPa omega (shaded), geopotential (black isolines) and wind vectors for Type 1.
|
Figure 6: 500 hPa omega (shaded), geopotential (black isolines) and wind vectors for Type 2.
|
|
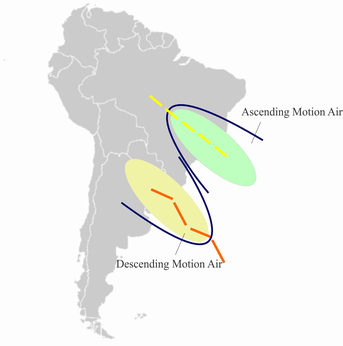
Figure 7: Schematics for Type 1 at middle levels (Figure 5): a trough (axis marked with a dashed yellow line) with ascending motion and a ridge (axis marked with a dashed orange line) with descending motion and clear skies.
|
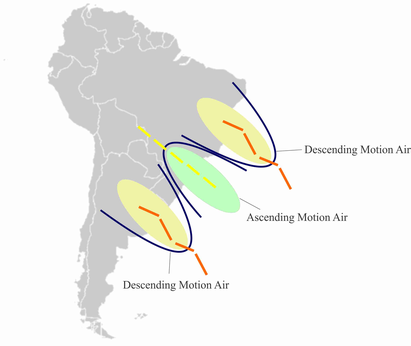
Figure 8: Schematics for Type 2 at middle levels (Figure 6): a trough (axis marked with a dashed yellow line) with ascending motion and two ridges (axes marked with dashed orange lines) with descending motion and clear skies.
|
High levels (200 hPa):
- Zonal wind provides information about high level jet streams.
- Wind shows the basic flow and the waves in it.
- Divergence shows the areas of upward and downward motion in the troposphere.
|
|
|
|---|---|
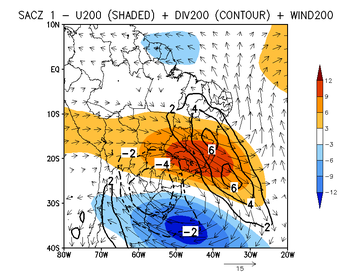
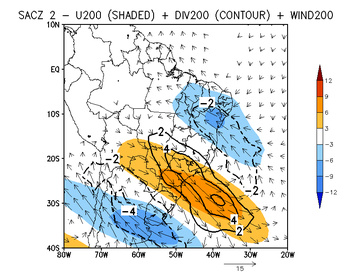
| The jet stream can be found within the region of positive anomalies of zonal wind velocity and divergence. There is a trough with positive values of divergence in the northern part of the circulation. There are easterly winds and negative divergence values over southern Brazil, which imply descending motion and dry air. The 'dipole pattern' is seen here as well as at lower levels. | A westerly wind with positive values of divergence prevails over southern Brazil. Over northeast and southern Brazil there are easterly winds and negative values of divergence. The 'tripole pattern' is seen here as well as at lower levels. |
|
Figure 9: 200 hPa zonal wind (shaded), divergence (black isolines) and wind vectors for Type 1.
|
Figure 10: 200 hPa zonal wind (shaded), divergence (black isolines) and wind vectors for Type 2.
|
|
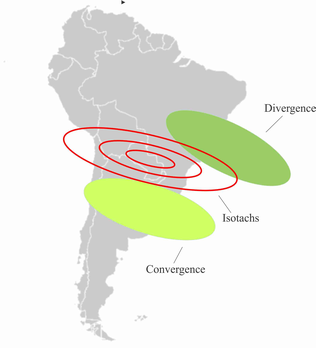
Figure 11: Schematics for Type 1 at high levels (Figure 9): isotachs of the jet stream, divergence over the location of the SACZ and convergence over south Brazil, Uruguay and Argentina.
|
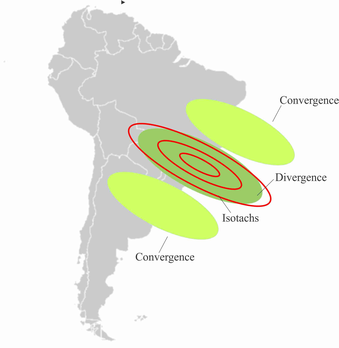
Figure 12: Schematics for Type 2 at high levels (Figure 10): isotachs of the jet stream, divergence over the location of SACZ and convergence over south Brazil, Uruguay and Argentina, and northeast Brazil.
|
Typical Appearance In Vertical Cross Sections
Here are some relevant features from the NWP parameters that describe the vertical structure of the SACZ events:
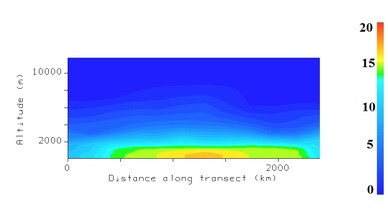
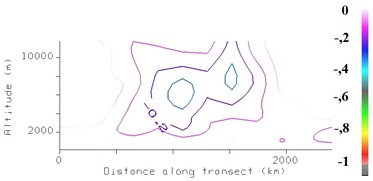
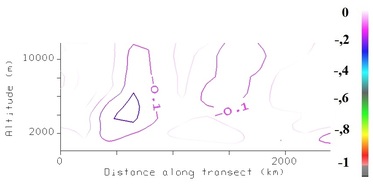
- Vertical velocity (omega): upward motion helps sustain the convective processes along the cloud band.
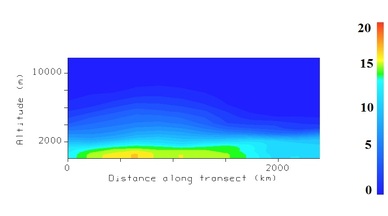
- Specific humidiy: humidity in the troposphere supplies the convective processes with energy.
VCS Over Land
|
Figure 1: Location of the cross section over land.
|
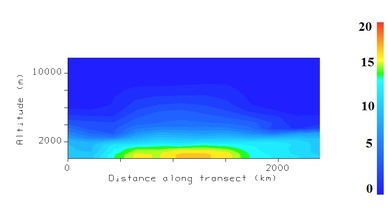
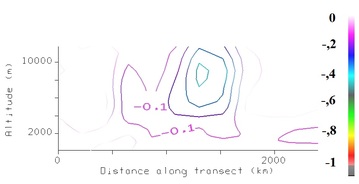
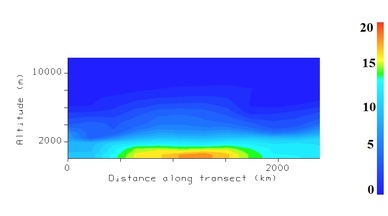
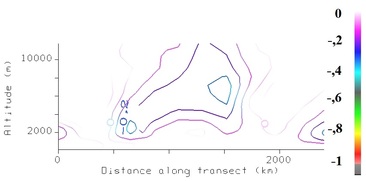
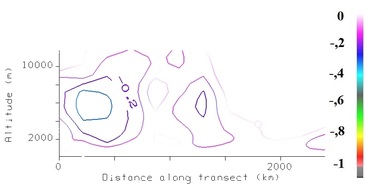
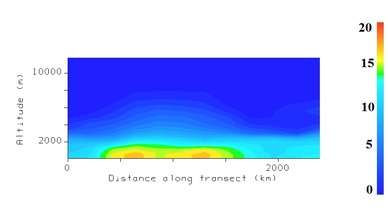
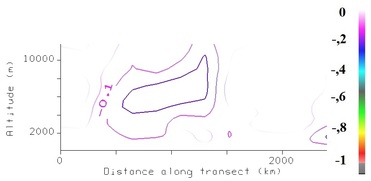
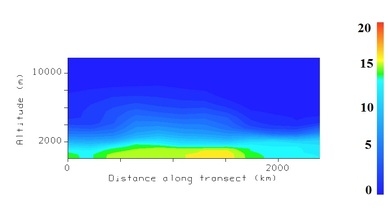
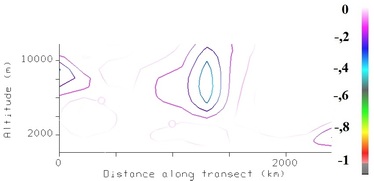
Maximum values of humidity have a horizontal extent between 1500-2000 km, reaching maximum size on the third and fourth days. Vertical velocity values peak on the first three days. From the fifth day on, both humidity and velocity maxima have shifted north. On 29-30 March 2009 both values decrease.
|
Figure 1a: VCS humidity (g/kg) 24 Mar 2009 - 18:00 UTC.
|
Figure 2a: Vertical velocity (Pa/s) 24 Mar 2009 - 18:00 UTC.
|
|
Figure 3a: VCS humidity (g/kg) 25 Mar 2009 - 18:00 UTC.
|
Figure 4a: Vertical velocity (Pa/s) 25 Mar 2009 - 18:00 UTC.
|
|
Figure 5a: VCS humidity (g/kg) 26 Mar 2009 - 18:00 UTC.
|
Figure 6a: Vertical velocity (Pa/s) 26 Mar 2009 - 18:00 UTC.
|
|
Figure 7a: VCS humidity (g/kg) 27 Mar 2009 - 18:00 UTC.
|
Figure 8a: Vertical velocity (Pa/s) 27 Mar 2009 - 18:00 UTC.
|
|
Figure 9a: VCS humidity (g/kg) 28 Mar 2009 - 18:00 UTC.
|
Figure 10a: Vertical velocity (Pa/s) 28 Mar 2009 - 18:00 UTC.
|
|
Figure 11a: VCS humidity (g/kg) 29 Mar 2009 - 18:00 UTC.
|
Figure 12a: Vertical velocity (Pa/s) 29 Mar 2009 - 18:00 UTC.
|
|
Figure 13a: VCS humidity (g/kg) 30 Mar 2009 - 18:00 UTC.
|
Figure 14a: Vertical velocity (Pa/s) 30 Mar 2009 - 18:00 UTC.
|
VCS Over Ocean
|
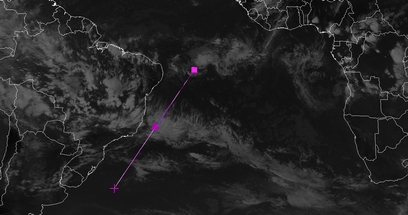
Figure 1: Location of the cross section over sea.
|
|
Figure 1b: VCS humidity (g/kg) 24 Mar 2009 – 18:00 UTC.
|
Figure 2b: Vertical velocity (Pa/s) 24 Mar 2009 - 18:00 UTC.
|
|
Figure 3b: VCS humidity (g/kg) 25 Mar 2009 - 18:00 UTC.
|
Figure 4b: Vertical velocity (Pa/s) 25 Mar 2009 - 18:00 UTC.
|
|
Figure 5b: VCS humidity (g/kg) 26 Mar 2009 - 18:00 UTC.
|
Figure 6b: Vertical velocity (Pa/s) 26 Mar 2009 - 18:00 UTC.
|
|
Figure 7b: VCS humidity (g/kg) 27 Mar 2009 - 18:00 UTC.
|
Figure 8b: Vertical velocity (Pa/s) 27 Mar 2009 - 18:00 UTC.
|
|
Figure 9b: VCS humidity (g/kg) 28 Mar 2009 - 18:00 UTC.
|
Figure 10b: Vertical velocity (Pa/s) 28 Mar 2009 - 18:00 UTC.
|
|
Figure 11b: VCS humidity (g/kg) 29 Mar 2009 - 18:00 UTC.
|
Figure 12b: Vertical velocity (Pa/s) 29 Mar 2009 - 18:00 UTC.
|
|
Figure 13b: VCS humidity (g/kg) 30 Mar 2009 - 18:00 UTC.
|
Figure 14b: Vertical velocity (Pa/s) 30 Mar 2009 - 18:00 UTC.
|
Weather Events
| Parameter | Description |
|---|---|
| Pressure |
|
| Precipitation |
|
| Wind |
|
| Other Relevant information |
|
|
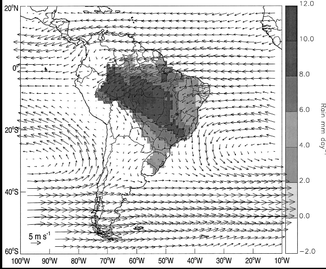
Figure 1: Mean daily summertime (December-February) precipitation calculated with a grid length of 2º lat/long (shaded area) and 850hPa wind vectors.
|
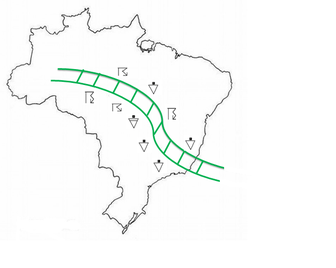
Figure 2: Typical weather events within a SACZ: thunderstorms, moderate and light showers.
|
References
- CARVALHO, L.M.V.; JONES, C.; LIEBMANN, B.; The South Atlantic Convergence Zone: Intensity, form, persistence, and relationships with intraseasonal to interannual activity and extreme rainfall. Journal of Climate, v.17, p.88-108, 2004.
- JONES, C.; CARVALHO, L. M. V. Active and break phases in the South American monsoon system. Journal of Climate, v. 15, p.905-914, 2002.
- KODAMA, Y. M. Large-scale common features of subtropical precipitation zones (the Baiu frontal zone, the SPCZ, and the SACZ) Part I: Characteristics of subtropical frontal zones. Journal of the Meteorological Society of Japan, v.70, n. 4, p.813-836,1992.
- KODAMA, Y. M. Large-scale common features of subtropical precipitation zones (the Baiu frontal zone, the SPCZ, and the SACZ) Part II: Conditions of the circulations for generating STCZs. Journal of the Meteorological Society of Japan, v.71, n. 5, p. 581-610, 1993. 148
- KOUSKY, V. E.; CAVALCANTI, I. F. A. Precipitation and atmospheric circulation anomaly patterns in the South American sector. Revista Brasileira de Meteorologia. v. 03, p.199-206, 1988.
- KOUSKY, V. E.; KAYANO, M. T. Sobre o monitoramento das oscilações intrasazonais. Journal of Climate, v.7 (2), p.593-602, 1992.
- KOUSKY, V. E.; KAYANO, M. T. Principal modes of Outgoing Longwave Radiation and 250mb circulation for South American sector. Journal of Climate, v.7, p.1131- 1142, 1994.
- LIEBMANN, B.; SMITH, C. Description of a complete (interpolated) outgoing longwave radiation dataset. Bull. Amer. Meteor. Soc., v.77, p.1275-1277, 1996.
- LIEBMANN, B.; KILADIS, G. N.; MARENGO, J. A.; AMBRIZZI, T. Submonthly convective variability over South America and South Atlantic Convergence Zone. Journal of Climate, v.12, p.1877-1891, 1999.
- MARQUES, F. A.; Influências Remotas na Previsibilidade, Estrutura e Ciclo de Vida da Zona de Convergência do Atlântico Sul, 2011, 149 p. INPE 02.24.21.46-TDI. Dissertação (Mestrado em Meteorologia) - Instituto Nacional de Pesquisas Espaciais, São José dos Campos. 2011. Disponível em: http://urlib.net/8JMKD3MGP7W/398H4P8
- NOGUÉS-PAEGLE, J.; MO, K. C. Alternating wet and dry conditions over South America during summer. Monthly Weather Review, v.125, p.279-290, 1997.
- NOGUÉS-PAEGLE, J.; BYERLE, L. A.; MO, K. C. Intraseasonal modulation of South American summer precipitation. Monthly Weather Review, v.128, p.837-850, 2000. 149
- QUADRO, M. F. L. Estudo de episódios de zonas de Convergência do Atlântico Sul (ZCAS) sobre a América do Sul. 1993. 124 p. (INPE-6341-TDI/593). Dissertação (Mestrado em Meteorologia) - Instituto Nacional de Pesquisas Espaciais, São José dos Campos. 1993. Disponível em: http://urlib.net/sid.inpe.br/MTCm13@ 80/2005/08.26.14.10. Acesso em: 12 abr. 2011.
