Weather Events

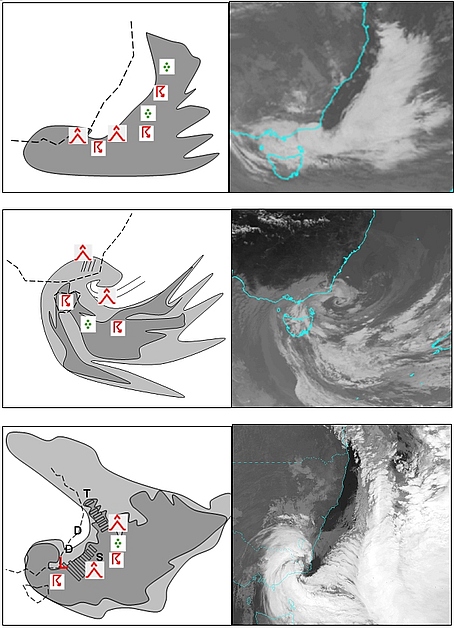
Figure 20: Schematic of weather associated with the EXCY events of 12 June 2013 (top), 26-27 December 1998 (center) and 26 June 2007 (bottom) with corresponding satellite images.
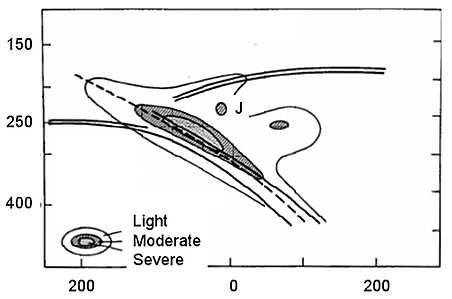
Figure 20: Turbulence associated with a sharp trough. J = jet core. Dashed line is the trough line. Double line is the tropopause.

Parameter Description
Precipitation
  • Intense precipitation associated with the Warm Conveyor Belt.
  • Thunderstorms within the inner edge of the cloud head at the southern and western side of the surface low, also within the warm conveyor belt.
  • Heavy flooding for coastal and windward slopes along the eastern seaboard of eastern Australia, especially where the low to mid level wind flow is onshore
Temperature
  • Usually falls after the passage of the front
  • Rise after landfall
Wind (incl. gusts)
  • Strong lower tropospheric winds within the area of the cloud head on the poleward side of the low. In extreme cases winds may reach hurricane force. Tornadic events are also possible with thunderstorms.
  • Very strong low level wind gusts in the transition zone between dark and white in the non-colour enhanced water vapour channel near the cold front and the cloud head. In particular, rapid descent of the very dry jetstream air at the front of the jet and its interaction with the moisture in the cloud head results in evaporative cooling. This enhances the descent and may permit the jet to reach the earth's surface as a "Sting Jet".
  • Strong shear in the middle and upper troposphere near jetstreams and resulting aviation turbulence issues. This is shown in the above diagram in the case of a sharp upper trough.
Marine conditions
  • Sea state and swell generated by the winds around the low resulting in hazardous marine conditions and also flooding due to storm surge and erosion of coastal regions.
Other relevant information
  • Very strong pressure falls and rises. In the initial stage, falls ahead exceed the rises behind the system.

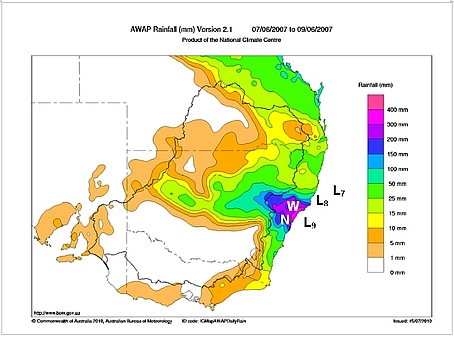
Figure 21: Three-day rainfall to 0900 EST 9 June 2007 from the Australian Water Availability Project rainfall analyses. Location of the surface low at 00 UTC 7 June (L7), 00 UTC 8 June (L8) and 00 UTC 9 June (L9) as shown. The location of Williamtown and Norah Head are also shown. Diagram from Mills et al. 2010
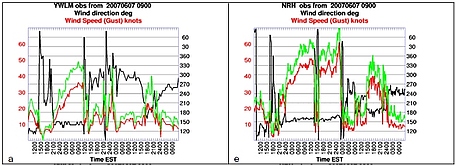
Figure 21: Seventy two hour meteograms starting at 0900 EST 7 June 2007 from Williamtown (left) and Norah Head (right). These locations are shown in the previous figure. Wind direction in black, wind mean (10 minute) in red, gusts in green.Diagram from Mills et al. 2010