Typical Appearance In Vertical Cross Sections
- Wind (barbs and isotachs). The isotachs show a pronounced jet stream along the rear edge of the frontal gradient of the cold front. The cloud head can often be found within the right exit region of a jet streak situated downstream of the low (in the southern hemisphere). A maximum of the isotachs is often present at the poleward side of the cloud head.
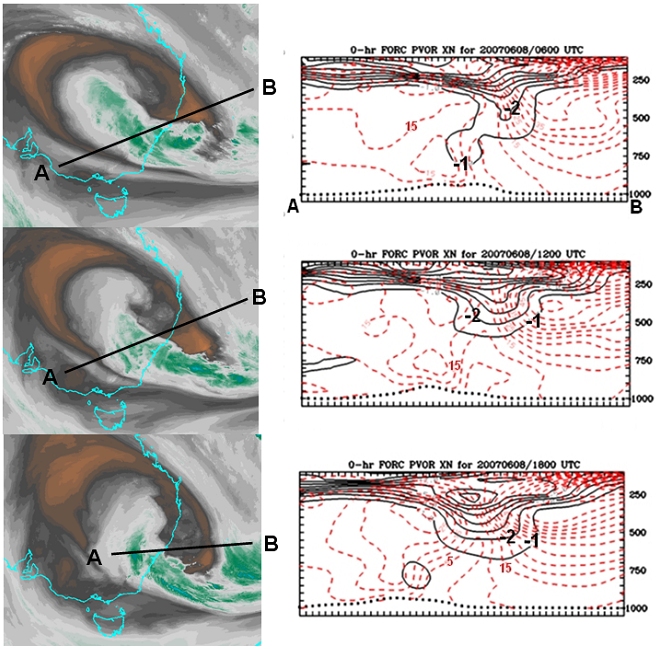
- Potential Vorticity (Isentropic and Isobaric). Potential vorticity shows an anomaly protruding deep into the troposphere or to the rear of the zone of the highest gradient of the isentropes of the cold front. This lowering of the so-called dynamical tropopause (-1 to -2 PV Units) is already clearly seen in the initial stage of explosive cyclogenesis, where the tropopause height sinks below 400 hPa. In mature stages the tropopause is often below 500 hPa and in extreme cases below 700 hPa. This Northern Hemisphere rule may need to be modified for the lower latitude / deeper troposphere over the Australian region and the lower intensity and atmospheric depth of Southern Hemisphere bombs.
- Equivalent Potential Temperature. This parameter assists in identifying areas of low level instability, for example upper level dry air over-running low level moist air.
- Relative humidity. Within the dry tongue low values of relative humidity can be found to relatively low levels in the atmosphere.
- Temperature advection. The field of temperature advection shows a very distinct and pronounced signature. There is a maximum of warm advection within and in front of the cloud head, and cold advection directly behind it.
- Vorticity advection. The field of vorticity advection shows a pronounced cyclonic vorticity anomaly maximum at upper levels, mostly situated within the area of the cloud head and an anticyclonic vorticity anomaly maximum on the other side of the dry tongue in the gradient zone of the cold front. Both correlate well with the right and left exit regions (in the Southern Hemisphere) of the dominating jet streak.
|
|
Figure 19: The "Pasha Bulker" east coast low of 8 June 2007, showing important parameters in vertical cross section.Images courtesy BOM
|
Left: The position of the Vertical Cross Section. Right: Isentropic Potential Vorticity (black contours), wind speed (dashed red contours).
Left panels: Enhanced water vapour imagery showing the location of the cross sections in the right panels. Satellite images and model data at times 06UTC 8 June (top), 12UTC (middle), 18UTC (bottom).
Right panels: isentropic potential vorticity (black lines, K) and wind speed (red, m s-1) of the corresponding times.