Meteorological Physical Background
Broad Overview
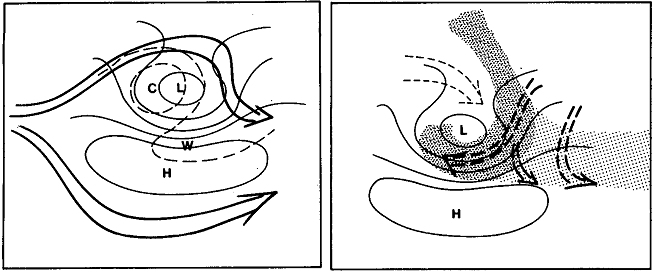
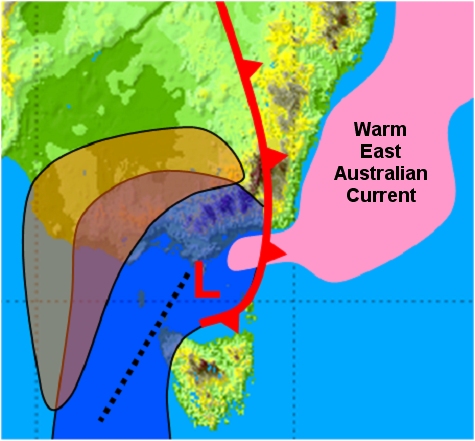
The Tasman Sea low pressure systems that undergo EXCY are frequently embedded in "cyclonic undulations" within the low level easterly flow often referred to as "Easterly dips". A schematic of major upper and low level features of an "Easterly dip" are shown in the figure below.
An Easterly dip typically develops under or downstream of a mid tropospheric cold core cyclone which has its origins as a cutoff low in the westerlies. An easterly dip often lies between two diffluent jet streams.
To the east of the low pressure centre low level tropical air rises and splits to flow around the poleward side of the cyclone or join the jetstream flow in a warm conveyor belt. Mid tropospheric air subsides around the equatorward side of the low pressure centre.
Considerable upper-level baroclinicity provides the main energy source for development of cyclogenesis. Interestingly, for many Tasman Sea low pressure systems, low level changes occur in the subtropical airmass with no distinct thermal front forming at the surface. Instead, deformation fields produce distinct moisture gradients at the surface, which are enhanced by differences in dry continental and moist maritime tropical air along the coast and differential isentropic vertical motion.
|
|
Figure 10: Images from Holland et al. 1987
|
Schematics of the major features of an "Easterly Dip". Left - surface isobars (solid lines), 1000-500 hPa thickness contours (dashed lines), and diffluent upper atmosphere jet streaks (long arrows)
Right - surface isobars, stratiform cloud with embedded convection - the Warm Conveyor Belt (heavy stipple), stratiform cloud (light stipple) and wet bulb isentropic potential trajectories with downward motion along the dashed arrow and upward motion along the broken bold arrows.
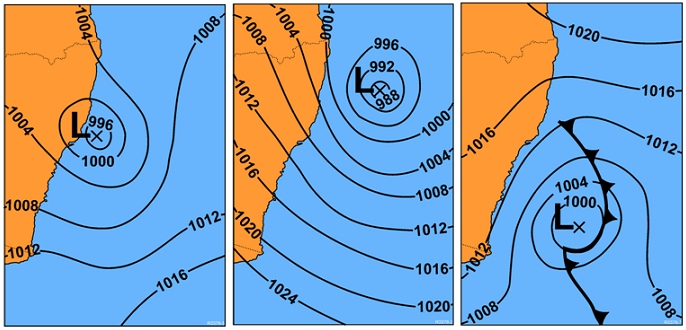
Examination of Tasman Sea low pressure systems over the period 1970-2006 reveal that 92% of Tasman Sea explosive low pressure systems can be subdivided into three classes by synoptic type, Waves on a Front (40%), Inland Troughs (33%) and Easterly Troughs (19%) as shown below. These three classes include 81% of all Tasman Sea low pressure systems.
|
|
Figure 11: Diagrams from Speer et al. 2009
|
Mean sea level pressure synoptic patterns commonly associated with explosive Tasman Sea lows. Inland trough low (left), easterly trough low (center) and wave on a front low (right).
In summarizing many explosive cyclogenesis events associated with East Coast Lows the following developments are seen to be important.
In the upper levels of the troposphere an amplifying trough over eastern Australia moves eastwards towards the Tasman Sea with a jet-streak propagating around the apex of this trough. This synoptic system may transition to a negatively tilted trough if the trough is undercut by a high amplitude ridge on the poleward side.
In the low levels a pre-existing trough or cold front is located over eastern Australia or the western Tasman Sea, adjacent to the eastern seaboard of Australia. Interestingly, the trough or cold front may have an extensive cloudband associated with it prior to its movement across the eastern seaboard of Australia.
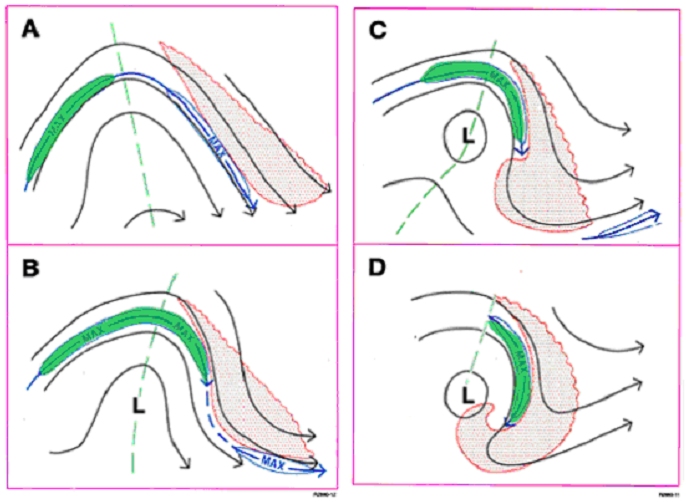
The interaction of the strong upper tropospheric potential vorticity anomaly associated with the propagating jet with the low level potential vorticity anomaly associated with the trough / cold front results in pressure falls at the surface and the commencement of explosive cyclogenesis. Indeed, explosive cyclogenesis over southeastern Australia and adjacent maritime regions often occurs near the forward exit region of a 300 hpa jet streak as shown in the below diagrams.
Other factors that contribute to EXCY include the meridional temperature gradient between the Tasman Sea and the adjacent Australian seaboard, the effect of the Great Dividing Range and the low static stability of the atmosphere along the east coast of Australia.
There is a temperature gradient between the cold nearshore waters and the warm offshore eddies of the East Australian current as well as the cool nocturnal land and the warm offshore waters. Therefore the low levels of the atmosphere along the east coast of Australia have low static stability with the warm surface temperature of the East Coast Current providing boundary layer sensible and latent heat.
The Great Dividing Range, inland from the east Australian seaboard may interact with a developing baroclinic wave (lee cyclogenesis). This may position the low pressure system or generate a secondary low in the lee of the range.
Interestingly in a number of cases of EXCY involving East Coast Lows the parent surface low pressure system and associated cloud band may already have developed to the point of advanced occlusion prior to the EXCY episode.
Sometimes rapid descent of the very dry jetstream air at the front of the jet and its interaction with the moisture in the cloud head results in evaporative cooling. This enhances the descent and may permit the jet to reach the earth's surface as a "Sting Jet".
|
|
Figure 12: Diagrams courtesy G.Feren BOM
|
Schematic diagram showing changes in the mid-upper level synoptic pattern leading to explosive cyclogenesis for many East Australian mid-latitude cyclones. Flow at 300 hPa as black lines, jet axis in blue, the relevant jet streak is shown in green and developing cloud band / comma cloud in red.
Schematic diagrams summarising EXCY for East Coast Lows that involve low level troughs and waves on a front are shown below.
|
|
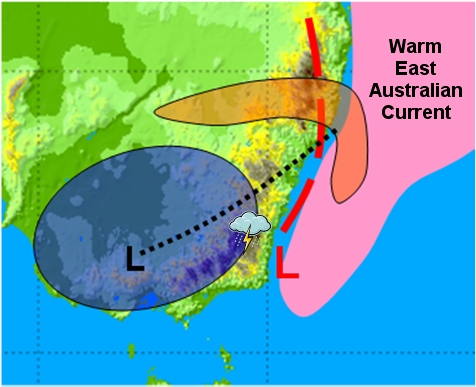
Figure 13: Schematic diagrams summarising EXCY for East Coast Lows.
|
Schematic summarising the recipe for an EXCY episode for an East Coast Low involving a surface trough along the east Australian coast modelled on the example of the 12/13 June 2013.
Rapidly deepening surface low and associated trough in red. Cold pool as defined by closed geopotential height contour at 300 hPa in blue. Upper low and associated involuted upper trough in black. Location of the jet (winds > 80 knots at 300 hPa) in orange. On the poleward flank of the low moist warm air moves westwards over the Great Dividing Range and this can generate convection.
|
|
Figure 14: Schematic summarising the recipe for an EXCY episode.
|
Schematic summarising the recipe for an EXCY episode for an East Coast Low involving a wave forming on a surface cold front modelled on the example of the 26 December 1998 at 12UTC.
Rapidly deepening surface low and associated cold front in red. Cold pool as defined by 1000-500 hPa thickness and 300 hPa winds in blue. Upper trough axis as a black dotted line. Location of the jet (winds > 80 knots at 300 hPa) in orange.
Geographical Location
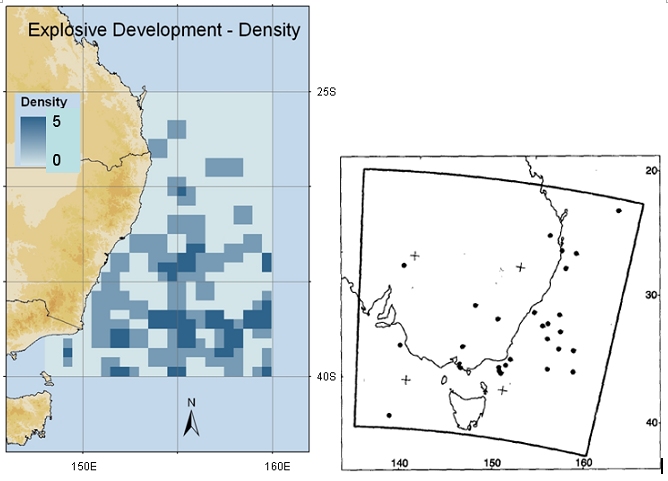
Location of explosive lows in the western Tasman Sea and locations of developing cyclones with accompanying striated delta cloud features are shown in the figures below.
|
|
Figure 15: LHS diagram Speer et al. 2009, RHS diagram Feren 1995
|
Left hand panel: density of explosive lows (>10hPa in 24 hours) in the western Tasman Sea, 1970-2006. Right hand panel: Formation position for developing "striated delta cloud" associated with major cyclogenesis (solid dots). The location of these dots correspond to approximate midpoint of cloud systems.
Seasonal variety
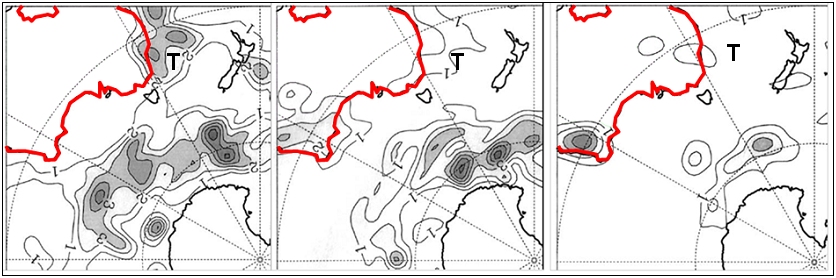
Seasonal variations in the occurrence of explosive cyclogenesis is shown in the diagrams below. Explosive cyclogenesis over the Australian region occurs predominantly over southern and eastern parts of the continent and adjacent waters during the late autumn and winter months and over the western Australian region during the summer months.
|
|
Figure 16: Diagram from Lim and Simmonds 2002
|
Mean southern hemisphere explosive cyclone system density during the months JJA (left), SON (center), DJF (right). Statistics for the months of MAM are not shown as during these months explosive cyclones occur well to the south of the Australian continent. The contour interval is 1x10⁻⁵ explosive cyclones (degree latitude)-2. Continental Australia is outlined in red. The statistics are evaluated using the "relative central pressure technique".
|
|
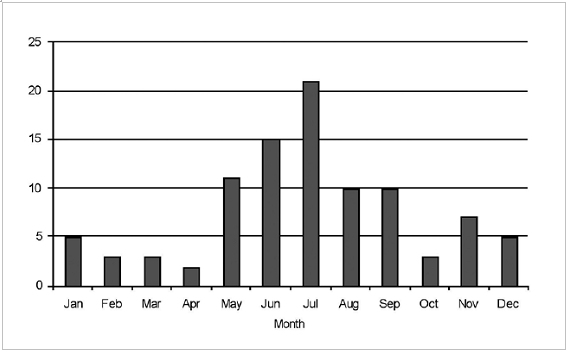
Figure 17: Diagram from Speer et al. 2009
|
Monthly distribution of synoptic lows with explosive development (>10hPa in 24 hours) in the western Tasman Sea over the period 1970-2006.
Life Cycle
The evolution of a typical East Coast Low EXCY event is shown in the figure below.
48 to 72 hours prior to the explosive development, an upper-tropospheric split-jet, or blocking pattern, with a positively tilted high-amplitude trough or cut-off low over southeastern Australia is often observed.
The next stage is the development of a southerly jet streak on the western side of the positively tilted trough over eastern Australia. The strong upper atmospheric potential vorticity anomaly associated with the exit region of the jet interacts with the low level vorticity anomaly associated with the low level trough or cold front and the explosive cyclogenesis episode commences. Strong temperature gradients between the cold/cool nocturnal land and the warm ocean of the East Australian Current early in the morning often coincide with the main episode of cyclogenesis. In the mid to upper levels of the atmosphere this synoptic system may transition to a negatively tilted trough if the trough is undercut by a high amplitude ridge on the poleward side.
Explosively intensifying extratropical cyclones may persist for the duration of a day or for several days.
The explosive deepening phase of these cyclones tends to occur on temporal and spatial scales of a few hours to half a day and a few hundred kilometres with deepening rates of 10 hPa or more in six hours. During the late mature stage the surface low moves under the upper low and fills. Alternatively, the system may be sheared by a newer developing system or opened and filled in advance of an approaching trough. East Coast Lows may also weaken when moving over waters with cooler sea surface temperatures.
Systems undergoing explosive cyclogenesis in the Australian region generally move to the southeast.
|
|
Figure 18: Diagram from Mills et al. 2010
|
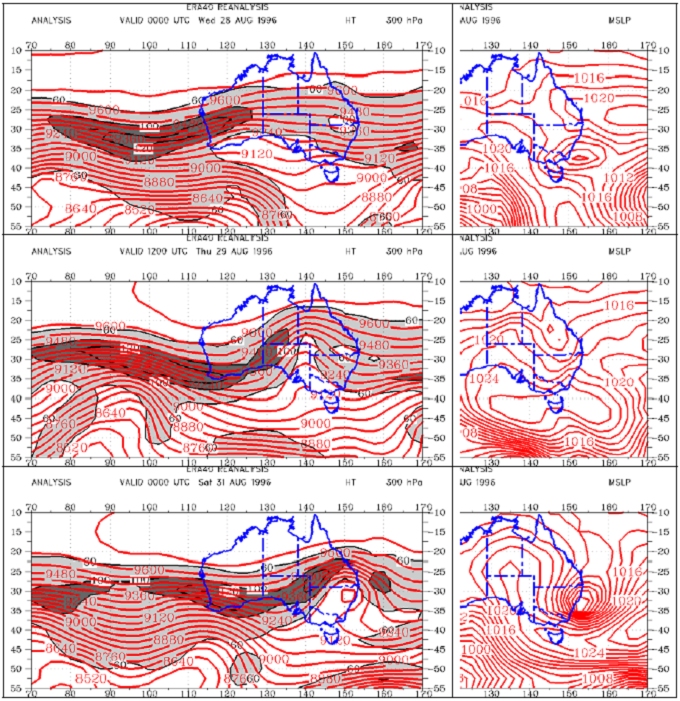
A typical sequence of surface and upper air developments leading to explosive cyclogenesis over southeastern Australia as illustrated by the East Coast Low of the 31st August 1996.
Left panels: 300 hPa geopotential height and wind speed for 00UTC 25 August (top), 12UTC 29 August (center) and 00UTC 31 August (bottom). Light shading in the isotachs corresponds to winds above 60 knots, dark shadings above 100 knots.
Right panels: Mean sea level pressure contours at every 2hPa.