Key Parameters
- Sea surface temperature, especially strong gradients in sea surface temperature accentuated by cold land temperatures during winter nights.
- Mean sea level pressure. Isobar analysis and forecasts resolves low pressure centres and troughs. Deepening in the central mean sea level pressure of a low pressure system can assist in monitoring the explosive cyclogenesis.
- Temperatures at 850, 700 hPa. These parameters permit monitoring of the development of low level horizontal temperature gradients, especially in the east-west direction around the centre of a developing low. This resolves the characteristic low level warm air / cold air dipole that is an important attribute of explosive cyclogenesis.
- Temperature advection at 850 and 700 hPa. The field of temperature advection shows a very distinct situation for a wave: a maximum of warm advection within the cloud head and the relevant parts in front, and cold advection behind. This pronounced warm advection / cold advection dipole is a sign of the ongoing cyclogenesis.
- Thickness 1000-500 hPa. Height contours at 1000 hPa: During the initial stages of development the absolute topography shows a continuously deepening trough. The mature stage is characterized by a surface low situated in the cloudless area of the dry tongue between the cloudiness of the Cold Front and the cloud head, the latter being situated to the rear side of the low. The height contours at 500 are perpendicular to the height contours at 1000 hPa indicating the cyclogenesis in the developing stage of explosive cyclogenesis.
- Winds at 300, 400, 500 hPa. Windbarbs and isotachs, in particular the wind speed threshold above 50 m/s. The isotachs at 300 hPa show a pronounced jet stream along the rear edge of the frontal cloud band. The cloud head can often be found within the right exit region of a jet streak situated downstream of the low. The presence of a jets having wind speed greater than 50 m/s at 300 hPa often correlates with developing explosive cyclogenesis.
- Potential Vorticity (Isentropic and Isobaric), in particular the values of the dynamical tropopause (between -1 and -2 PV unit surface in the southern hemisphere). The potential vorticity shows an anomaly (values between one and two units) along the rear cloud edge of the cold front. The anomaly, which separates the tropospheric from the stratospheric air, can be found below 400 hPa in cases of explosive cyclogenesis. Gradients in potential vorticity often closely correspond with gradients in brightness temperature in water vapour imagery and the satellite imagery can therefore be used for model verification.
- Vorticity advection at 500, 300 hPa. The field of vorticity advection shows a pronounced cyclonic vorticity advection maximum at 500 as well as at 300 hPa mostly situated within the area of the cloud head. The maximum can be found in the area of the right exit of the jet streak.
- Divergence at 300, 400 hPa. Upper forcing is especially pronounced on the downstream sector of a high amplitude negatively-tilted upper trough
|
|
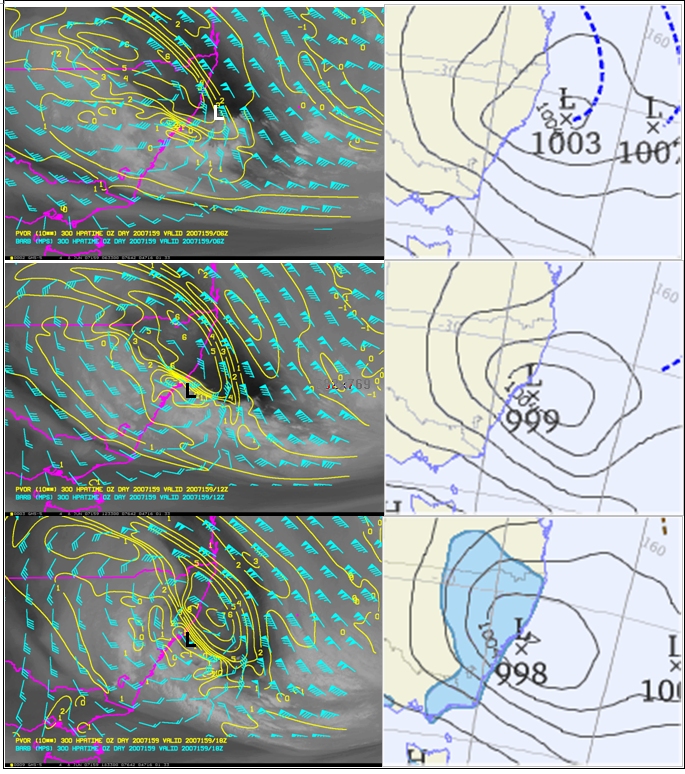
Figure 19: The "Pasha Bulker" east coast low of 8 June 2007, showing important upper and low level parameters. Images courtesy BOM
|
Left panels: 300 hPa winds and potential vorticity overlain on GMS5 water vapour imagery at times 06UTC 8 June (top), 12UTC (middle), 18UTC (bottom). The location of the surface low pressure system at the same time is shown as "L".
Right panels: MSLP pattern of the corresponding times. The bottom panel also shows the area of the preceding 24 hour rainfall.