Table of Contents
Cloud Structure In Satellite Images
Explosive Cyclogenesis occurs in a variety of synoptic settings, including low level troughs with embedded low pressure systems in the Tasman Sea as well as a "wave on a front low" (see Meteorological / physical background section). The life cycle of Explosive Cyclogenesis over the region of southeastern Australia ranges from 6 to 48 hours though EXCY in the Tasman Sea often occurs over only 6 hours. In the examples studied so far, EXCY often occurs within developed cloud spirals indicating an advanced occlusion process. Common features that are often seen in association with explosive cyclogenesis in satellite imagery include:
- Dry slot
- A "Comma Cloud" type feature
- High amplitude upper trough. This may be undercut by a high amplitude ridge on the poleward side to evolve into a negatively tilted (involuted) trough.
- Transverse cloud banding, including the striated delta cloud
- Low level cloud features (eg. tight cumulus banding near the centre of the low) as can be seen in visible imagery.
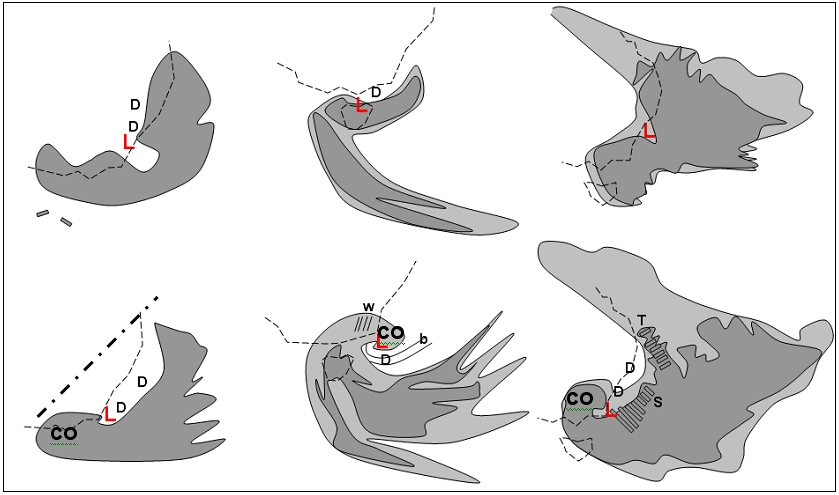
Schematic diagrams of cloud signatures of three EXCY episodes are shown below.
|
|
Figure 2:Schematic diagrams of cloud signatures of three EXCY episodes
|
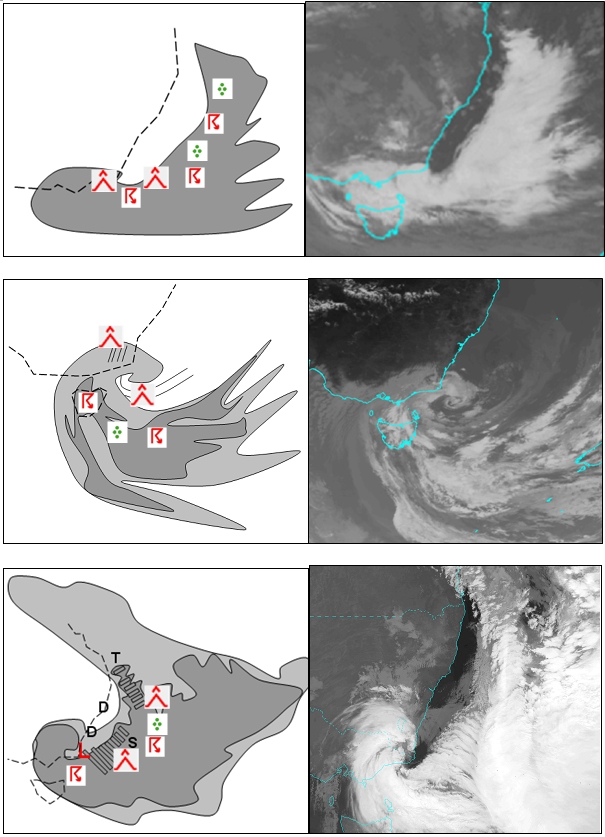
Schematics of cloud signatures of the EXCY episodes of 12 June 2013 (LHS, top 1032UTC, bottom 1832UTC) 26-27 December 1998 (centre, top 1532UTC, bottom 0332UTC), and 26 June 2007 (RHS, top 0600UTC, bottom 1800UTC). Top schematics show the cloud signatures prior to the EXCY episode, bottom schematic show the cloud signatures during the EXCY episode. Light grey shows low to mid level cloud tops, dark grey shows high level cloud tops. Involuted upper atmospheric trough axis for the 12 June example is annotated by a bold dot-dash line. L = position of the surface low pressure system, D = dry slots in the water vapour imagery, b = tight concentric banding of cumulus cloud around the low in visible imagery, w = mountain waves in visible imagery, c = cellular cloud tops (visible and infrared imagery), co = comma cloud, T = transverse waves developing in warm conveyor belt (vis, ir, wv). S = striated delta cloud developing in warm conveyor belt (vis, ir, wv). Coastline is shown as a thin dashed line.
|
|
Figure 3: Images courtesy Japan Meteorological Agency (JMA) and Australian Bureau of Meteorology (BOM).
|
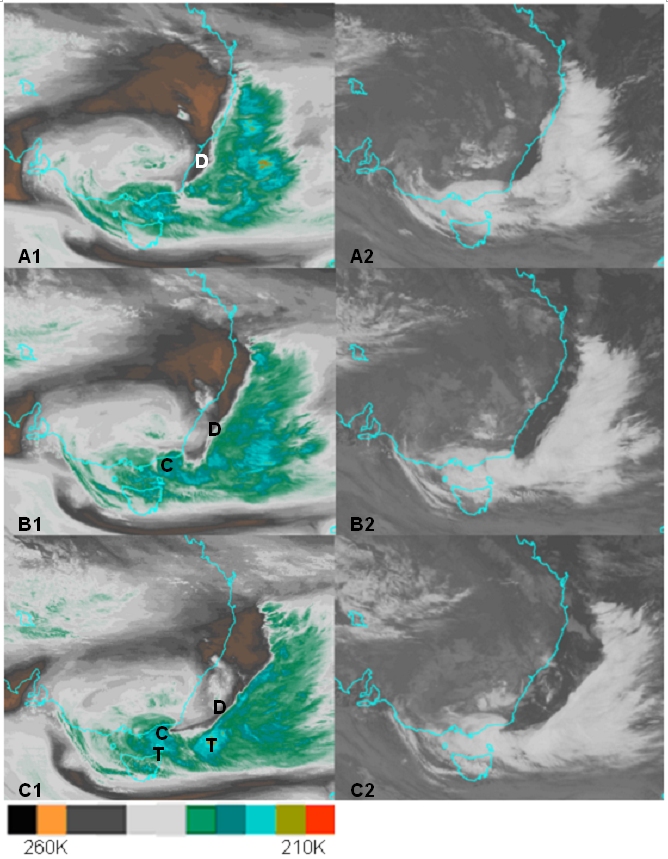
Tasman Sea explosive cyclogenesis event of the 12 June 2013 in MTSAT-2 enhanced water vapour and infrared channels at 1332UTC (A1, A2), 1632UTC (B1, B2) and 1932UTC (C1, C2).The period of explosive cyclogenesis occurred between 14-17 UTC. Location of the dry slot (D) and comma cloud (C) and deep convection in the region of EXCY (T) is shown.
The figure below shows the development of a high amplitude trough in the upper troposphere as this is undercut by a ridge to poleward to evolve into a negatively tilted upper trough. The axis of such a trough is oriented from the southwest to northeast in the direction from poleward to equatorwards in the southern hemisphere. This involuted upper trough and the associated downstream upper ridge is a characteristic synoptic structure that often accompanies explosive cyclogenesis over the Australian region.
|
|
Figure 4: Top images CIMSS Tropical Cyclone Team, bottom image G.Feren BOM.
|
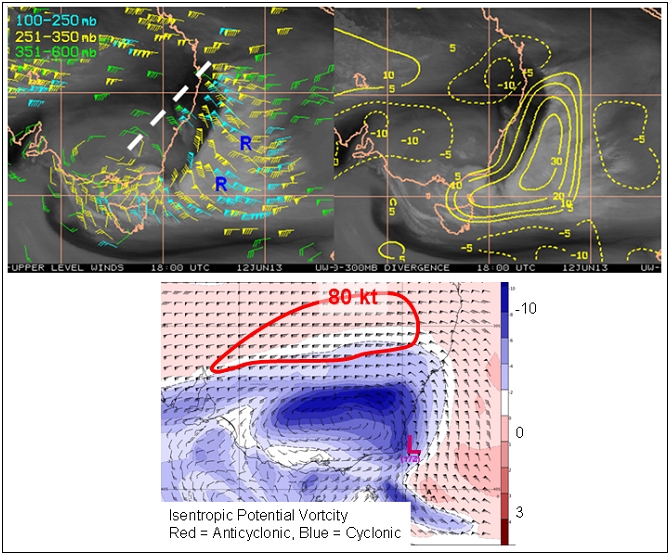
The Tasman Sea explosive cyclogenesis event of the 12 June 2013. 18 UTC upper level winds superimposed on MTSAT-2 water vapour image in the left hand panel. This shows the involuted trough axis (white dashed line) and the downstream ridge (R). The right hand panel shows the 150-300 hPa divergence (solid contours) indicating the strongly divergent upper flow to the east of the trough. Lower image shows US GFS theta 320K Isentropic Potential Vorticity and wind, illustrating the location of the jet, cyclonic IPV and the surface low (L) in relation to the area of strong upper divergence and the trough.
Other features that are often associated with explosive cyclogenesis include "transverse cloud banding" and the "striated delta" which is a subset of the former. Transverse banding in clouds is often seen in the cirrus shield associated with the warm conveyor belt in extratropical cyclones. The bands often occur during or after intensification of weather systems.
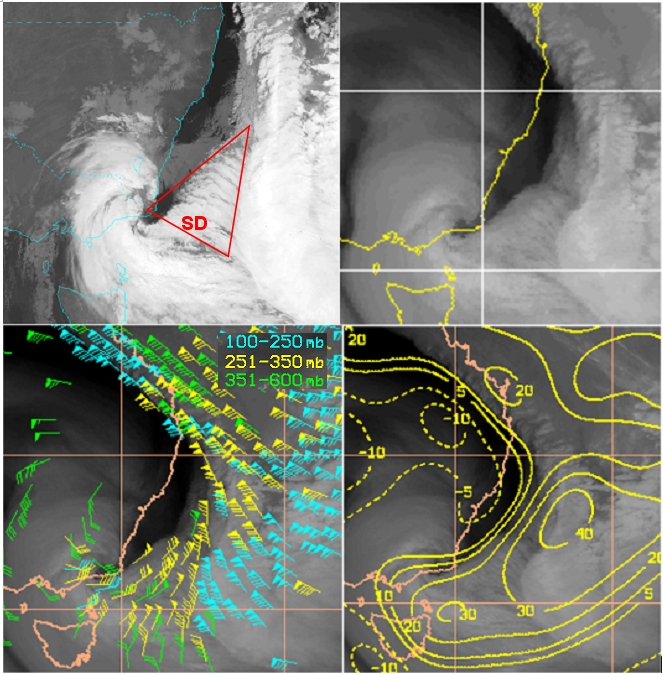
The "striated delta" is an upper tropospheric delta shaped cloud with a banded structure normally 250-500km across at its base and roughly twice as long. The banded structure is oriented at right angles to the upper level flow. This cloud feature develops in the diffluent exit region of a prominent jet streak and often (73% of studied cases) precedes episodes of major cyclogenesis.
|
|
Figure 5: Images, top left hand NOAA-12 courtesy NOAA and G.Feren, the others CIMSS Tropical Cyclone team
|
The striated delta cloud (SD) associated with explosive cyclogenesis over the western Tasman Sea on the 26th June 2007. In the 17UTC NOAA-12 infrared image and the 18UTC MTSAT-2 water vapour image, in the top left and right panels respectively. Also shown are upper level winds and 150-300 hPa divergence (solid contours) shown in the bottom left and right panels respectively. This indicates an environment of strongly diffluent and divergent wind flow
|
|
Figure 6: RHS image courtesy G. Feren BOM
|
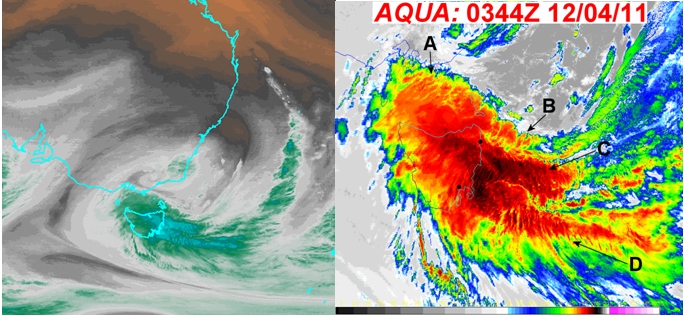
Transverse banding associated with the Tasmanian severe weather event of the 12 April 2011. MTSAT-2 enhanced water vapour and infrared image at 0344 UTC in the left and right panel respectively. Banding A initiated in a region of anticyclonic absolute vorticity/inertial instability, banding B coincided with a region of very strong cyclonic vorticity advection, banding C initiated and maintained within a region of more intense/extensive anticyclonic absolute vorticity/inertial instability connected to the jet streak, banding D is short lived and its relationship to upper level forcing is less certain.
The use of water vapour imagery in monitoring explosive cyclogenesis over the Australian region is limited by the presence of the subtropical ridge over continental Australia with associated dry mid to upper atmosphere. This can limit the resolution of important upper air features characteristic of explosive cyclogenesis as shown in the figure below. In these cases other observations and model data must be used in the analysis of explosive cyclogenesis.
|
|
Figure 7: Images courtesy BOM/JMA
|
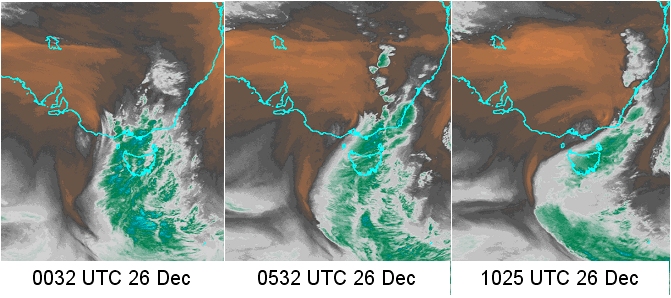
The explosive cyclogenesis event of the 1998 "Sydney to Hobart Yacht Race Storm" in the GMS-5 water vapour channel. Evident is the lack of a clear signal defining upper atmosphere synoptic structure over the northern (continental) part of the system.
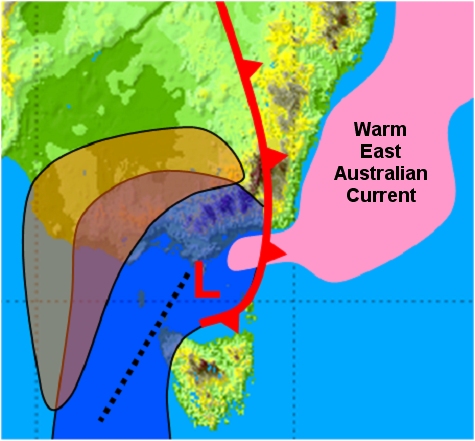
Cloud signatures corresponding to developing gale or storm force winds associated with explosive cyclogenesis can sometimes be detected in visible satellite imagery. An example is shown below, with tight cumulus banding near the centre of the intense low pressure system and the transverse mountain waves to the lee of the Great Dividing Range. Microwave scatterometer data are also useful in verifying this, in particular because many episodes of Australian explosive cyclogenesis occur over maritime regions, as shown in the “Geographical Location” section. In addition, microwave radiation readily penetrates the cloud and areas of heavy precipitation associated with centres of explosive cyclogenesis. Finally, satellite derived sea surface temperature over the western Tasman Sea will give an indication of nearshore sea surface temperature gradients associated with the active East Australian Current. These sea surface temperature gradients play an important role in explosive cyclogenesis of East Coast Lows.
|
|
Figure 8: Images courtesy BOM/JMA
|
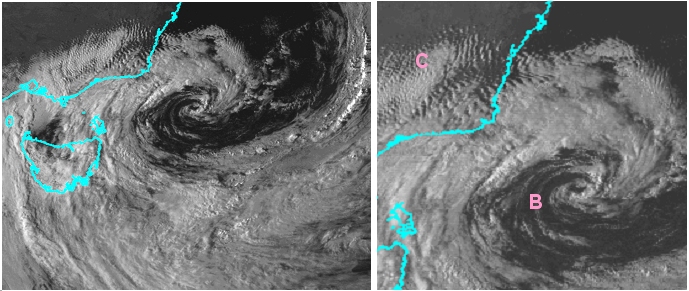
GMS-5 satellite visible image from 0632UTC of the 27 December 1998 showing the intense low pressure system of the 1998 "Sydney to Hobart Yacht Race Storm". The tight cumulus cloud banding near the centre of the low (B) and the lee waves to the Australian Great Dividing Range (C) are shown.
|
|
Figure 9: Images from NOAA/STAR
|
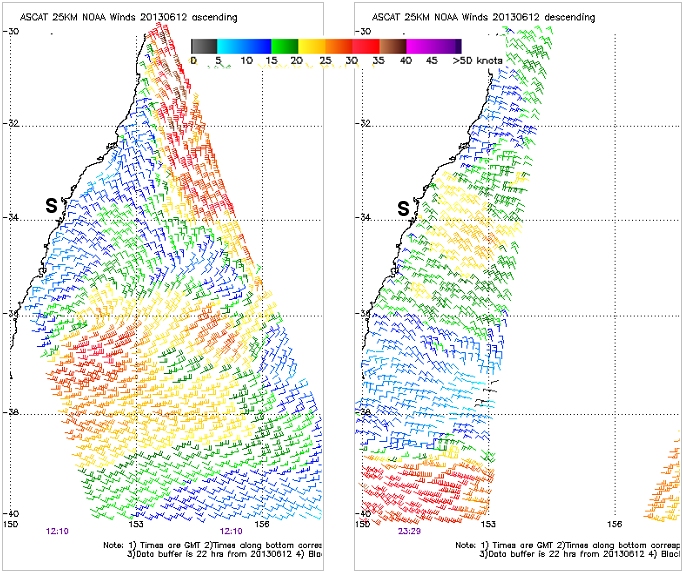
ASCAT microwave scatterometer scans over the western Tasman Sea corresponding to the explosive cyclogenesis event of 12 June 2013. Left hand panel corresponds to 1210UTC ASCAT pass, right hand panel is from the 2359UTC pass.
Meteorological Physical Background
Broad Overview
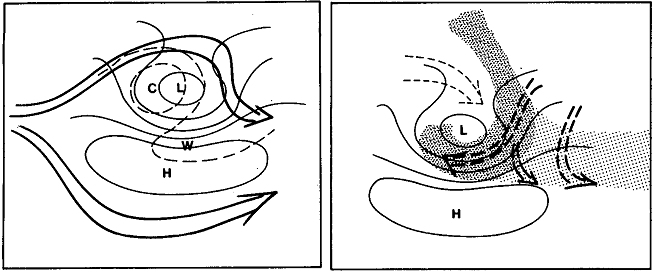
The Tasman Sea low pressure systems that undergo EXCY are frequently embedded in "cyclonic undulations" within the low level easterly flow often referred to as "Easterly dips". A schematic of major upper and low level features of an "Easterly dip" are shown in the figure below.
An Easterly dip typically develops under or downstream of a mid tropospheric cold core cyclone which has its origins as a cutoff low in the westerlies. An easterly dip often lies between two diffluent jet streams.
To the east of the low pressure centre low level tropical air rises and splits to flow around the poleward side of the cyclone or join the jetstream flow in a warm conveyor belt. Mid tropospheric air subsides around the equatorward side of the low pressure centre.
Considerable upper-level baroclinicity provides the main energy source for development of cyclogenesis. Interestingly, for many Tasman Sea low pressure systems, low level changes occur in the subtropical airmass with no distinct thermal front forming at the surface. Instead, deformation fields produce distinct moisture gradients at the surface, which are enhanced by differences in dry continental and moist maritime tropical air along the coast and differential isentropic vertical motion.
|
|
Figure 10: Images from Holland et al. 1987
|
Schematics of the major features of an "Easterly Dip". Left - surface isobars (solid lines), 1000-500 hPa thickness contours (dashed lines), and diffluent upper atmosphere jet streaks (long arrows)
Right - surface isobars, stratiform cloud with embedded convection - the Warm Conveyor Belt (heavy stipple), stratiform cloud (light stipple) and wet bulb isentropic potential trajectories with downward motion along the dashed arrow and upward motion along the broken bold arrows.
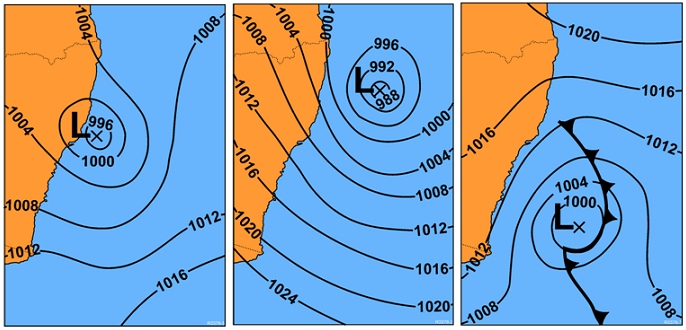
Examination of Tasman Sea low pressure systems over the period 1970-2006 reveal that 92% of Tasman Sea explosive low pressure systems can be subdivided into three classes by synoptic type, Waves on a Front (40%), Inland Troughs (33%) and Easterly Troughs (19%) as shown below. These three classes include 81% of all Tasman Sea low pressure systems.
|
|
Figure 11: Diagrams from Speer et al. 2009
|
Mean sea level pressure synoptic patterns commonly associated with explosive Tasman Sea lows. Inland trough low (left), easterly trough low (center) and wave on a front low (right).
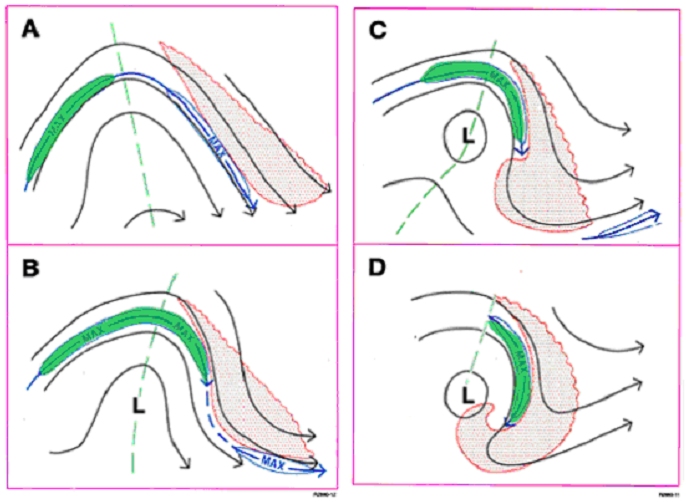
In summarizing many explosive cyclogenesis events associated with East Coast Lows the following developments are seen to be important.
In the upper levels of the troposphere an amplifying trough over eastern Australia moves eastwards towards the Tasman Sea with a jet-streak propagating around the apex of this trough. This synoptic system may transition to a negatively tilted trough if the trough is undercut by a high amplitude ridge on the poleward side.
In the low levels a pre-existing trough or cold front is located over eastern Australia or the western Tasman Sea, adjacent to the eastern seaboard of Australia. Interestingly, the trough or cold front may have an extensive cloudband associated with it prior to its movement across the eastern seaboard of Australia.
The interaction of the strong upper tropospheric potential vorticity anomaly associated with the propagating jet with the low level potential vorticity anomaly associated with the trough / cold front results in pressure falls at the surface and the commencement of explosive cyclogenesis. Indeed, explosive cyclogenesis over southeastern Australia and adjacent maritime regions often occurs near the forward exit region of a 300 hpa jet streak as shown in the below diagrams.
Other factors that contribute to EXCY include the meridional temperature gradient between the Tasman Sea and the adjacent Australian seaboard, the effect of the Great Dividing Range and the low static stability of the atmosphere along the east coast of Australia.
There is a temperature gradient between the cold nearshore waters and the warm offshore eddies of the East Australian current as well as the cool nocturnal land and the warm offshore waters. Therefore the low levels of the atmosphere along the east coast of Australia have low static stability with the warm surface temperature of the East Coast Current providing boundary layer sensible and latent heat.
The Great Dividing Range, inland from the east Australian seaboard may interact with a developing baroclinic wave (lee cyclogenesis). This may position the low pressure system or generate a secondary low in the lee of the range.
Interestingly in a number of cases of EXCY involving East Coast Lows the parent surface low pressure system and associated cloud band may already have developed to the point of advanced occlusion prior to the EXCY episode.
Sometimes rapid descent of the very dry jetstream air at the front of the jet and its interaction with the moisture in the cloud head results in evaporative cooling. This enhances the descent and may permit the jet to reach the earth's surface as a "Sting Jet".
|
|
Figure 12: Diagrams courtesy G.Feren BOM
|
Schematic diagram showing changes in the mid-upper level synoptic pattern leading to explosive cyclogenesis for many East Australian mid-latitude cyclones. Flow at 300 hPa as black lines, jet axis in blue, the relevant jet streak is shown in green and developing cloud band / comma cloud in red.
Schematic diagrams summarising EXCY for East Coast Lows that involve low level troughs and waves on a front are shown below.
|
|
Figure 13: Schematic diagrams summarising EXCY for East Coast Lows.
|
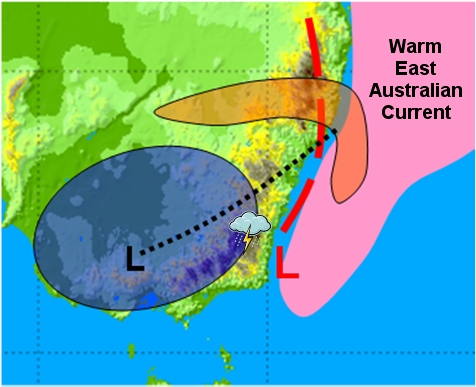
Schematic summarising the recipe for an EXCY episode for an East Coast Low involving a surface trough along the east Australian coast modelled on the example of the 12/13 June 2013.
Rapidly deepening surface low and associated trough in red. Cold pool as defined by closed geopotential height contour at 300 hPa in blue. Upper low and associated involuted upper trough in black. Location of the jet (winds > 80 knots at 300 hPa) in orange. On the poleward flank of the low moist warm air moves westwards over the Great Dividing Range and this can generate convection.
|
|
Figure 14: Schematic summarising the recipe for an EXCY episode.
|
Schematic summarising the recipe for an EXCY episode for an East Coast Low involving a wave forming on a surface cold front modelled on the example of the 26 December 1998 at 12UTC.
Rapidly deepening surface low and associated cold front in red. Cold pool as defined by 1000-500 hPa thickness and 300 hPa winds in blue. Upper trough axis as a black dotted line. Location of the jet (winds > 80 knots at 300 hPa) in orange.
Geographical Location
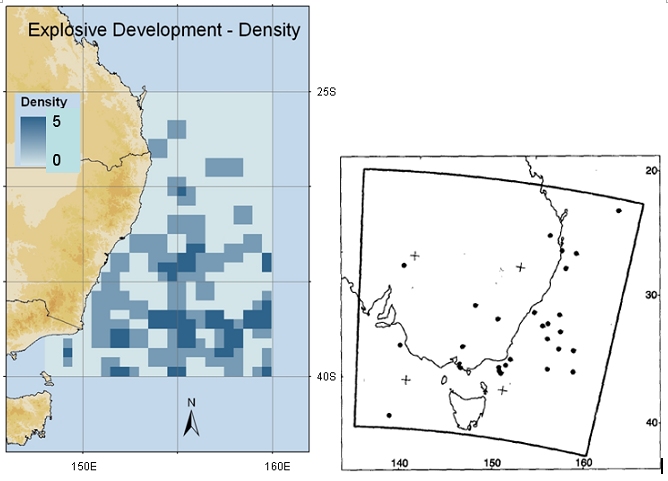
Location of explosive lows in the western Tasman Sea and locations of developing cyclones with accompanying striated delta cloud features are shown in the figures below.
|
|
Figure 15: LHS diagram Speer et al. 2009, RHS diagram Feren 1995
|
Left hand panel: density of explosive lows (>10hPa in 24 hours) in the western Tasman Sea, 1970-2006. Right hand panel: Formation position for developing "striated delta cloud" associated with major cyclogenesis (solid dots). The location of these dots correspond to approximate midpoint of cloud systems.
Seasonal variety
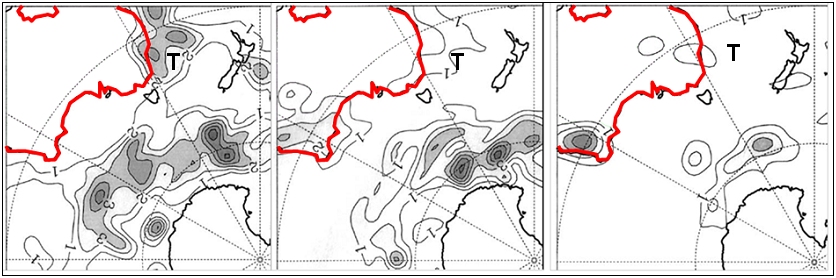
Seasonal variations in the occurrence of explosive cyclogenesis is shown in the diagrams below. Explosive cyclogenesis over the Australian region occurs predominantly over southern and eastern parts of the continent and adjacent waters during the late autumn and winter months and over the western Australian region during the summer months.
|
|
Figure 16: Diagram from Lim and Simmonds 2002
|
Mean southern hemisphere explosive cyclone system density during the months JJA (left), SON (center), DJF (right). Statistics for the months of MAM are not shown as during these months explosive cyclones occur well to the south of the Australian continent. The contour interval is 1x10⁻⁵ explosive cyclones (degree latitude)-2. Continental Australia is outlined in red. The statistics are evaluated using the "relative central pressure technique".
|
|
Figure 17: Diagram from Speer et al. 2009
|
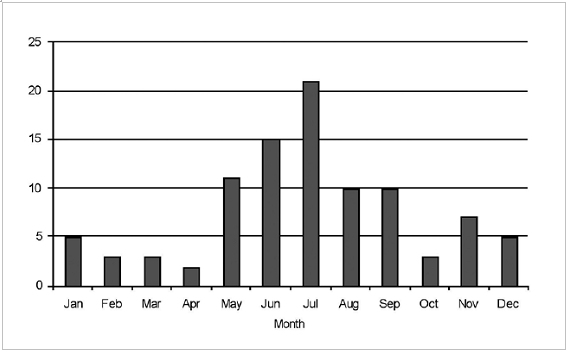
Monthly distribution of synoptic lows with explosive development (>10hPa in 24 hours) in the western Tasman Sea over the period 1970-2006.
Life Cycle
The evolution of a typical East Coast Low EXCY event is shown in the figure below.
48 to 72 hours prior to the explosive development, an upper-tropospheric split-jet, or blocking pattern, with a positively tilted high-amplitude trough or cut-off low over southeastern Australia is often observed.
The next stage is the development of a southerly jet streak on the western side of the positively tilted trough over eastern Australia. The strong upper atmospheric potential vorticity anomaly associated with the exit region of the jet interacts with the low level vorticity anomaly associated with the low level trough or cold front and the explosive cyclogenesis episode commences. Strong temperature gradients between the cold/cool nocturnal land and the warm ocean of the East Australian Current early in the morning often coincide with the main episode of cyclogenesis. In the mid to upper levels of the atmosphere this synoptic system may transition to a negatively tilted trough if the trough is undercut by a high amplitude ridge on the poleward side.
Explosively intensifying extratropical cyclones may persist for the duration of a day or for several days.
The explosive deepening phase of these cyclones tends to occur on temporal and spatial scales of a few hours to half a day and a few hundred kilometres with deepening rates of 10 hPa or more in six hours. During the late mature stage the surface low moves under the upper low and fills. Alternatively, the system may be sheared by a newer developing system or opened and filled in advance of an approaching trough. East Coast Lows may also weaken when moving over waters with cooler sea surface temperatures.
Systems undergoing explosive cyclogenesis in the Australian region generally move to the southeast.
|
|
Figure 18: Diagram from Mills et al. 2010
|
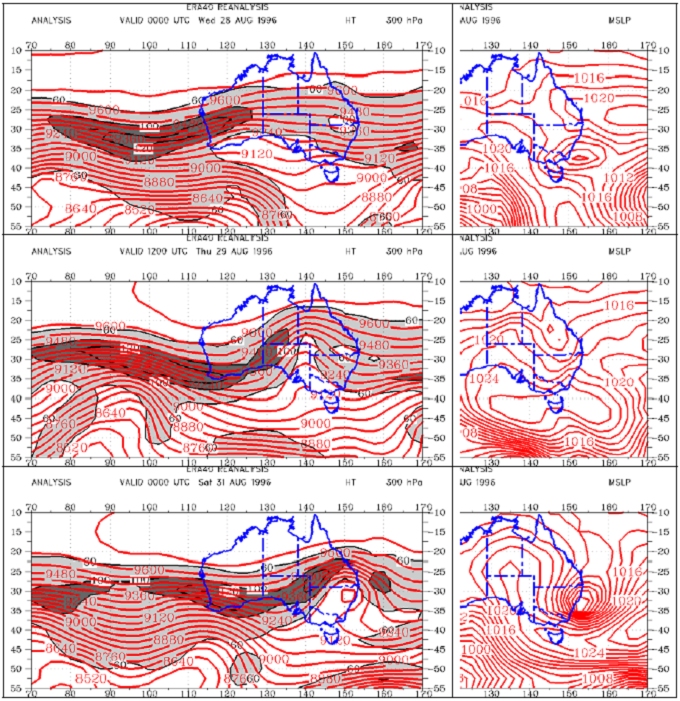
A typical sequence of surface and upper air developments leading to explosive cyclogenesis over southeastern Australia as illustrated by the East Coast Low of the 31st August 1996.
Left panels: 300 hPa geopotential height and wind speed for 00UTC 25 August (top), 12UTC 29 August (center) and 00UTC 31 August (bottom). Light shading in the isotachs corresponds to winds above 60 knots, dark shadings above 100 knots.
Right panels: Mean sea level pressure contours at every 2hPa.
Key Parameters
- Sea surface temperature, especially strong gradients in sea surface temperature accentuated by cold land temperatures during winter nights.
- Mean sea level pressure. Isobar analysis and forecasts resolves low pressure centres and troughs. Deepening in the central mean sea level pressure of a low pressure system can assist in monitoring the explosive cyclogenesis.
- Temperatures at 850, 700 hPa. These parameters permit monitoring of the development of low level horizontal temperature gradients, especially in the east-west direction around the centre of a developing low. This resolves the characteristic low level warm air / cold air dipole that is an important attribute of explosive cyclogenesis.
- Temperature advection at 850 and 700 hPa. The field of temperature advection shows a very distinct situation for a wave: a maximum of warm advection within the cloud head and the relevant parts in front, and cold advection behind. This pronounced warm advection / cold advection dipole is a sign of the ongoing cyclogenesis.
- Thickness 1000-500 hPa. Height contours at 1000 hPa: During the initial stages of development the absolute topography shows a continuously deepening trough. The mature stage is characterized by a surface low situated in the cloudless area of the dry tongue between the cloudiness of the Cold Front and the cloud head, the latter being situated to the rear side of the low. The height contours at 500 are perpendicular to the height contours at 1000 hPa indicating the cyclogenesis in the developing stage of explosive cyclogenesis.
- Winds at 300, 400, 500 hPa. Windbarbs and isotachs, in particular the wind speed threshold above 50 m/s. The isotachs at 300 hPa show a pronounced jet stream along the rear edge of the frontal cloud band. The cloud head can often be found within the right exit region of a jet streak situated downstream of the low. The presence of a jets having wind speed greater than 50 m/s at 300 hPa often correlates with developing explosive cyclogenesis.
- Potential Vorticity (Isentropic and Isobaric), in particular the values of the dynamical tropopause (between -1 and -2 PV unit surface in the southern hemisphere). The potential vorticity shows an anomaly (values between one and two units) along the rear cloud edge of the cold front. The anomaly, which separates the tropospheric from the stratospheric air, can be found below 400 hPa in cases of explosive cyclogenesis. Gradients in potential vorticity often closely correspond with gradients in brightness temperature in water vapour imagery and the satellite imagery can therefore be used for model verification.
- Vorticity advection at 500, 300 hPa. The field of vorticity advection shows a pronounced cyclonic vorticity advection maximum at 500 as well as at 300 hPa mostly situated within the area of the cloud head. The maximum can be found in the area of the right exit of the jet streak.
- Divergence at 300, 400 hPa. Upper forcing is especially pronounced on the downstream sector of a high amplitude negatively-tilted upper trough
|
|
Figure 19: The "Pasha Bulker" east coast low of 8 June 2007, showing important upper and low level parameters. Images courtesy BOM
|
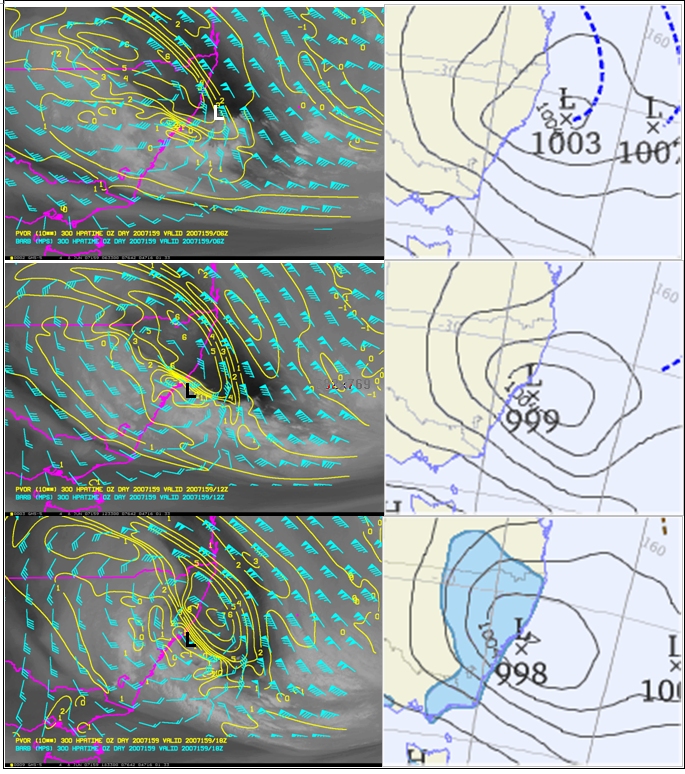
Left panels: 300 hPa winds and potential vorticity overlain on GMS5 water vapour imagery at times 06UTC 8 June (top), 12UTC (middle), 18UTC (bottom). The location of the surface low pressure system at the same time is shown as "L".
Right panels: MSLP pattern of the corresponding times. The bottom panel also shows the area of the preceding 24 hour rainfall.
Typical Appearance In Vertical Cross Sections
- Wind (barbs and isotachs). The isotachs show a pronounced jet stream along the rear edge of the frontal gradient of the cold front. The cloud head can often be found within the right exit region of a jet streak situated downstream of the low (in the southern hemisphere). A maximum of the isotachs is often present at the poleward side of the cloud head.
- Potential Vorticity (Isentropic and Isobaric). Potential vorticity shows an anomaly protruding deep into the troposphere or to the rear of the zone of the highest gradient of the isentropes of the cold front. This lowering of the so-called dynamical tropopause (-1 to -2 PV Units) is already clearly seen in the initial stage of explosive cyclogenesis, where the tropopause height sinks below 400 hPa. In mature stages the tropopause is often below 500 hPa and in extreme cases below 700 hPa. This Northern Hemisphere rule may need to be modified for the lower latitude / deeper troposphere over the Australian region and the lower intensity and atmospheric depth of Southern Hemisphere bombs.
- Equivalent Potential Temperature. This parameter assists in identifying areas of low level instability, for example upper level dry air over-running low level moist air.
- Relative humidity. Within the dry tongue low values of relative humidity can be found to relatively low levels in the atmosphere.
- Temperature advection. The field of temperature advection shows a very distinct and pronounced signature. There is a maximum of warm advection within and in front of the cloud head, and cold advection directly behind it.
- Vorticity advection. The field of vorticity advection shows a pronounced cyclonic vorticity anomaly maximum at upper levels, mostly situated within the area of the cloud head and an anticyclonic vorticity anomaly maximum on the other side of the dry tongue in the gradient zone of the cold front. Both correlate well with the right and left exit regions (in the Southern Hemisphere) of the dominating jet streak.
|
|
Figure 19: The "Pasha Bulker" east coast low of 8 June 2007, showing important parameters in vertical cross section.Images courtesy BOM
|
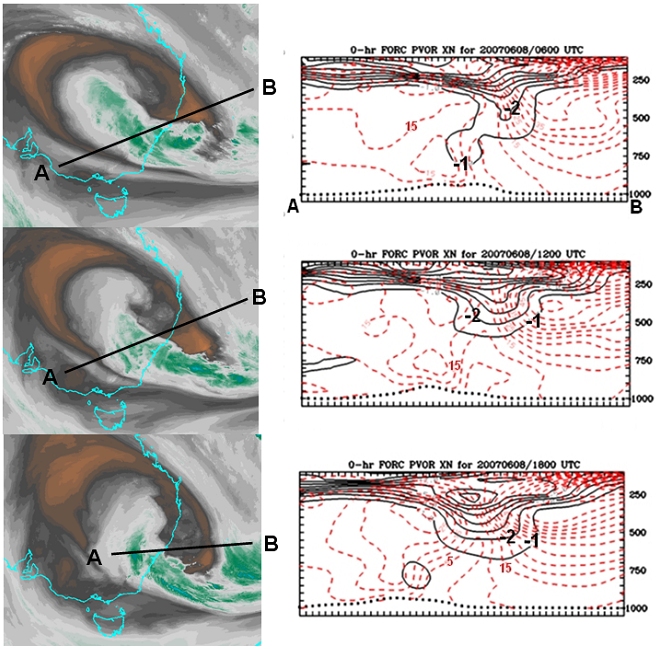
Left: The position of the Vertical Cross Section. Right: Isentropic Potential Vorticity (black contours), wind speed (dashed red contours).
Left panels: Enhanced water vapour imagery showing the location of the cross sections in the right panels. Satellite images and model data at times 06UTC 8 June (top), 12UTC (middle), 18UTC (bottom).
Right panels: isentropic potential vorticity (black lines, K) and wind speed (red, m s-1) of the corresponding times.
Weather Events
|
|
Figure 20: Schematic of weather associated with the EXCY events of 12 June 2013 (top), 26-27 December 1998 (center) and 26 June 2007 (bottom) with corresponding satellite images.
|
|
|
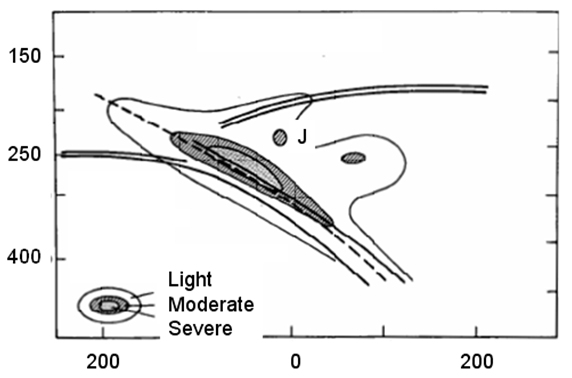
Figure 20: Turbulence associated with a sharp trough. J = jet core. Dashed line is the trough line. Double line is the tropopause.
|
| Parameter | Description |
|---|---|
| Precipitation |
|
| Temperature |
|
| Wind (incl. gusts) |
|
| Marine conditions |
|
| Other relevant information |
|
|
|
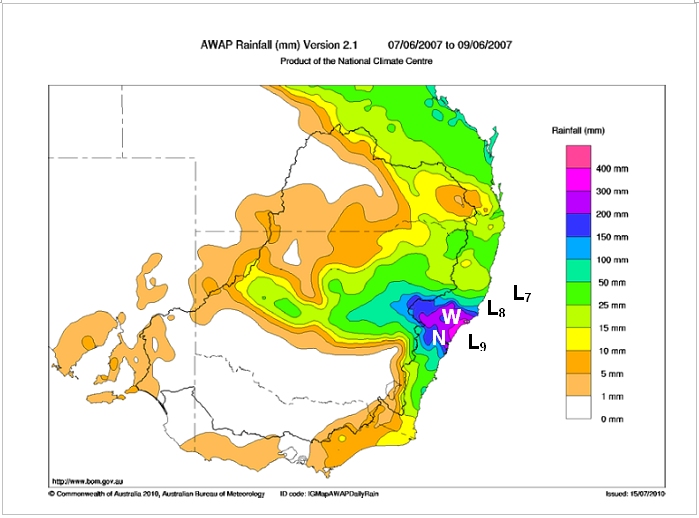
Figure 21: Three-day rainfall to 0900 EST 9 June 2007 from the Australian Water Availability Project rainfall analyses. Location of the surface low at 00 UTC 7 June (L7), 00 UTC 8 June (L8) and 00 UTC 9 June (L9) as shown. The location of Williamtown and Norah Head are also shown. Diagram from Mills et al. 2010
|
|
|
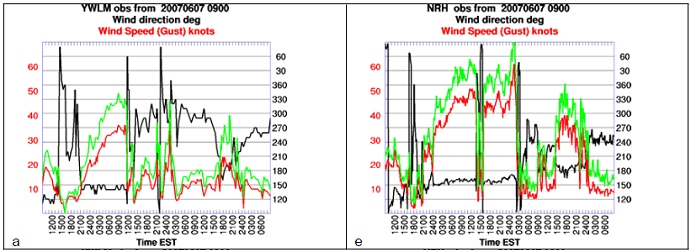
Figure 21: Seventy two hour meteograms starting at 0900 EST 7 June 2007 from Williamtown (left) and Norah Head (right). These locations are shown in the previous figure. Wind direction in black, wind mean (10 minute) in red, gusts in green.Diagram from Mills et al. 2010
|
References
- Buckley B.W., Leslie L.M. 2000: The Australian Boxing Day Storm of 1998 - Synoptic Description and Numerical Simulations. Weather and Forecasting, October 2000, pp. 543-558
- CIMMS Tropical Cyclone Team: Cooperative Institute for Meteorological Satellite Studies Space Science and Engineering Center / University of Wisconsin-Madison. http://tropic.ssec.wisc.edu/ accessed December 2013
- Endlich R.M 1963: The detailed structure of the atmosphere in regions of clear air turbulence. Stnanford Research Institute, Final Report, Contract Cwb-10324, 62pp. Internet reference http://www.bom.gov.au/amm/docs/1964/reiter.pdf accessed January 2014
- Feren G. 1995: The "Striated Delta" Cloud System - A Satellite Imagery Precursor to Major Cyclogenesis in the Eastern Australian-West Tasman Sea Region. Weather and Forecasting Vol.10, pp.286-309
- Foley G.R., Hanstrum B.N. 1994: The capture of Tropical Cyclones by Cold Fronts off the West Coast of Australia. Weather Forecasting, 9, pp.577-592.
- Hadlock R., Kreitzberg C.W. 1998: The Experiement on Rapidly Intensifying Cyclones over the Atlantic (ERICA) Field Study: Objectives and Plans. Bulletin of the American Meteorological Society. Vol. 69, No.11. pp.1309-1320
- Holland G.J., Lynch A.H., Leslie L.M. 1987: Australian East Coast Cyclones. Part 1: Synoptic Overview and Case Studies. Monthly Weather Review, V115, pp.3024-3036.
- KNMI and ZAMG: Manual of Synoptic Satellite Meteorolgoy "Rapid Cyclogenesis" http://www.knmi.nl/ and http://www.eumetrain.org/satmanu/CMs/RaCy/index.htm accessed December 2013
- Knox J.A, Bachmeier A.S, Carter W.M., Tarantino J.E., Paulik L.C., Wilsion E.N., Bechdol G.S., Mays M.J, 2010: Transverse cirrus bands in weather systems: a grand tour of an enduring enigma. Weather February 2010, Vol.65, No.2
- Knox J.A, Bachmeier A.S, Carter W.M., Tarantino J.E., Paulik L.C., Wilsion E.N., Bechdol G.S., Mays M.J, 2010: Transverse cirrus bands in weather systems: a grand tour of an enduring enigma. Weather February 2010, Vol.65, No.2
- Leslie L.M., Speer M.S. 1998: Short Range Ensemble Forecasting of Explosive Australian East Coast Cyclogenesis. Weather Forecasting 13, pp. 822-832.
- Lim E., Simmonds I. 2002: Explosive Cyclone Development in the Southern Hemisphere and a comparison with the Northern Hemisphere Events. Monthly Weather Review, Vol 130, pp. 2188-2209.
- Mills G.A, Webb R., Davidson N.E., Kepert J., Seed A. and Abbs D. 2010: The Pasha Bulker east coast low of 8 June 2007. CAWCR Technical Report No.023. Internet address http://www.cawcr.gov.au/publications/technicalreports/CTR_023.pdf accessed December 2013
- NOAA NESDIS / STAR Center for Satellite Application and Research. http://manati.star.nesdis.noaa.gov/datasets/ASCATData.php accessed December 2013
- Sanders F., Guyakum J.R. 1980: Synoptic-Dynamic Climatology of the "Bomb". Monthly Weather Review, 108, pp1589-1606.
- Simmonds, I., and X. Wu, 1993: Cyclone behaviour response to changes in winter Southern Hemisphere sea-ice concentration. Quarterly Journal of the Royal Meteorological Society., 119, 1121-1148.
- Sinclair M.R. 1995: A Climatology of Cyclogenesis for the Southern Hemisphere. Monthly Weather Review Vol 123 pp.1601-19
- Sinclair M.R., Revell M.J. 2000: Classification and Composite Diagnosis of Extratropical Cyclogenesis Events in the Southwest Pacific. Monthly Weather Review. Vol 128, pp. 1089-1105.
- Speer, M., P. Wiles, and A. Pepler, 2009: Low pressure systems off the New South Wales coast and associated hazardous weather: establishment of a database. Australian Meteorological and Oceanographic Journal, 58, 29-39.
- Wiles P. 2007: Climatology and trends in the occurrence of East Coast Lows and their impacts on NSW. Presented at the 14th National Australian Meteorological and Oceanographic Society (AMOS) Conference in conjunction with Southern Annular Mode (SAM) Workshop.