Weather Events
|
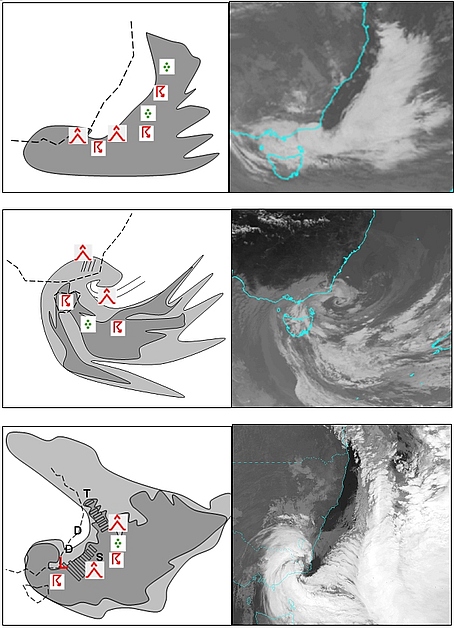
Figure 20: Schematic of weather associated with the EXCY events of 12 June 2013 (top), 26-27 December 1998 (center) and 26 June 2007 (bottom) with corresponding satellite images.
|
|
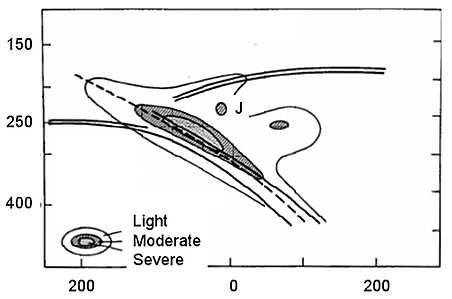
Figure 20: Turbulence associated with a sharp trough. J = jet core. Dashed line is the trough line. Double line is the tropopause.
|
| Parameter | Description |
|---|---|
| Precipitation |
|
| Temperature |
|
| Wind (incl. gusts) |
|
| Marine conditions |
|
| Other relevant information |
|
|
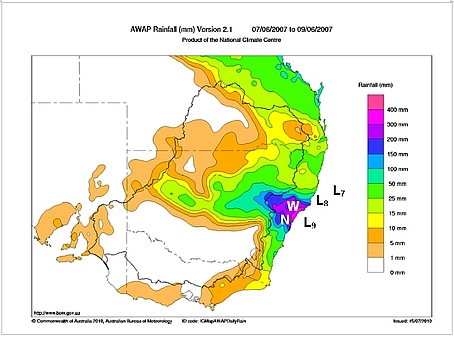
Figure 21: Three-day rainfall to 0900 EST 9 June 2007 from the Australian Water Availability Project rainfall analyses. Location of the surface low at 00 UTC 7 June (L7), 00 UTC 8 June (L8) and 00 UTC 9 June (L9) as shown. The location of Williamtown and Norah Head are also shown. Diagram from Mills et al. 2010
|
|
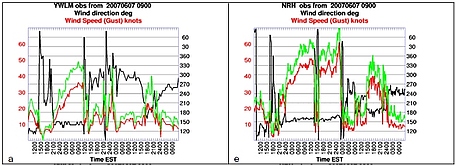
Figure 21: Seventy two hour meteograms starting at 0900 EST 7 June 2007 from Williamtown (left) and Norah Head (right). These locations are shown in the previous figure. Wind direction in black, wind mean (10 minute) in red, gusts in green.Diagram from Mills et al. 2010
|


