Cloud Structure In Satellite Images
Explosive Cyclogenesis occurs in a variety of synoptic settings, including low level troughs with embedded low pressure systems in the Tasman Sea as well as a "wave on a front low" (see Meteorological / physical background section). The life cycle of Explosive Cyclogenesis over the region of southeastern Australia ranges from 6 to 48 hours though EXCY in the Tasman Sea often occurs over only 6 hours. In the examples studied so far, EXCY often occurs within developed cloud spirals indicating an advanced occlusion process. Common features that are often seen in association with explosive cyclogenesis in satellite imagery include:
- Dry slot
- A "Comma Cloud" type feature
- High amplitude upper trough. This may be undercut by a high amplitude ridge on the poleward side to evolve into a negatively tilted (involuted) trough.
- Transverse cloud banding, including the striated delta cloud
- Low level cloud features (eg. tight cumulus banding near the centre of the low) as can be seen in visible imagery.
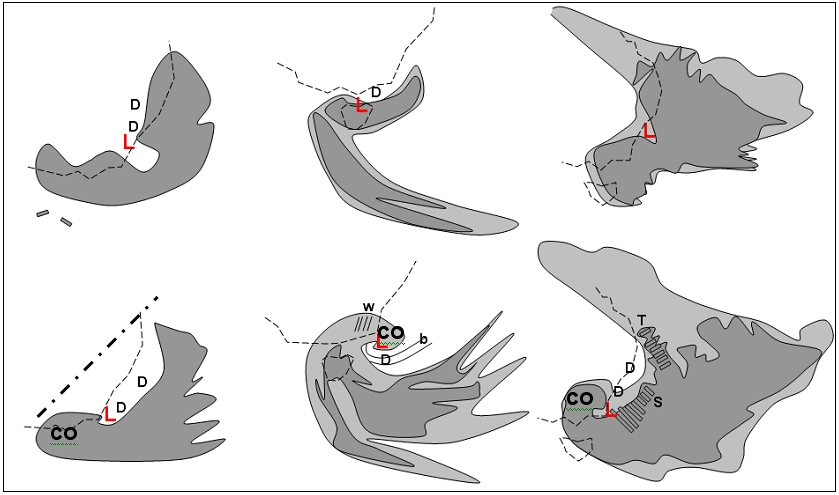
Schematic diagrams of cloud signatures of three EXCY episodes are shown below.
|
|
Figure 2:Schematic diagrams of cloud signatures of three EXCY episodes
|
Schematics of cloud signatures of the EXCY episodes of 12 June 2013 (LHS, top 1032UTC, bottom 1832UTC) 26-27 December 1998 (centre, top 1532UTC, bottom 0332UTC), and 26 June 2007 (RHS, top 0600UTC, bottom 1800UTC). Top schematics show the cloud signatures prior to the EXCY episode, bottom schematic show the cloud signatures during the EXCY episode. Light grey shows low to mid level cloud tops, dark grey shows high level cloud tops. Involuted upper atmospheric trough axis for the 12 June example is annotated by a bold dot-dash line. L = position of the surface low pressure system, D = dry slots in the water vapour imagery, b = tight concentric banding of cumulus cloud around the low in visible imagery, w = mountain waves in visible imagery, c = cellular cloud tops (visible and infrared imagery), co = comma cloud, T = transverse waves developing in warm conveyor belt (vis, ir, wv). S = striated delta cloud developing in warm conveyor belt (vis, ir, wv). Coastline is shown as a thin dashed line.
|
|
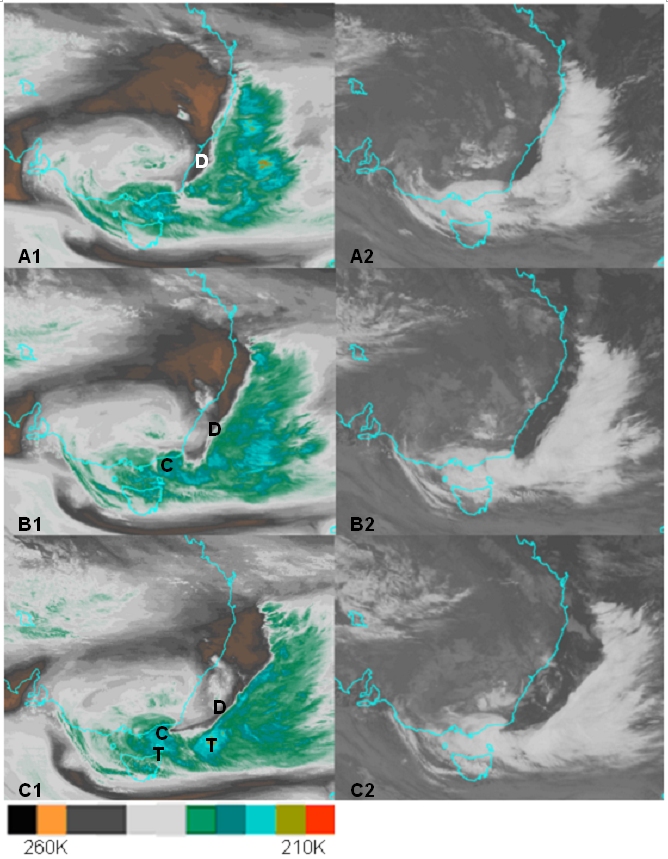
Figure 3: Images courtesy Japan Meteorological Agency (JMA) and Australian Bureau of Meteorology (BOM).
|
Tasman Sea explosive cyclogenesis event of the 12 June 2013 in MTSAT-2 enhanced water vapour and infrared channels at 1332UTC (A1, A2), 1632UTC (B1, B2) and 1932UTC (C1, C2).The period of explosive cyclogenesis occurred between 14-17 UTC. Location of the dry slot (D) and comma cloud (C) and deep convection in the region of EXCY (T) is shown.
The figure below shows the development of a high amplitude trough in the upper troposphere as this is undercut by a ridge to poleward to evolve into a negatively tilted upper trough. The axis of such a trough is oriented from the southwest to northeast in the direction from poleward to equatorwards in the southern hemisphere. This involuted upper trough and the associated downstream upper ridge is a characteristic synoptic structure that often accompanies explosive cyclogenesis over the Australian region.
|
|
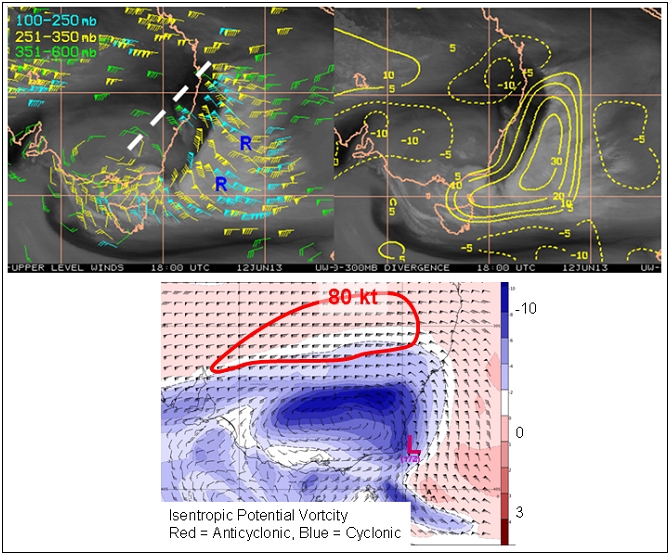
Figure 4: Top images CIMSS Tropical Cyclone Team, bottom image G.Feren BOM.
|
The Tasman Sea explosive cyclogenesis event of the 12 June 2013. 18 UTC upper level winds superimposed on MTSAT-2 water vapour image in the left hand panel. This shows the involuted trough axis (white dashed line) and the downstream ridge (R). The right hand panel shows the 150-300 hPa divergence (solid contours) indicating the strongly divergent upper flow to the east of the trough. Lower image shows US GFS theta 320K Isentropic Potential Vorticity and wind, illustrating the location of the jet, cyclonic IPV and the surface low (L) in relation to the area of strong upper divergence and the trough.
Other features that are often associated with explosive cyclogenesis include "transverse cloud banding" and the "striated delta" which is a subset of the former. Transverse banding in clouds is often seen in the cirrus shield associated with the warm conveyor belt in extratropical cyclones. The bands often occur during or after intensification of weather systems.
The "striated delta" is an upper tropospheric delta shaped cloud with a banded structure normally 250-500km across at its base and roughly twice as long. The banded structure is oriented at right angles to the upper level flow. This cloud feature develops in the diffluent exit region of a prominent jet streak and often (73% of studied cases) precedes episodes of major cyclogenesis.
|
|
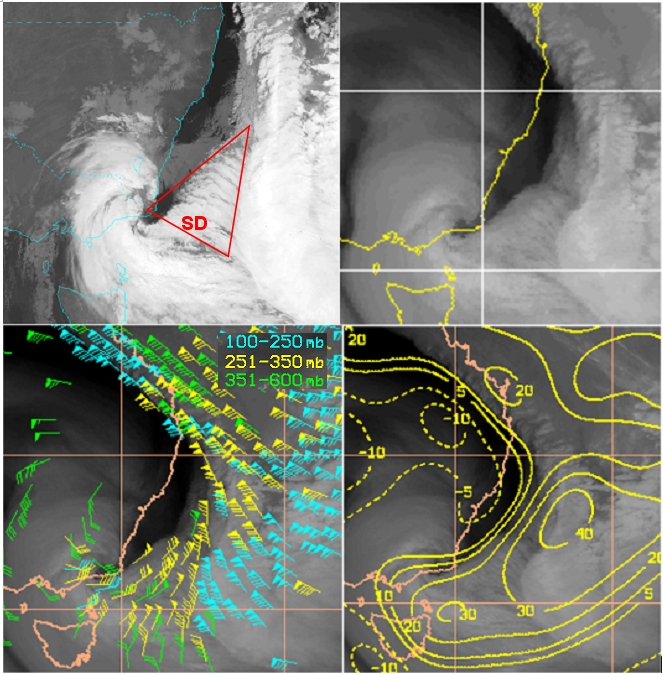
Figure 5: Images, top left hand NOAA-12 courtesy NOAA and G.Feren, the others CIMSS Tropical Cyclone team
|
The striated delta cloud (SD) associated with explosive cyclogenesis over the western Tasman Sea on the 26th June 2007. In the 17UTC NOAA-12 infrared image and the 18UTC MTSAT-2 water vapour image, in the top left and right panels respectively. Also shown are upper level winds and 150-300 hPa divergence (solid contours) shown in the bottom left and right panels respectively. This indicates an environment of strongly diffluent and divergent wind flow
|
|
Figure 6: RHS image courtesy G. Feren BOM
|
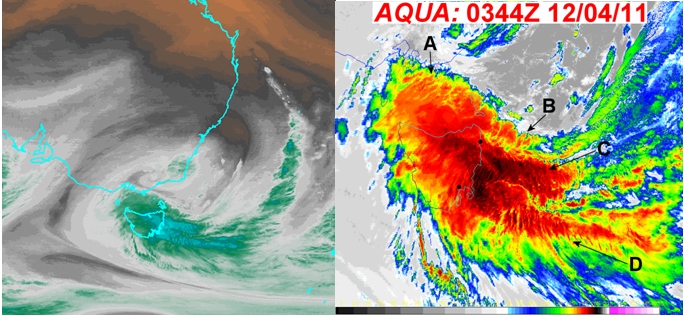
Transverse banding associated with the Tasmanian severe weather event of the 12 April 2011. MTSAT-2 enhanced water vapour and infrared image at 0344 UTC in the left and right panel respectively. Banding A initiated in a region of anticyclonic absolute vorticity/inertial instability, banding B coincided with a region of very strong cyclonic vorticity advection, banding C initiated and maintained within a region of more intense/extensive anticyclonic absolute vorticity/inertial instability connected to the jet streak, banding D is short lived and its relationship to upper level forcing is less certain.
The use of water vapour imagery in monitoring explosive cyclogenesis over the Australian region is limited by the presence of the subtropical ridge over continental Australia with associated dry mid to upper atmosphere. This can limit the resolution of important upper air features characteristic of explosive cyclogenesis as shown in the figure below. In these cases other observations and model data must be used in the analysis of explosive cyclogenesis.
|
|
Figure 7: Images courtesy BOM/JMA
|
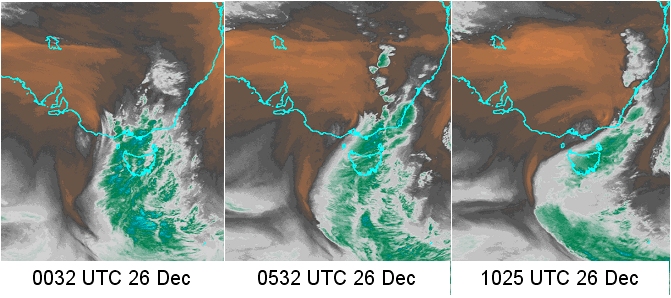
The explosive cyclogenesis event of the 1998 "Sydney to Hobart Yacht Race Storm" in the GMS-5 water vapour channel. Evident is the lack of a clear signal defining upper atmosphere synoptic structure over the northern (continental) part of the system.
Cloud signatures corresponding to developing gale or storm force winds associated with explosive cyclogenesis can sometimes be detected in visible satellite imagery. An example is shown below, with tight cumulus banding near the centre of the intense low pressure system and the transverse mountain waves to the lee of the Great Dividing Range. Microwave scatterometer data are also useful in verifying this, in particular because many episodes of Australian explosive cyclogenesis occur over maritime regions, as shown in the “Geographical Location” section. In addition, microwave radiation readily penetrates the cloud and areas of heavy precipitation associated with centres of explosive cyclogenesis. Finally, satellite derived sea surface temperature over the western Tasman Sea will give an indication of nearshore sea surface temperature gradients associated with the active East Australian Current. These sea surface temperature gradients play an important role in explosive cyclogenesis of East Coast Lows.
|
|
Figure 8: Images courtesy BOM/JMA
|
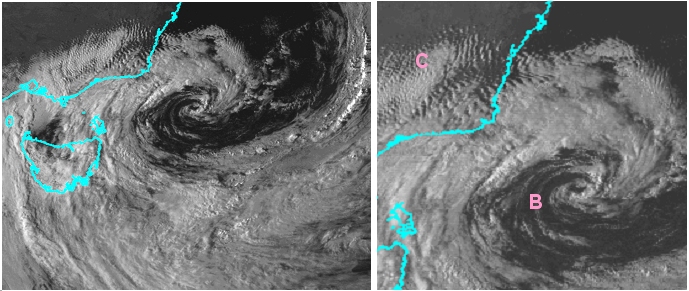
GMS-5 satellite visible image from 0632UTC of the 27 December 1998 showing the intense low pressure system of the 1998 "Sydney to Hobart Yacht Race Storm". The tight cumulus cloud banding near the centre of the low (B) and the lee waves to the Australian Great Dividing Range (C) are shown.
|
|
Figure 9: Images from NOAA/STAR
|
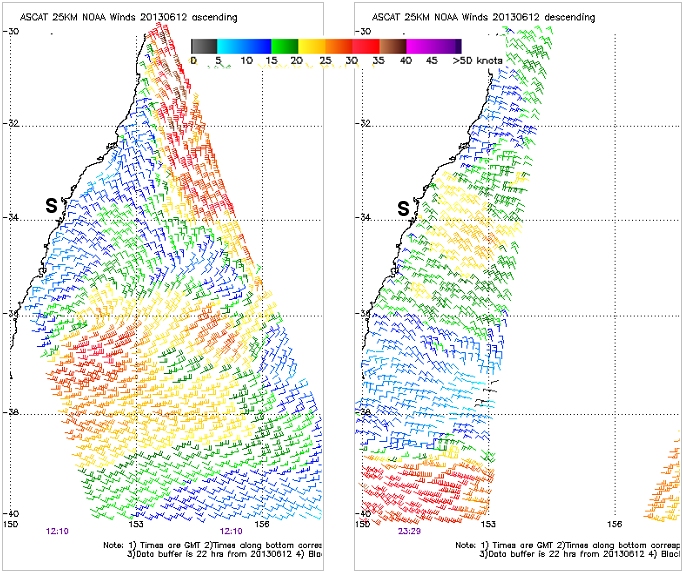
ASCAT microwave scatterometer scans over the western Tasman Sea corresponding to the explosive cyclogenesis event of 12 June 2013. Left hand panel corresponds to 1210UTC ASCAT pass, right hand panel is from the 2359UTC pass.