Cloud Structure In Satellite Images
In satellite images, there are two different features related to SALLJ:
- Cloud streets: these cumuliform clouds are usually found in rows parallel to the low-level wind direction and are normally observed on the warm and moist air mass. Their presence indicates warm advection in the lower troposphere.
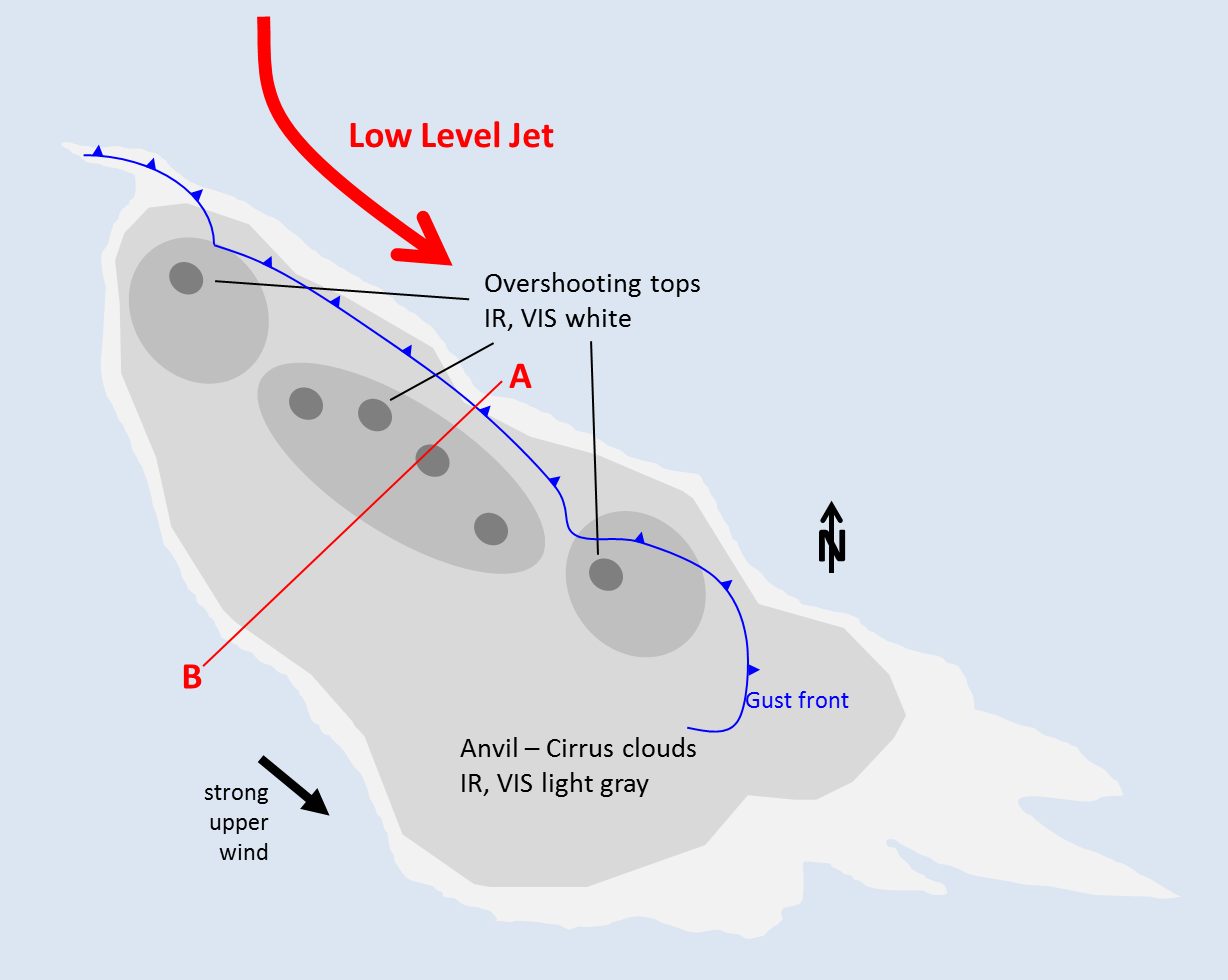
- Mesoscale convective systems (MCSs): These systems appear bright in both VIS and IR imagery since they are thick and have cold tops. MCSs can be nearly circular, elongated or carrot-shaped. The shape usually depends on the strength of the 0-6 km wind shear and upper-level winds.
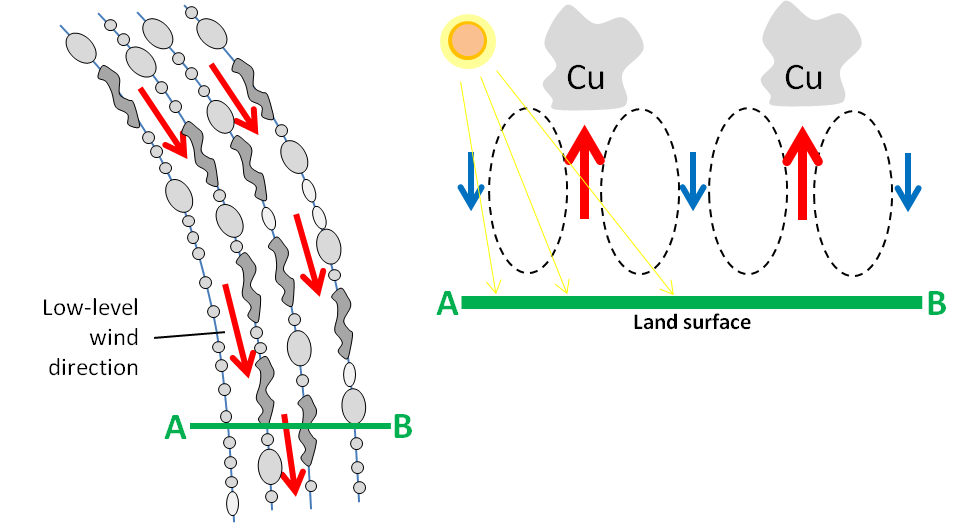
1. Cloud streets
The figure depicts cumulus clouds organized into lines parallel to the low-level wind vector resulting from convective rolls inside the planetary boundary layer (PBL).
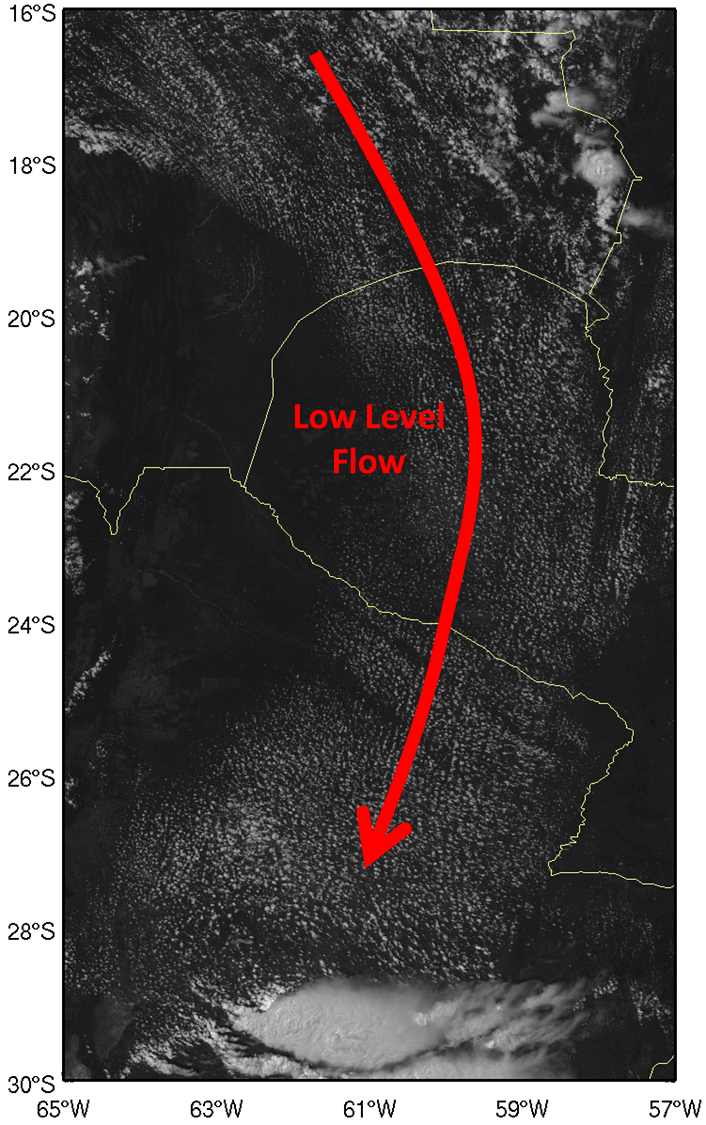
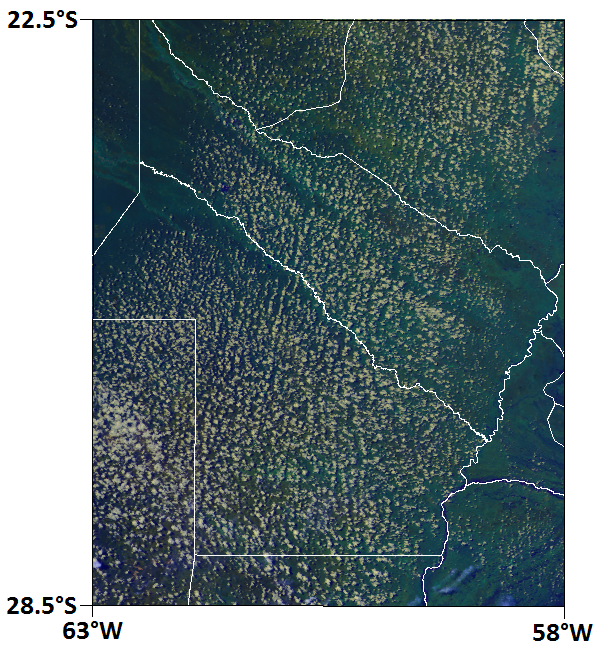
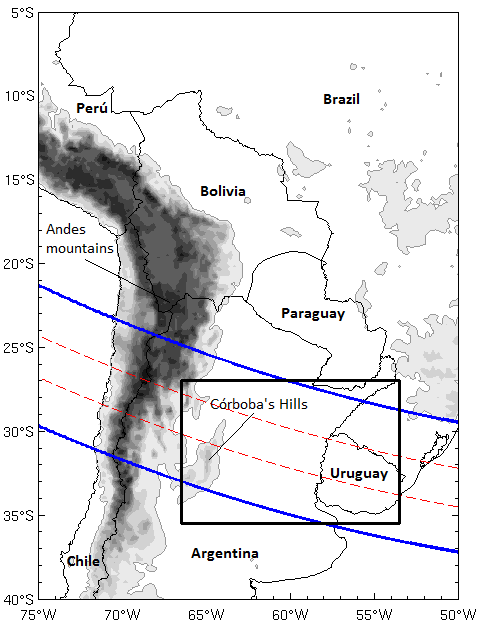
The following VIS and IR GOES images are examples of the appearance of cloud streets within moist low-level advection. The region is close to the Andes, stretching from northern Bolivia to central Argentina, where deep convection can be seen. WV images are available, but not presented because they show WV content only in the middle and upper levels of the troposphere. As a result, the cloud streets cannot be detected in WV images, as they are low-level features.
|
21 October 2008/17.45 UTC - GOES 12 VIS 0.6 image
|
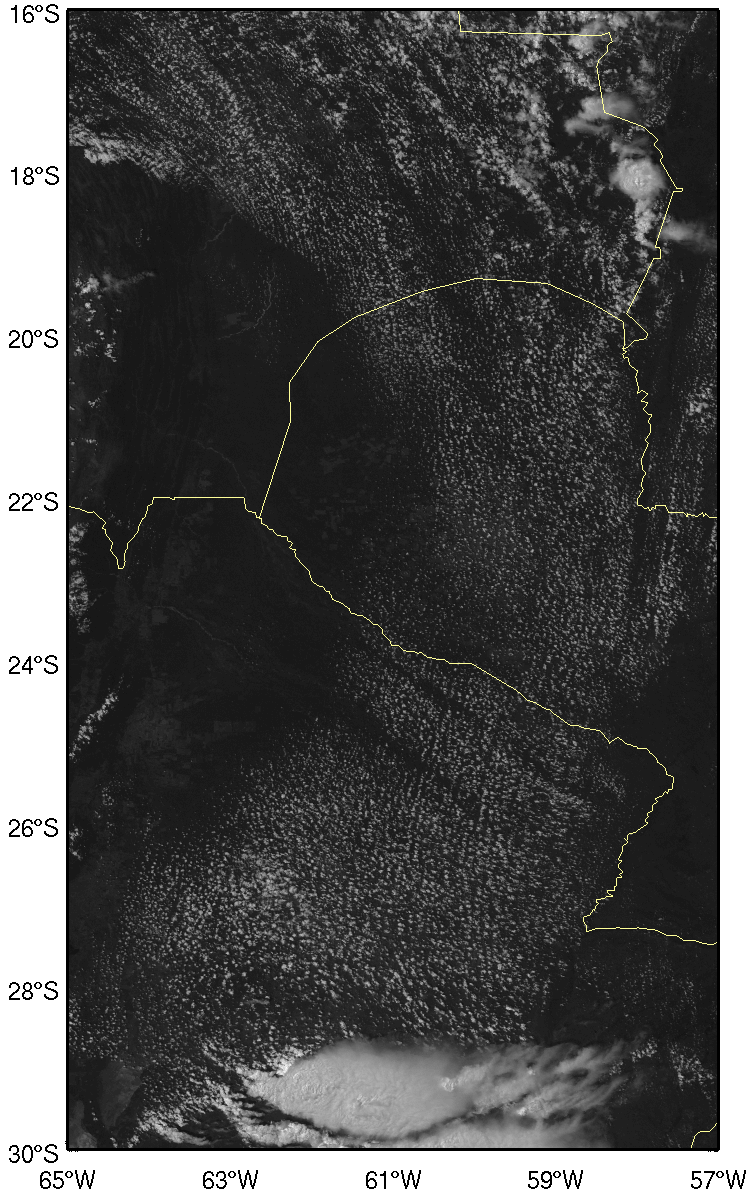
21 October 2008/17.45 UTC - GOES 12 IR 10.7 image
|
|
|
|
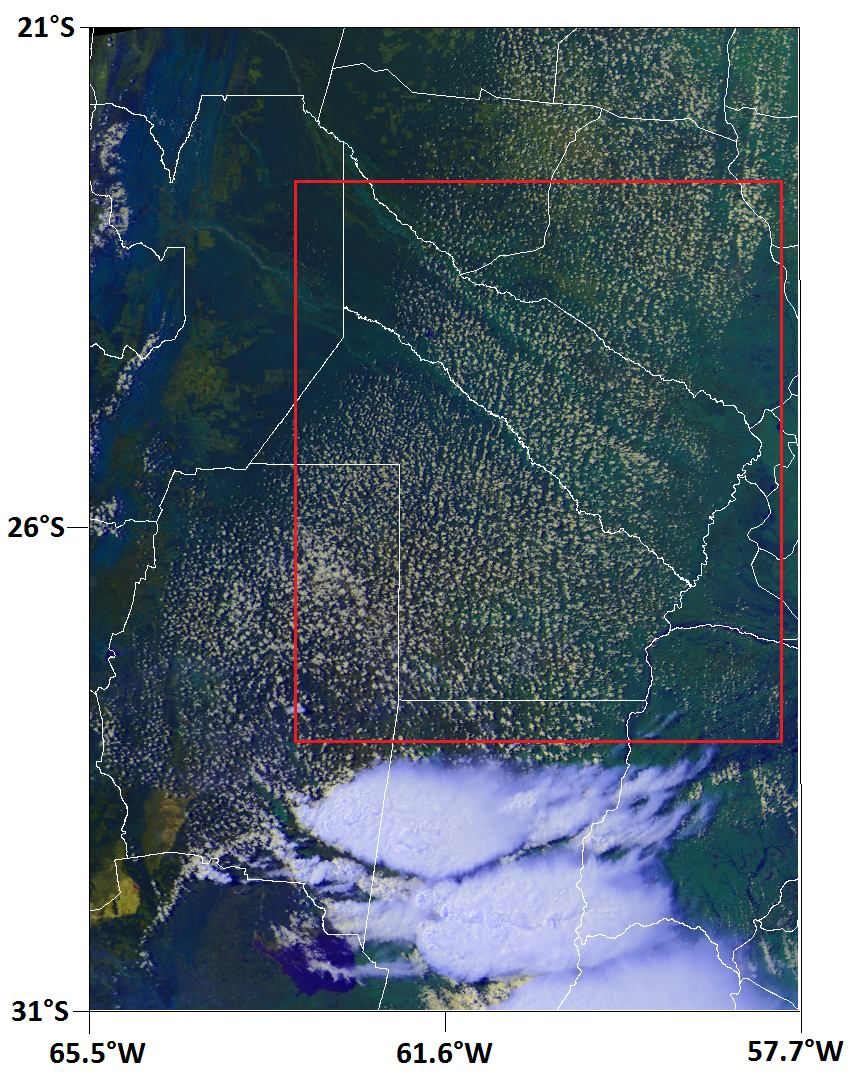
21 October 2008/18.00 UTC - NOAA 18/AVHRR RGB image (R:0.63-G:0.86-B:10.8). Red rectangle indicates the zoom image shown on the right.
|
21 October 2008/18.00 UTC - NOAA 18/AVHRR RGB image (R:0.63-G:0.86-B:10.8)
|
|
|
2. Mesoscale Convective Systems
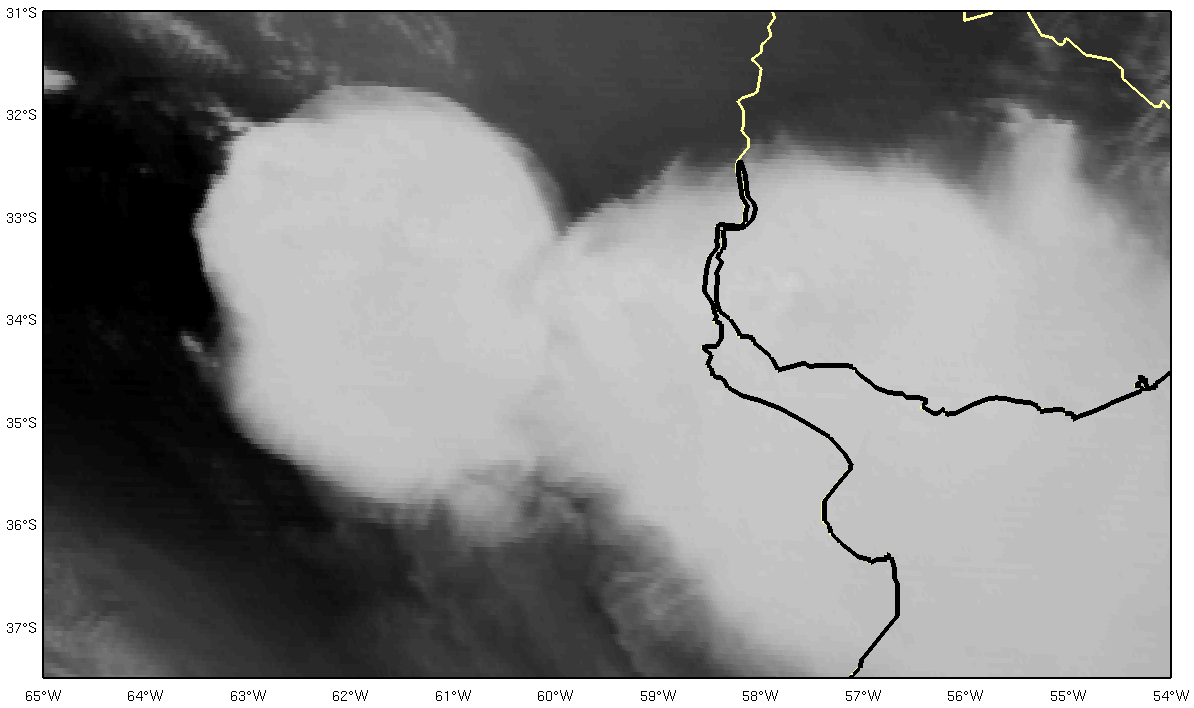
- In VIS, WV and IR images, MCSs are characterized by high pixel values (white) in the regions of deep convection, with clouds that extend up to the tropopause.
- The edges of MCSs are generally sharp upstream. In situations with strong upper level winds, the highest (just under the tropopause) and coldest parts of the clouds are transported downstream, which results in an extended white cloud shield ('anvil') in the IR image, but only a fibrous light grey texture in the VIS image. The thickest and most active part of the MCS is brightest.
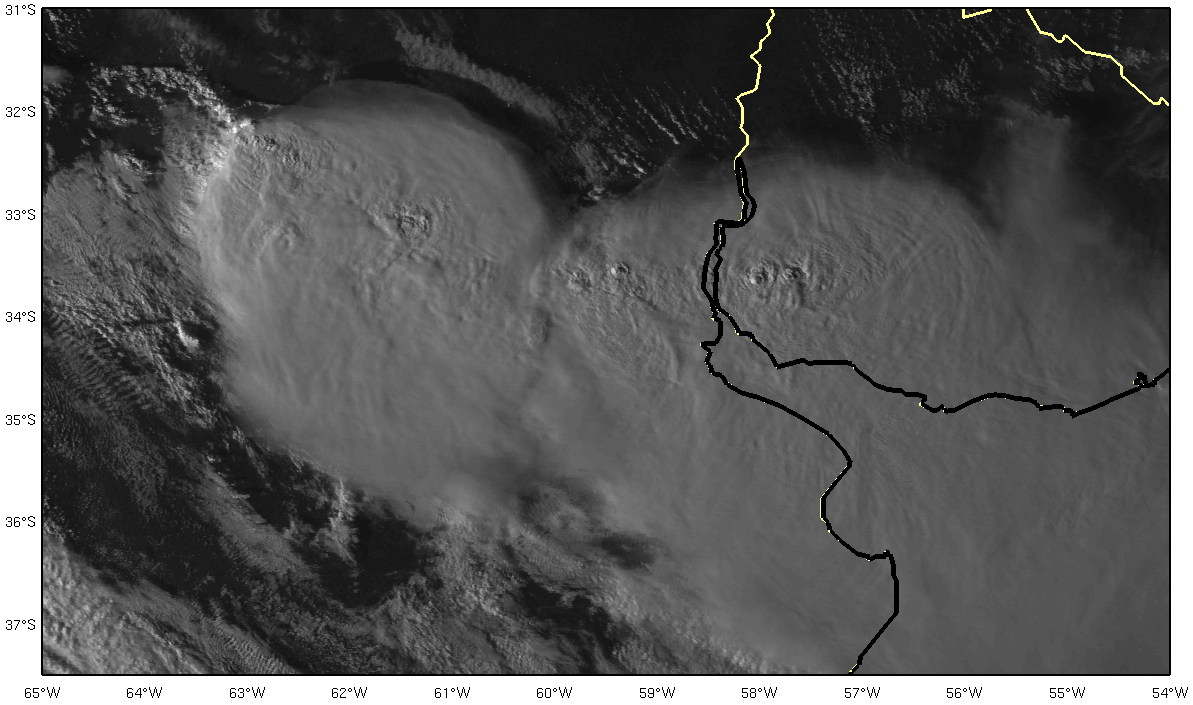
- The overshooting tops related to the MCS's strongest cells are embedded in the cirrus anvil and can often be seen in VIS images, especially during the morning and afternoon due to the shadows projected over the anvil.
|
 |
|
06 December 2012/20.45 UTC - GOES 13 VIS 0.6 image
|
06 December 2012/20.30 UTC - GOES 13 WV 6.7 image
|
|
|
|
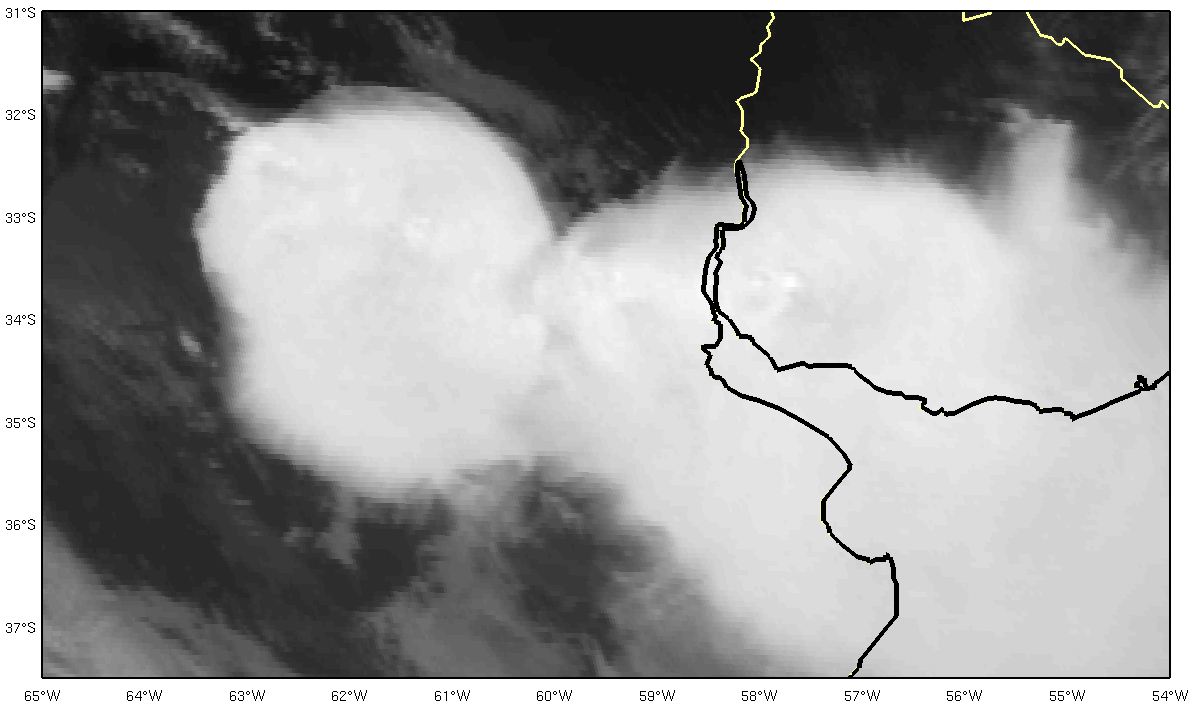
06 December 2012/20.45 UTC - GOES 13 IR 10.7 image
|
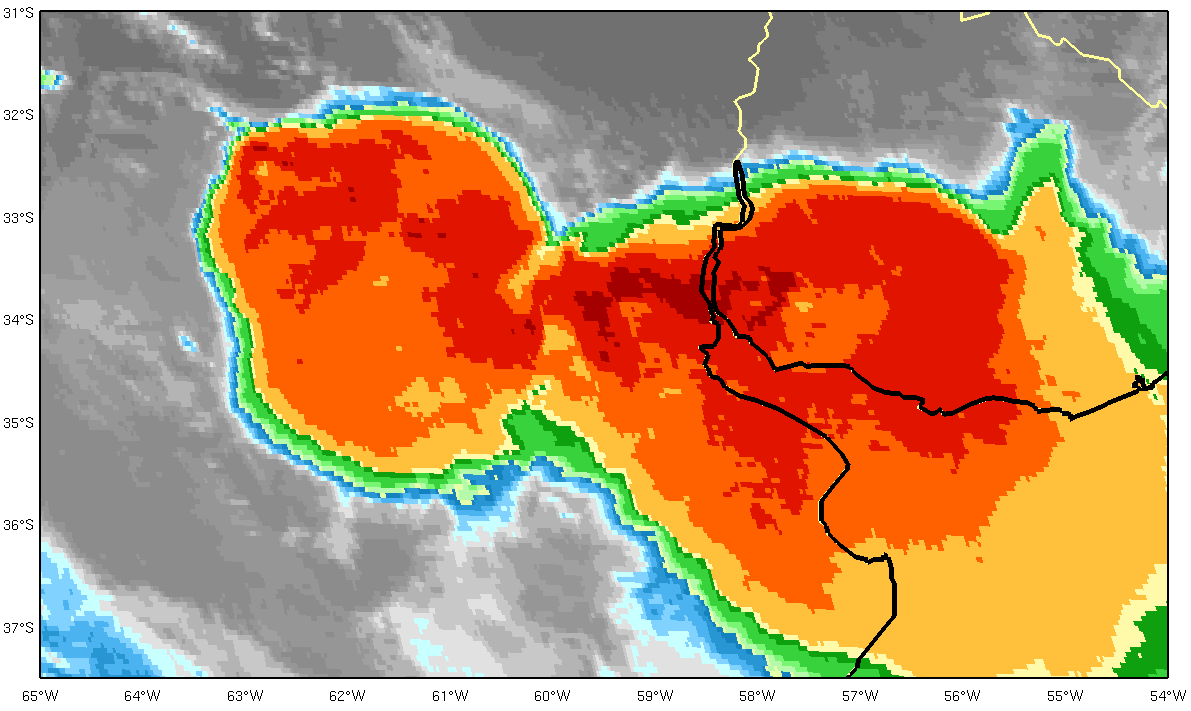
06 December 2012/20.45 UTC - GOES 13 IR 10.7 enhanced image
|
|
|
The following loop shows the development of deep convection between the early hours of 6 December and the morning of 7 December 2012. In its early stages, the development of the MCS is sustained by an intense LLJ. Later on organized deep convection is sustained by a northward-moving cold front.
 |
Play the loop, 06 Dec 2012/00.00 UTC - 07 Dec 2012/23.00 UTC GOES 13 IR 10.7 enhanced image. |
MCS appearance in TRMM imagery
The TRMM (Tropical Rainfall Measuring Mission) satellite with its multiple sensors is perfect for analyzing the structure of mesoscale convective systems in greater detail. Two severe MCSs are shown in this example: one over Córdoba province close to the Sierras de Córdoba and the other over the Entre Ríos province and western Uruguay. The next figure indicates the VIRS (Visible and Infrared Sensor, blue line) and PR (Precipitation Radar, red line) overpasses. The TRMM subset location is marked with a black rectangle.
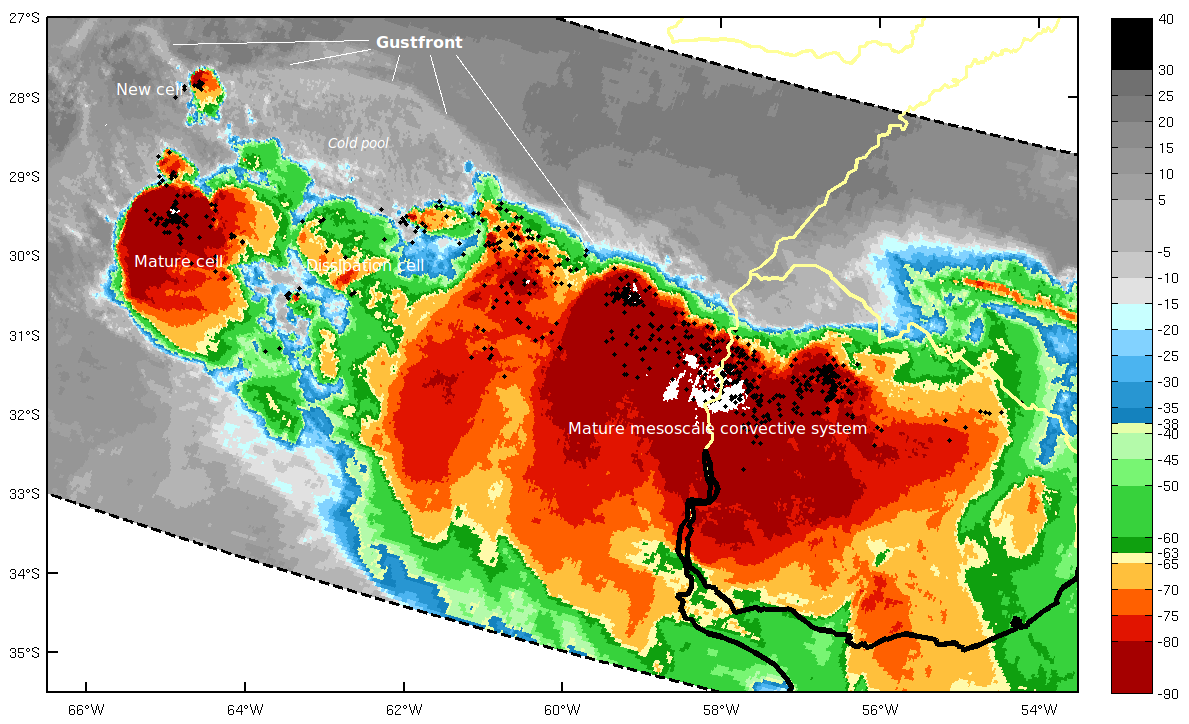
- The IR image contains an area with cold cloud tops. The most intense convection lies along the northern part of this area, as can be inferred from the distribution of lightning.
- The gust front lies northwest of the convection in the IR images, away from the leading convective towers. A new cell is forming in the region where two outflow boundaries collide.
- On the right side of the IR image, where the system has its most active cells, the gust front is not as clearly observed as the previous one, because it is closer to the updraft at the leading edge of the MCS. RKW theory (Rotunno et al., 1988) postulates that the mechanism that maintains a long-lived squall line is a balance between horizontal vorticity produced by a) buoyancy gradient across the gust front and b) low-level vertical wind shear. This explains why the gustfront propagates jointly with the MCS.
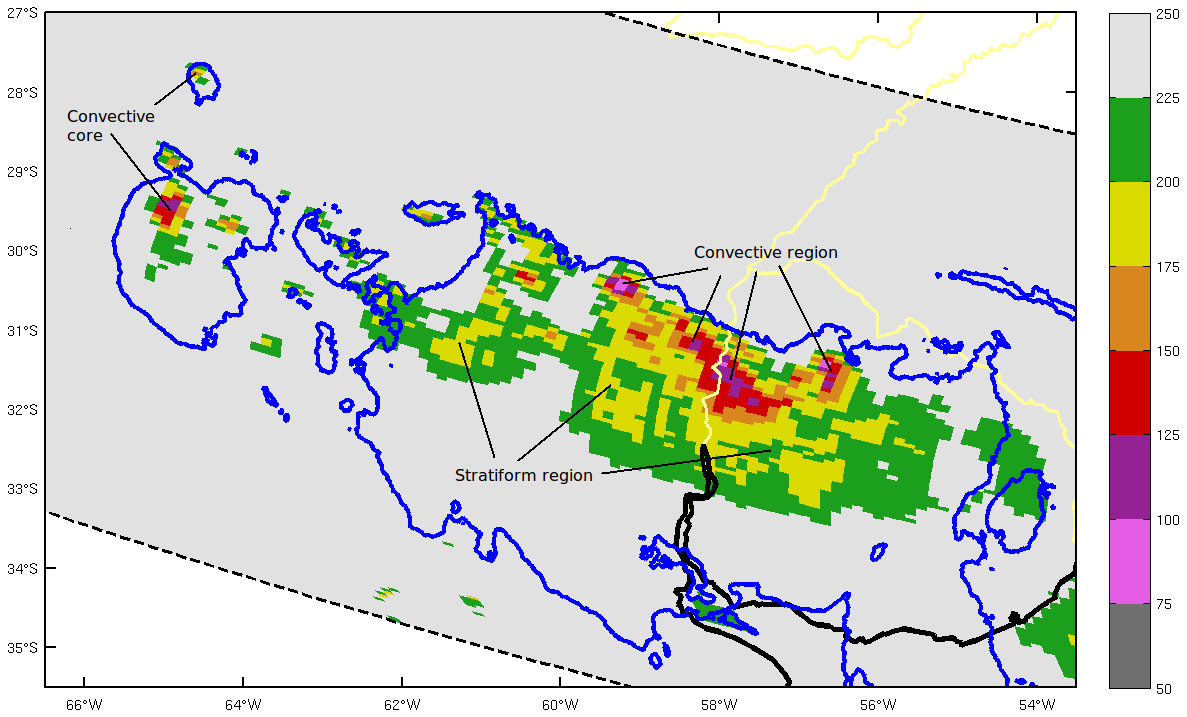
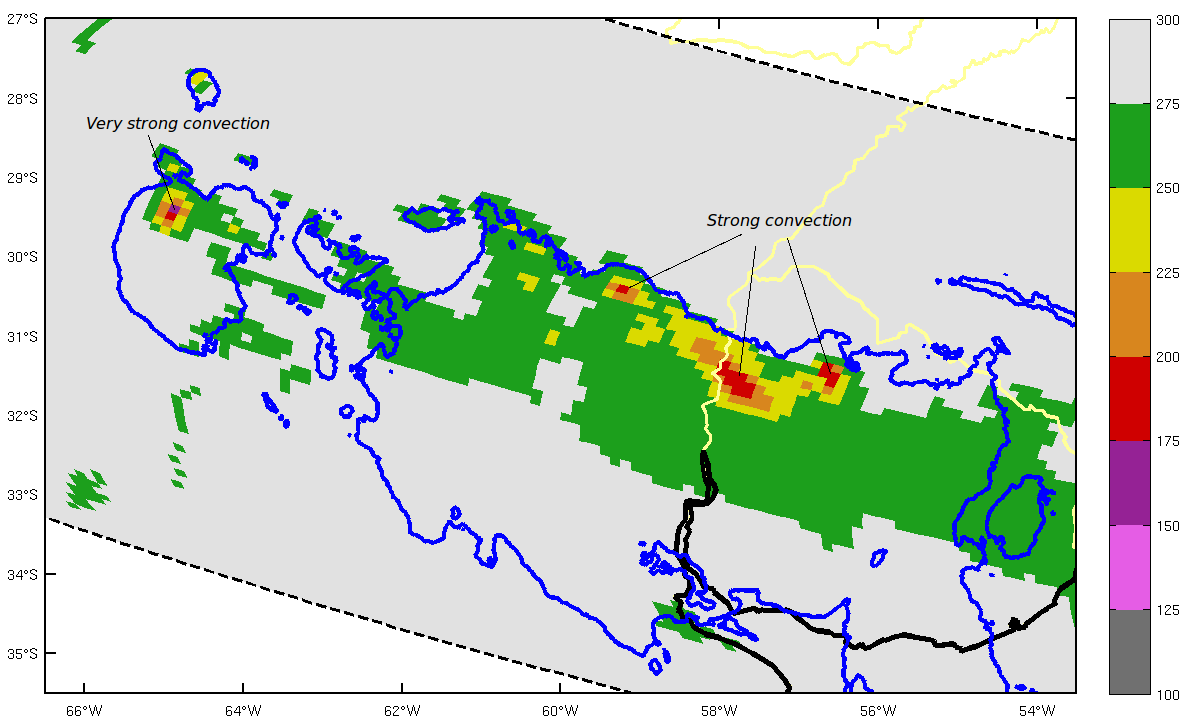
- Different regions with low values of Polarized Corrected Temperature (PCT) are present in the 85- and 37-GHz brightness temperature images. They are related with areas with strong updrafts, heavy rains and large hailstones (Cecil, 2009).
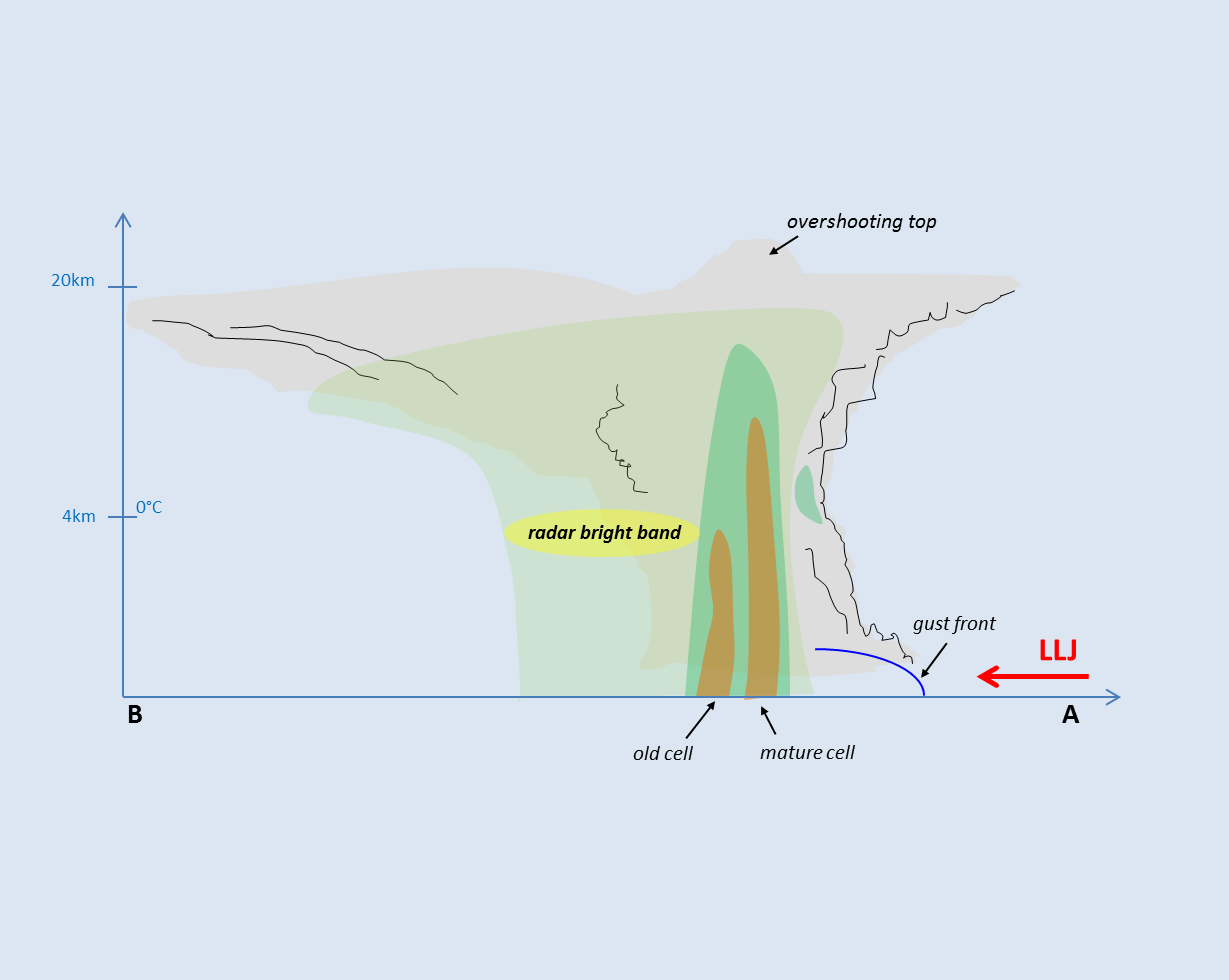
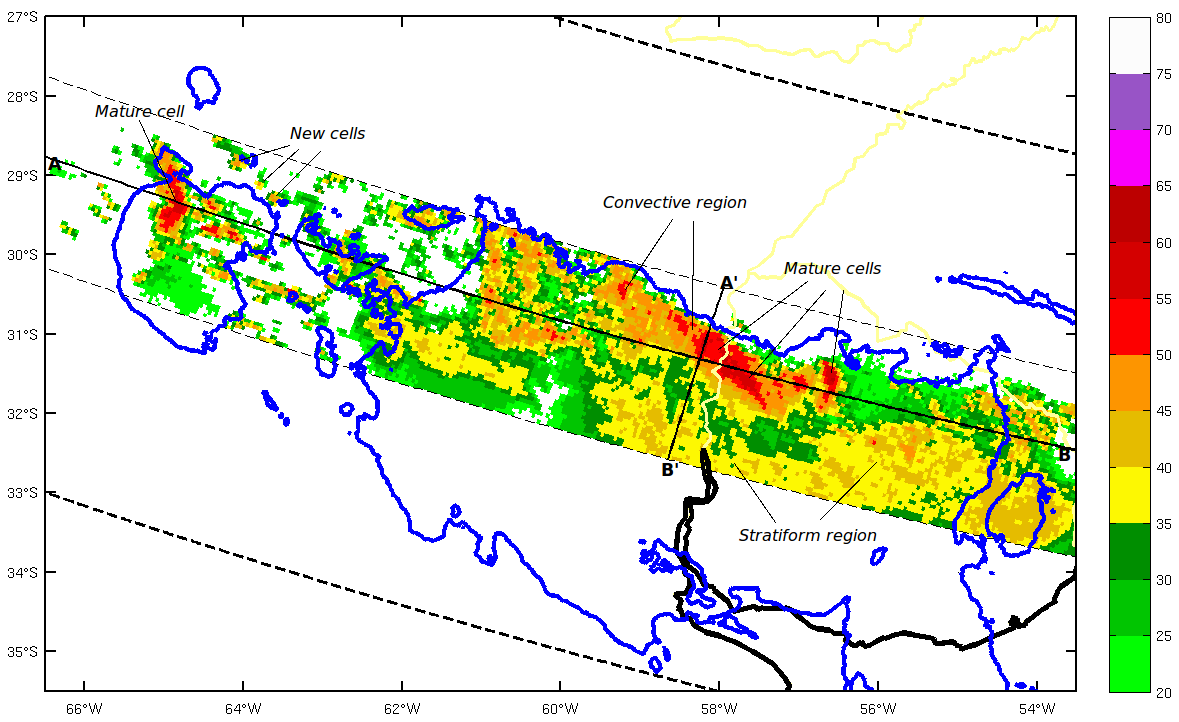
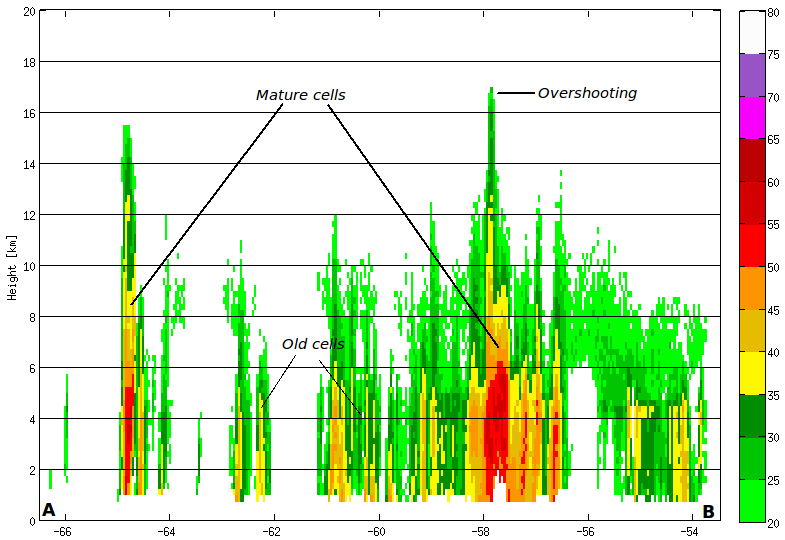
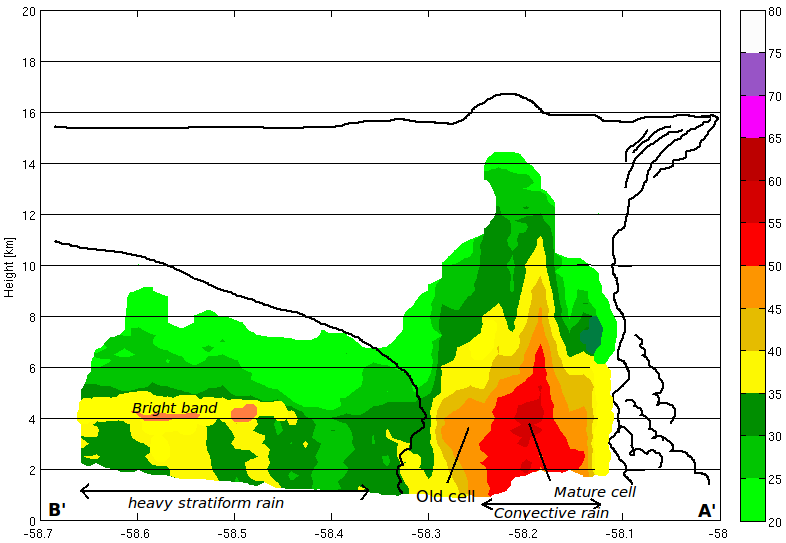
- Maximum column reflectivity and vertical cross section images from eastern Argentina show a typical MCS squall line structure: the leading edge with deepest convective towers, the transition zone and the trailing stratiform precipitation region.
|
07 December 2012/05.40 UTC - TRMM/VIRS IR 10.8 image and LIS lightning flashes (black dots)
|
07 December 2012/05.40 UTC - TRMM/TMI 85-GHz and 210-K TRMM/VIRS IR 10.8 temperature (blue contour)
|
|
|
|
07 December 2012/05.40 UTC - TRMM/TMI 37-GHz and 210-K TRMM/VIRS IR 10.8 temperature (blue contour).
|
07 December 2012/05.40 UTC - TRMM/PR maximum column reflectivity image and 210-K TRMM/VIRS IR 10.8 temperature (blue contour). The black lines indicate the location of the vertical cross sections.
|
|
|
|
07 December 2012/05.40 UTC - TRMM-PR vertical cross section image (A-B)
|
07 December 2012/05.40 UTC - TRMM-PR vertical cross section image (A'-B'). The solid black line indicates the cloud boundary.
|
|
|