Table of Contents
Cloud Structure In Satellite Images
In satellite images, there are two different features related to SALLJ:
- Cloud streets: these cumuliform clouds are usually found in rows parallel to the low-level wind direction and are normally observed on the warm and moist air mass. Their presence indicates warm advection in the lower troposphere.
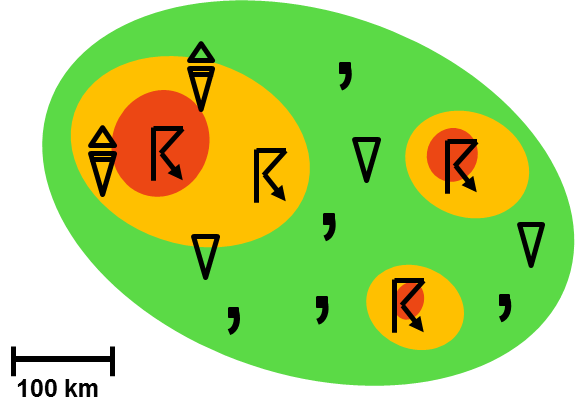
- Mesoscale convective systems (MCSs): These systems appear bright in both VIS and IR imagery since they are thick and have cold tops. MCSs can be nearly circular, elongated or carrot-shaped. The shape usually depends on the strength of the 0-6 km wind shear and upper-level winds.
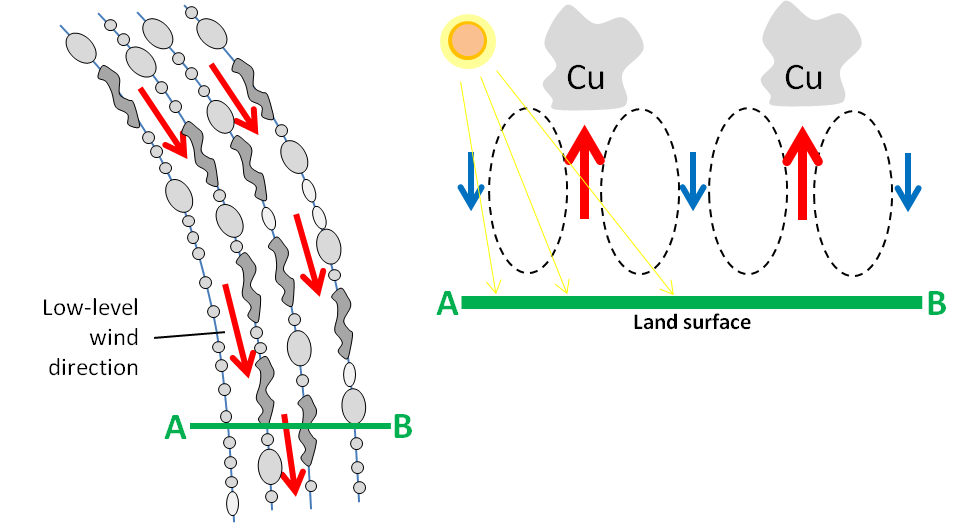
1. Cloud streets
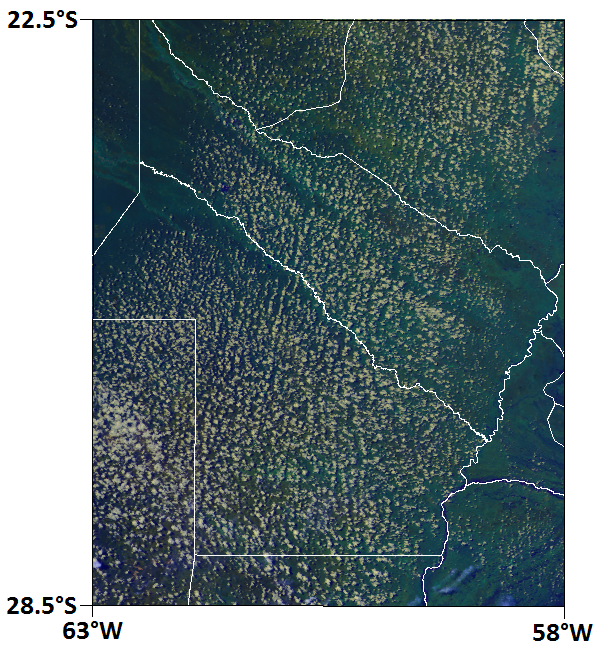
The figure depicts cumulus clouds organized into lines parallel to the low-level wind vector resulting from convective rolls inside the planetary boundary layer (PBL).
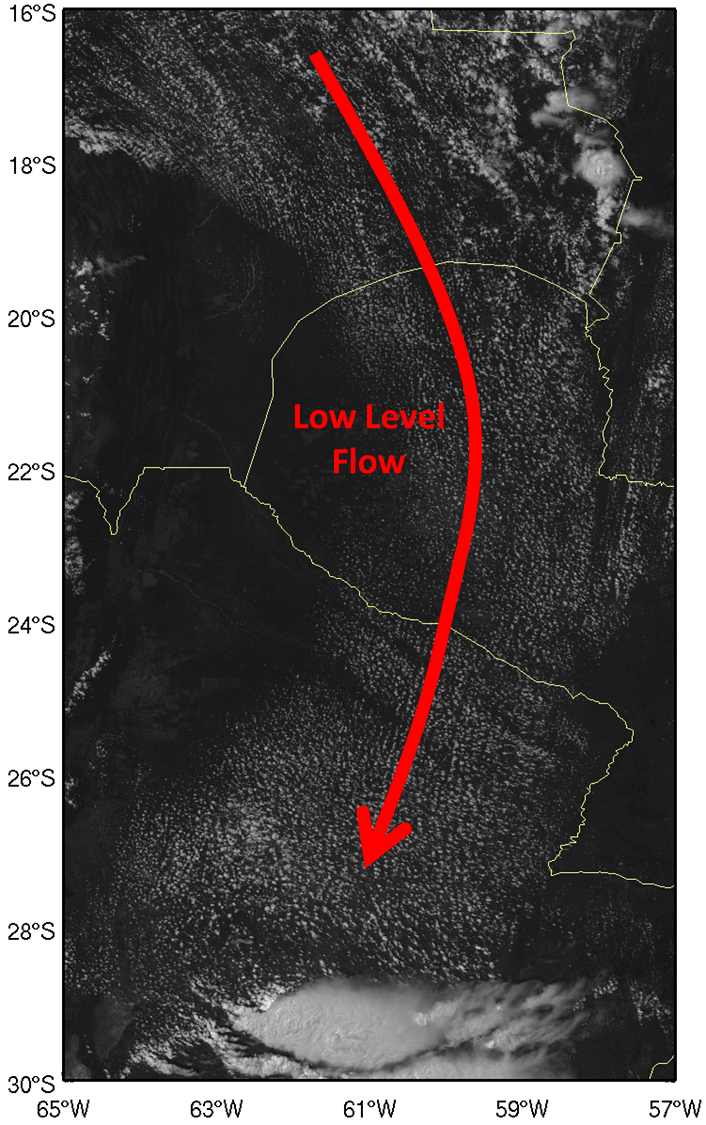
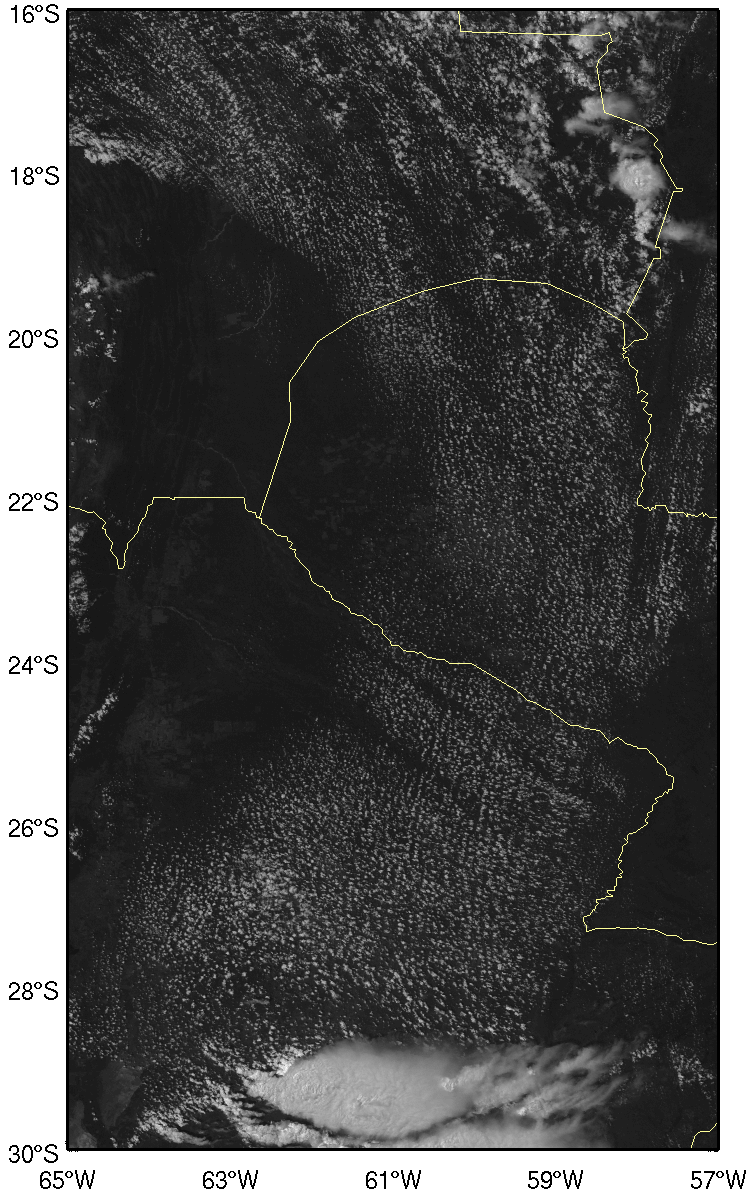
The following VIS and IR GOES images are examples of the appearance of cloud streets within moist low-level advection. The region is close to the Andes, stretching from northern Bolivia to central Argentina, where deep convection can be seen. WV images are available, but not presented because they show WV content only in the middle and upper levels of the troposphere. As a result, the cloud streets cannot be detected in WV images, as they are low-level features.
|
21 October 2008/17.45 UTC - GOES 12 VIS 0.6 image
|
21 October 2008/17.45 UTC - GOES 12 IR 10.7 image
|
|
|
|
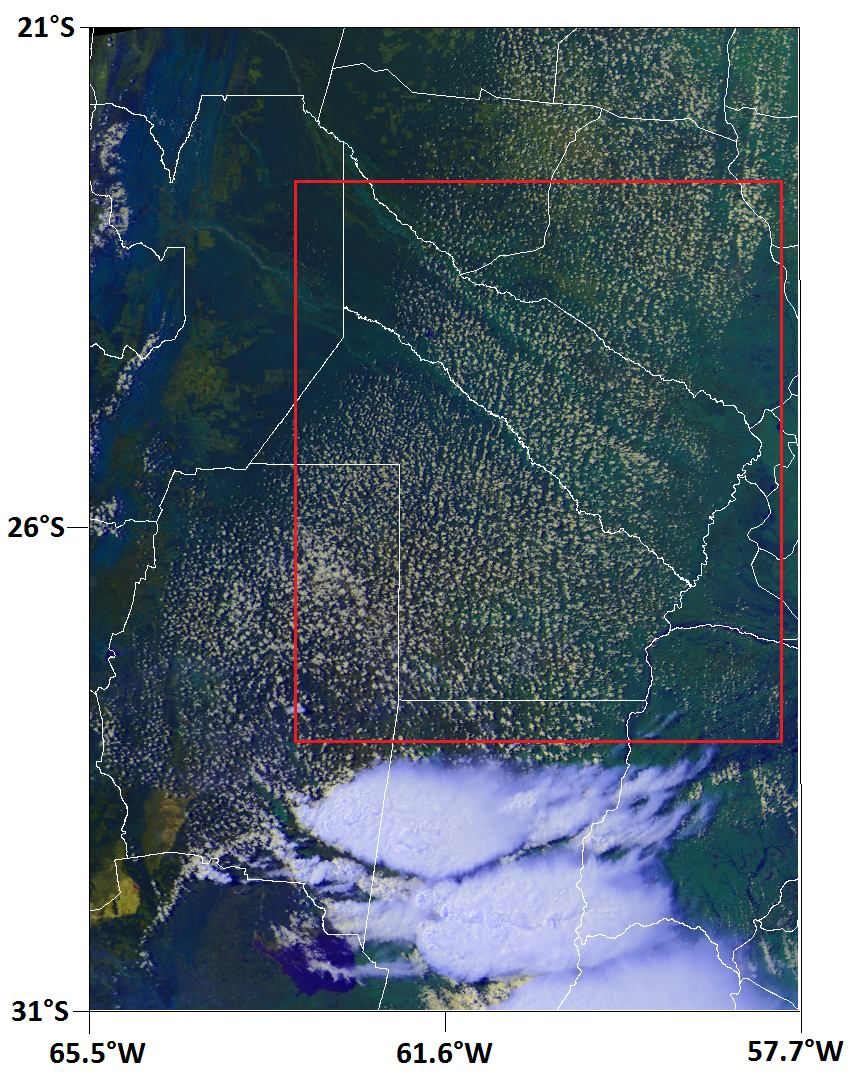
21 October 2008/18.00 UTC - NOAA 18/AVHRR RGB image (R:0.63-G:0.86-B:10.8). Red rectangle indicates the zoom image shown on the right.
|
21 October 2008/18.00 UTC - NOAA 18/AVHRR RGB image (R:0.63-G:0.86-B:10.8)
|
|
|
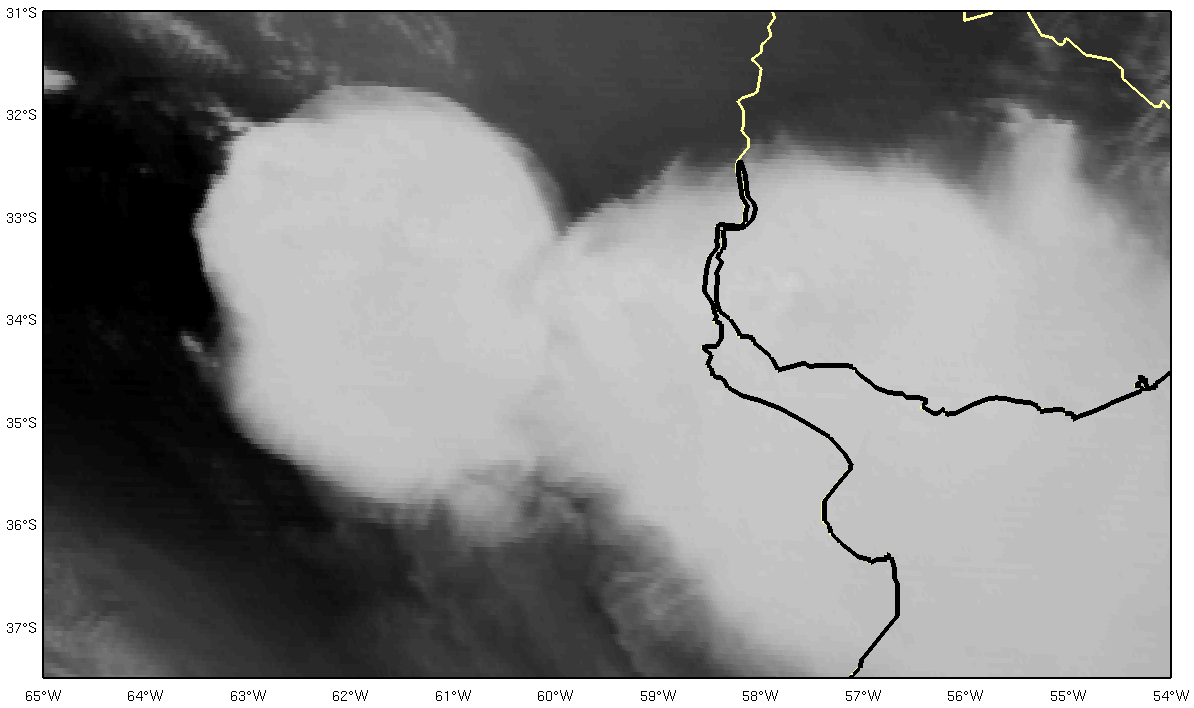
2. Mesoscale Convective Systems
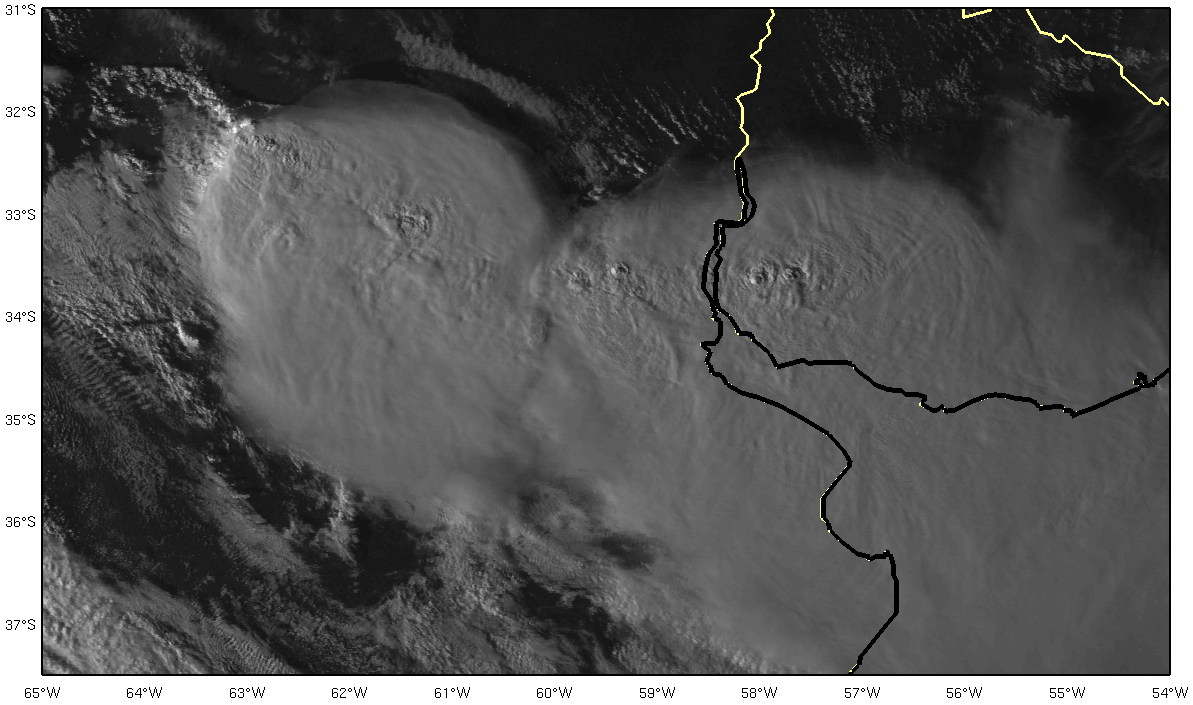
- In VIS, WV and IR images, MCSs are characterized by high pixel values (white) in the regions of deep convection, with clouds that extend up to the tropopause.
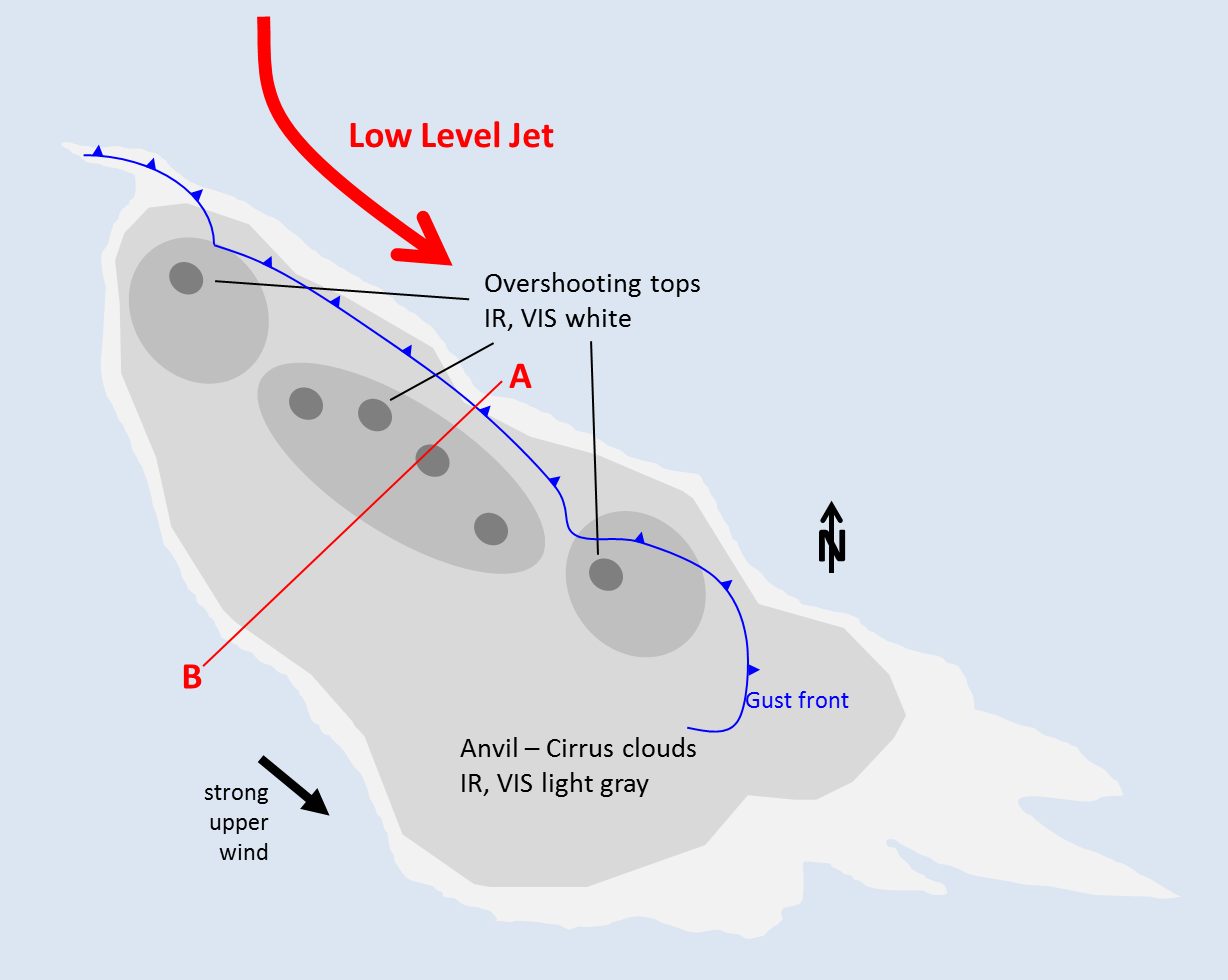
- The edges of MCSs are generally sharp upstream. In situations with strong upper level winds, the highest (just under the tropopause) and coldest parts of the clouds are transported downstream, which results in an extended white cloud shield ('anvil') in the IR image, but only a fibrous light grey texture in the VIS image. The thickest and most active part of the MCS is brightest.
- The overshooting tops related to the MCS's strongest cells are embedded in the cirrus anvil and can often be seen in VIS images, especially during the morning and afternoon due to the shadows projected over the anvil.
|
 |
|
06 December 2012/20.45 UTC - GOES 13 VIS 0.6 image
|
06 December 2012/20.30 UTC - GOES 13 WV 6.7 image
|
|
|
|
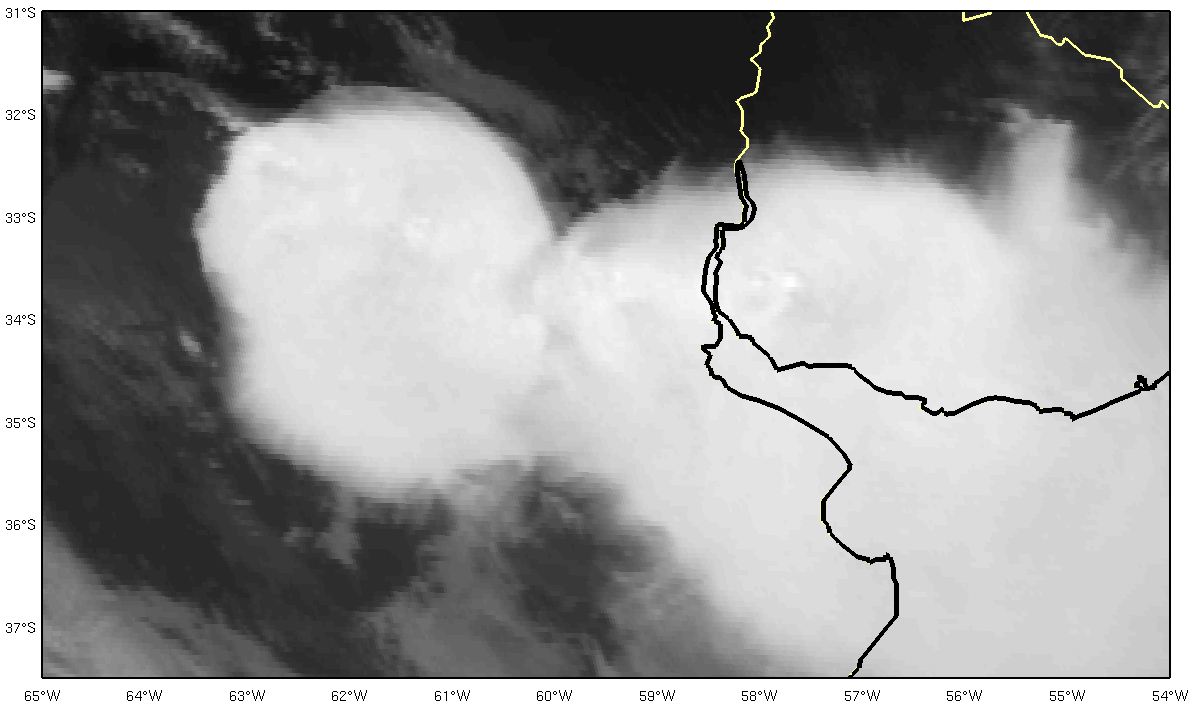
06 December 2012/20.45 UTC - GOES 13 IR 10.7 image
|
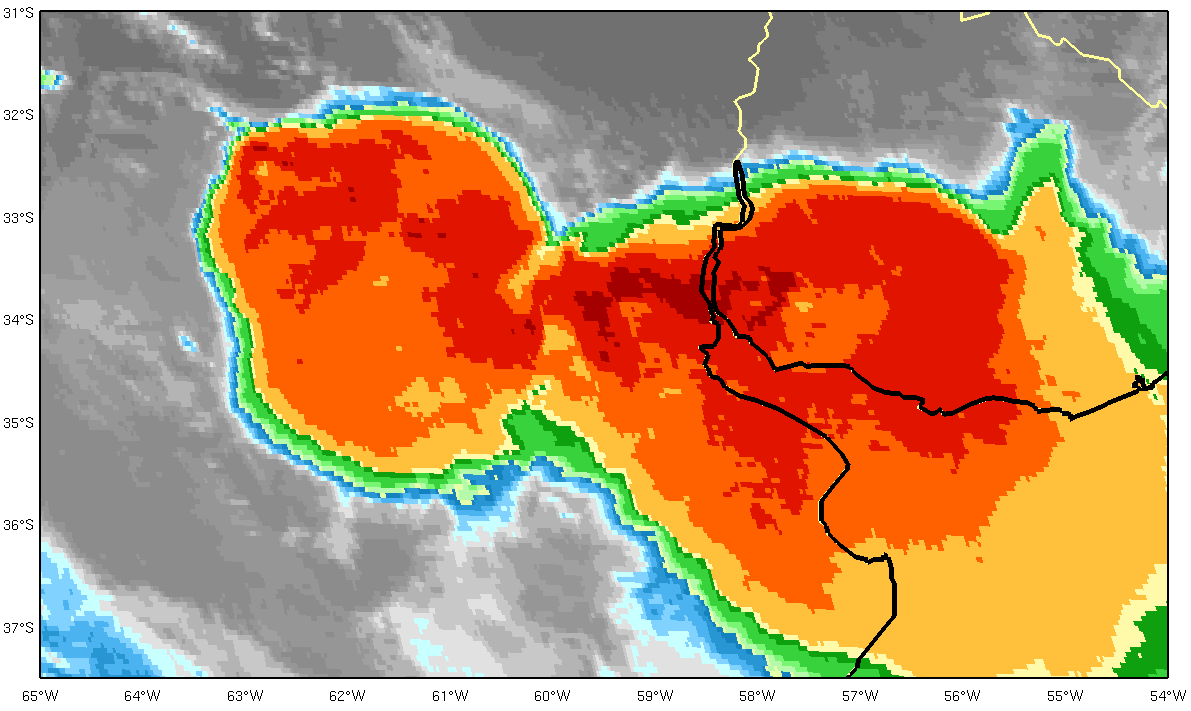
06 December 2012/20.45 UTC - GOES 13 IR 10.7 enhanced image
|
|
|
The following loop shows the development of deep convection between the early hours of 6 December and the morning of 7 December 2012. In its early stages, the development of the MCS is sustained by an intense LLJ. Later on organized deep convection is sustained by a northward-moving cold front.
 |
Play the loop, 06 Dec 2012/00.00 UTC - 07 Dec 2012/23.00 UTC GOES 13 IR 10.7 enhanced image. |
MCS appearance in TRMM imagery
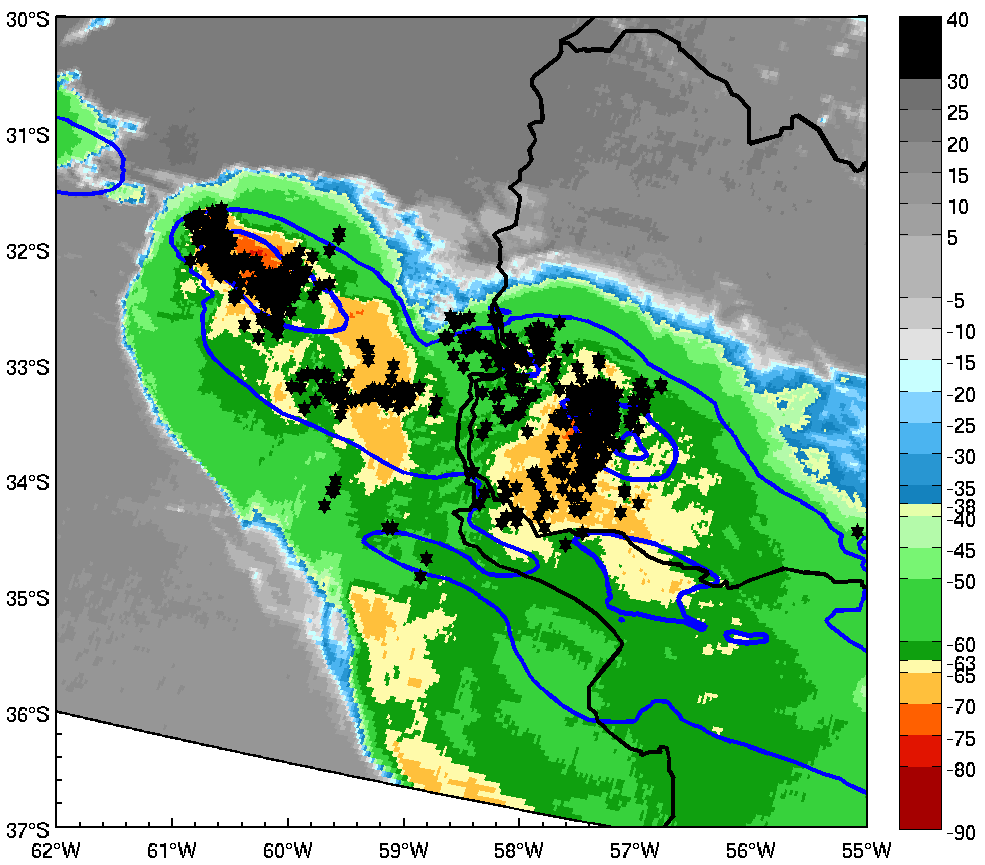
The TRMM (Tropical Rainfall Measuring Mission) satellite with its multiple sensors is perfect for analyzing the structure of mesoscale convective systems in greater detail. Two severe MCSs are shown in this example: one over Córdoba province close to the Sierras de Córdoba and the other over the Entre Ríos province and western Uruguay. The next figure indicates the VIRS (Visible and Infrared Sensor, blue line) and PR (Precipitation Radar, red line) overpasses. The TRMM subset location is marked with a black rectangle.
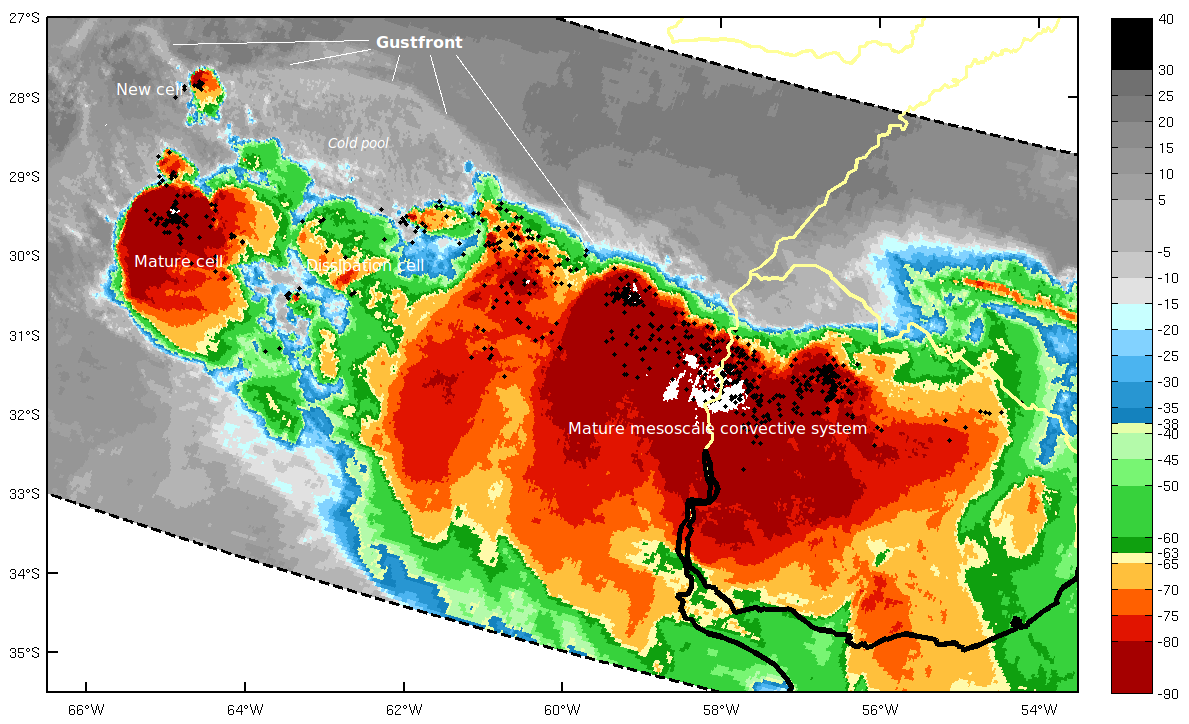
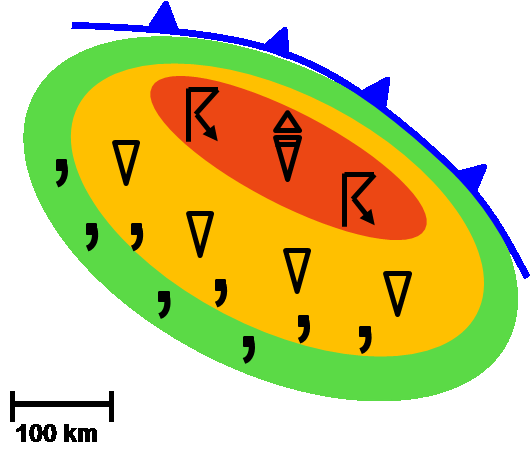
- The IR image contains an area with cold cloud tops. The most intense convection lies along the northern part of this area, as can be inferred from the distribution of lightning.
- The gust front lies northwest of the convection in the IR images, away from the leading convective towers. A new cell is forming in the region where two outflow boundaries collide.
- On the right side of the IR image, where the system has its most active cells, the gust front is not as clearly observed as the previous one, because it is closer to the updraft at the leading edge of the MCS. RKW theory (Rotunno et al., 1988) postulates that the mechanism that maintains a long-lived squall line is a balance between horizontal vorticity produced by a) buoyancy gradient across the gust front and b) low-level vertical wind shear. This explains why the gustfront propagates jointly with the MCS.
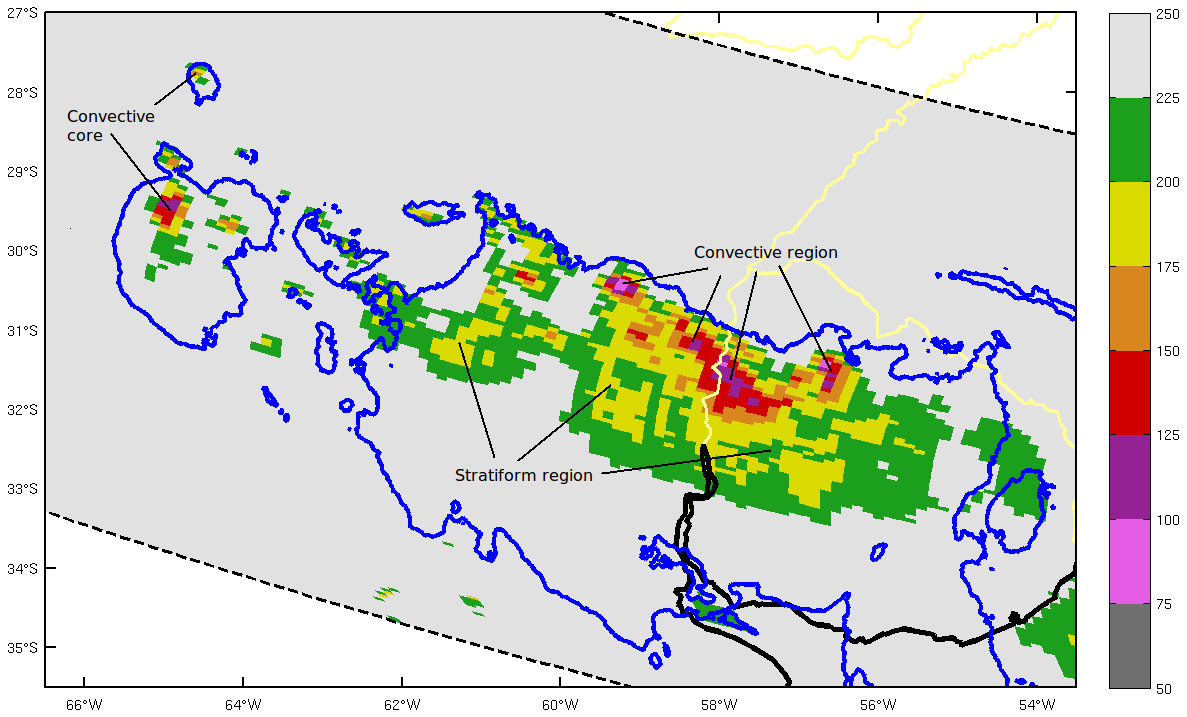
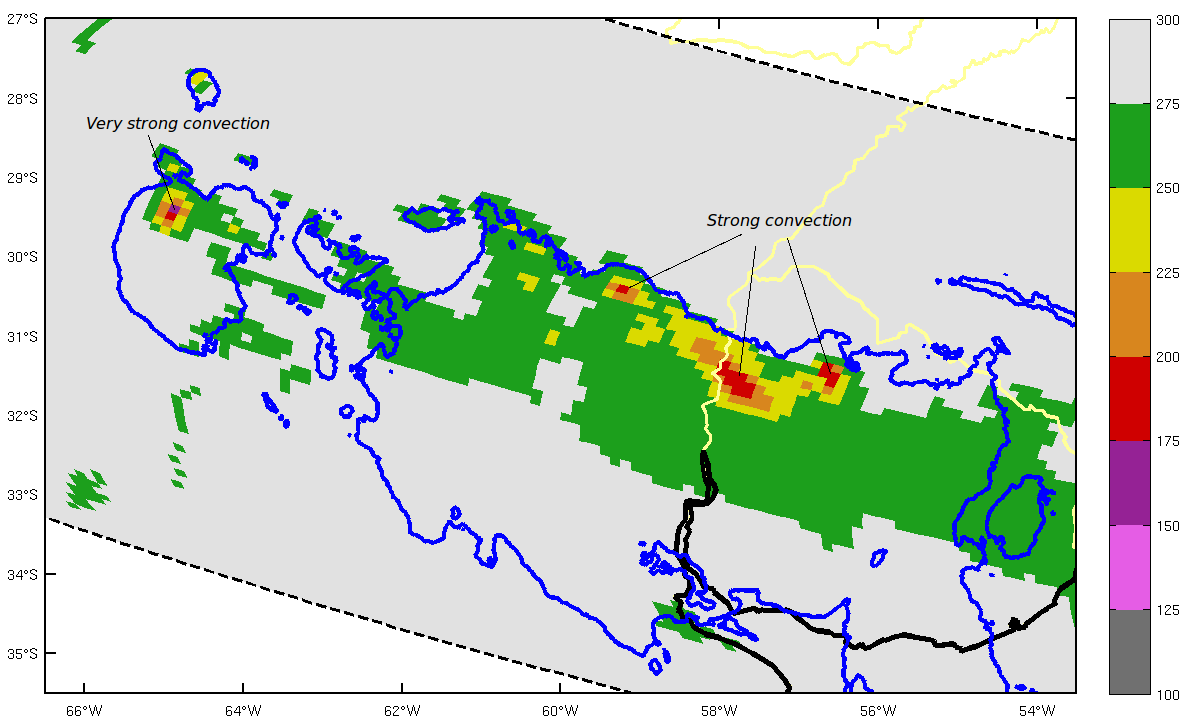
- Different regions with low values of Polarized Corrected Temperature (PCT) are present in the 85- and 37-GHz brightness temperature images. They are related with areas with strong updrafts, heavy rains and large hailstones (Cecil, 2009).
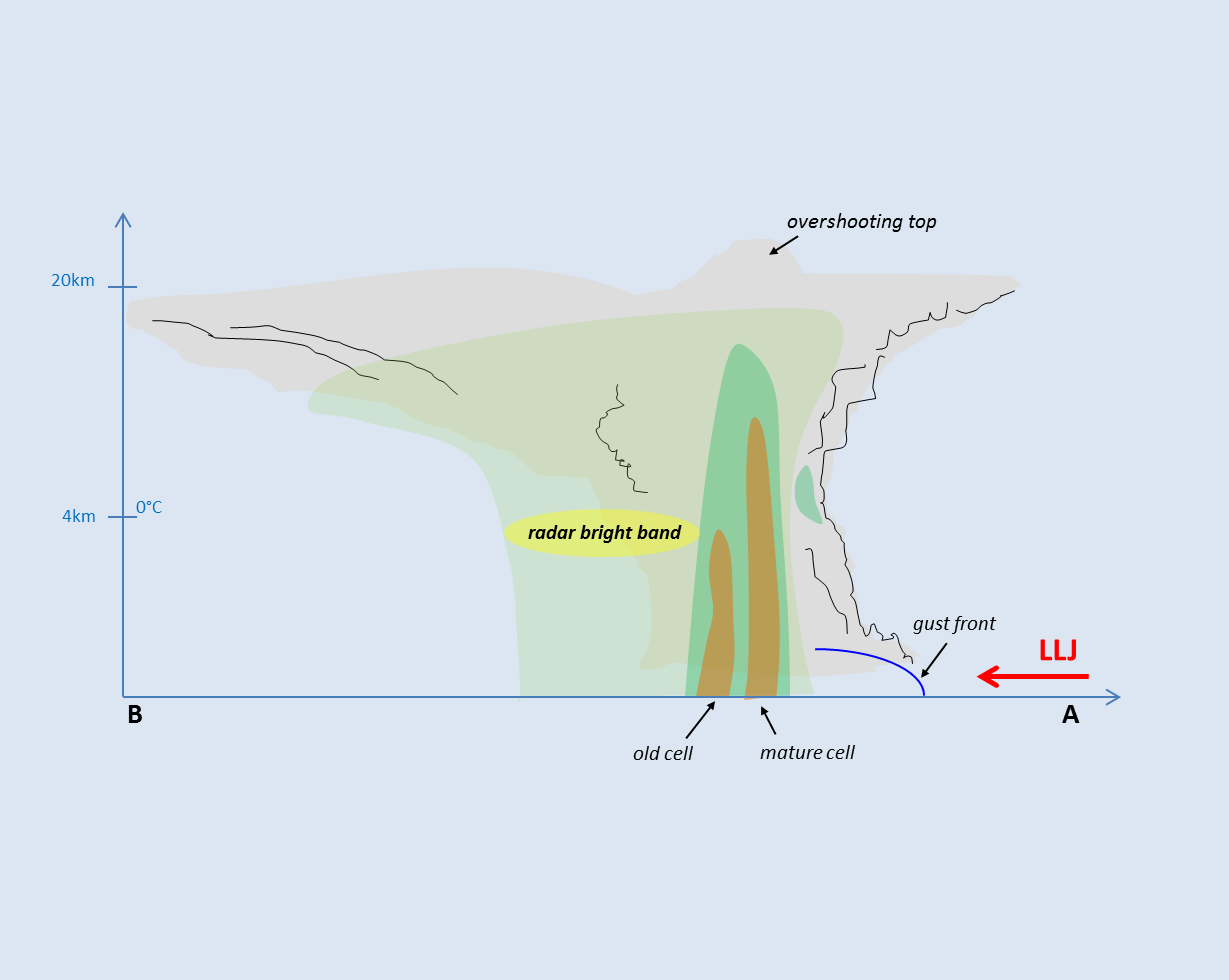
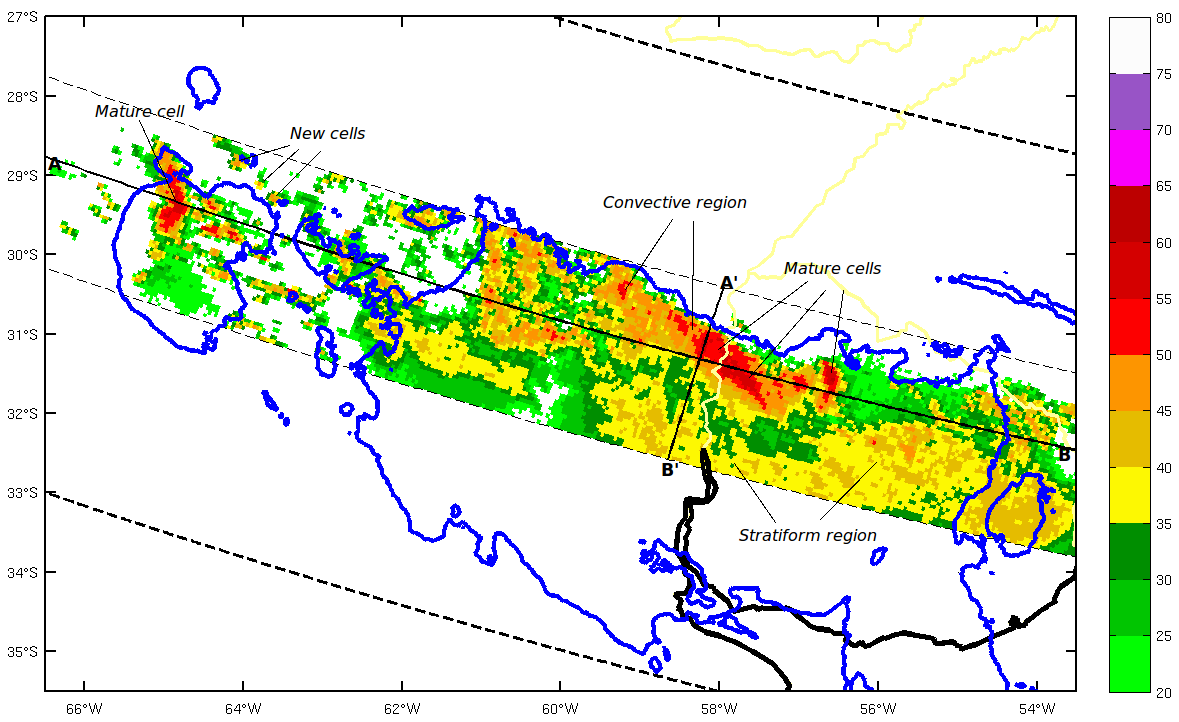
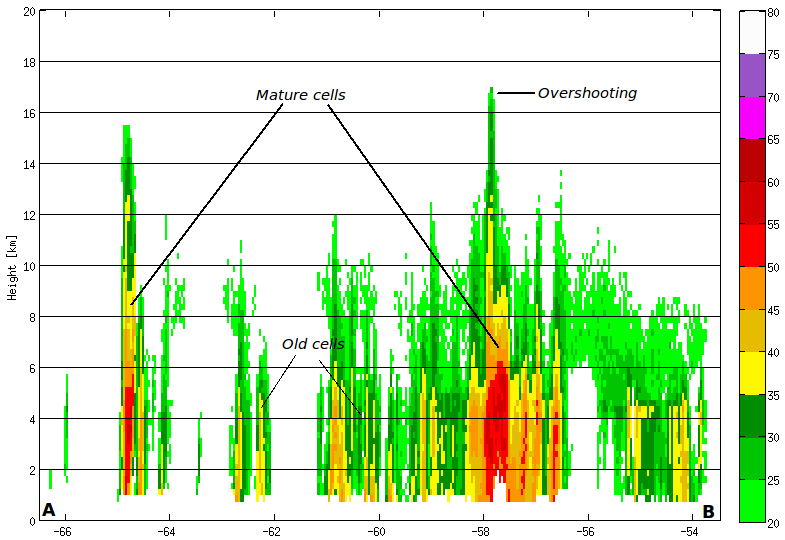
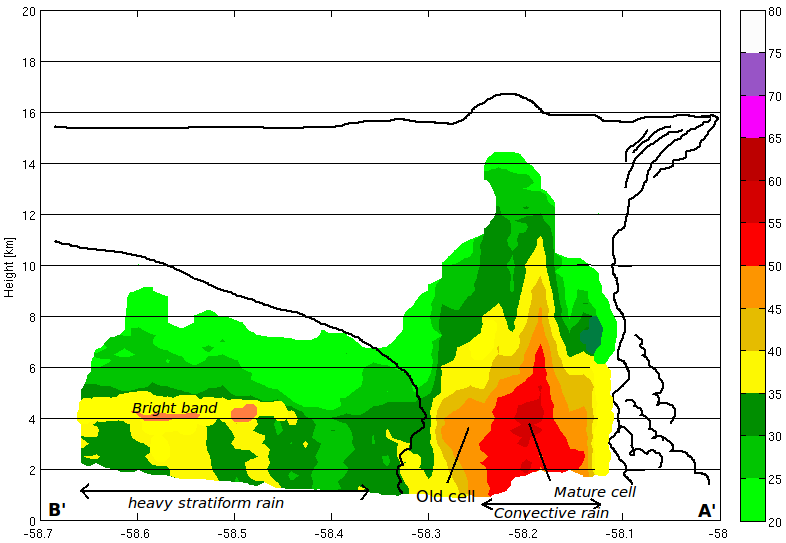
- Maximum column reflectivity and vertical cross section images from eastern Argentina show a typical MCS squall line structure: the leading edge with deepest convective towers, the transition zone and the trailing stratiform precipitation region.
|
07 December 2012/05.40 UTC - TRMM/VIRS IR 10.8 image and LIS lightning flashes (black dots)
|
07 December 2012/05.40 UTC - TRMM/TMI 85-GHz and 210-K TRMM/VIRS IR 10.8 temperature (blue contour)
|
|
|
|
07 December 2012/05.40 UTC - TRMM/TMI 37-GHz and 210-K TRMM/VIRS IR 10.8 temperature (blue contour).
|
07 December 2012/05.40 UTC - TRMM/PR maximum column reflectivity image and 210-K TRMM/VIRS IR 10.8 temperature (blue contour). The black lines indicate the location of the vertical cross sections.
|
|
|
|
07 December 2012/05.40 UTC - TRMM-PR vertical cross section image (A-B)
|
07 December 2012/05.40 UTC - TRMM-PR vertical cross section image (A'-B'). The solid black line indicates the cloud boundary.
|
|
|
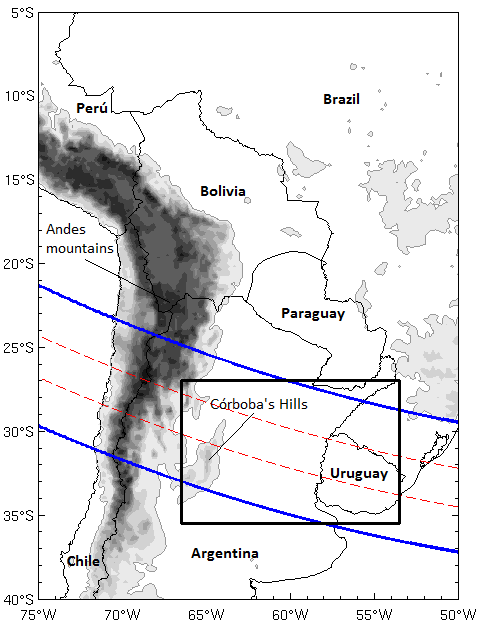
Meteorological Physical Background
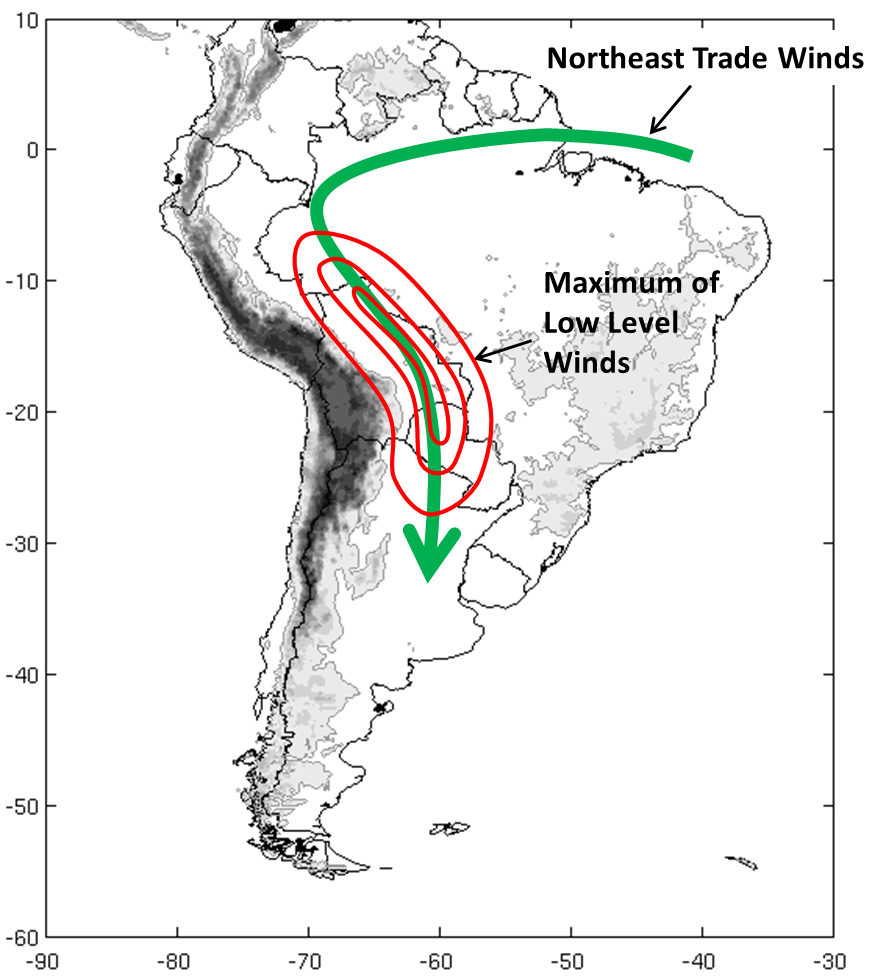
The Andes, which is one of the major mountain ranges in the world, blocks and deflects the low level circulation associated with the trade winds to higher latitudes producing a low level current, that is known as the South American Low Level Jet (SALLJ).
|
|
SALLJ has a strong influence on the development of deep convection over the SESA region. The decelerating leading edge of the flow promotes strong convergence of the horizontal wind field, thus allowing low-level moisture to ascend into the free troposphere. If it occurs in an unstable synoptic-scale environment, it can result in the development of large MCSs.
SALLJ is also involved when shallow cumulus clouds aligned with the low-level wind shear organize as cloud streets. These cloud streets can be present in each of the three types of SALLJ described in the next section.
Broad Overview
There are three different types of SALLJ, each associated with a different circulation pattern in SESA:
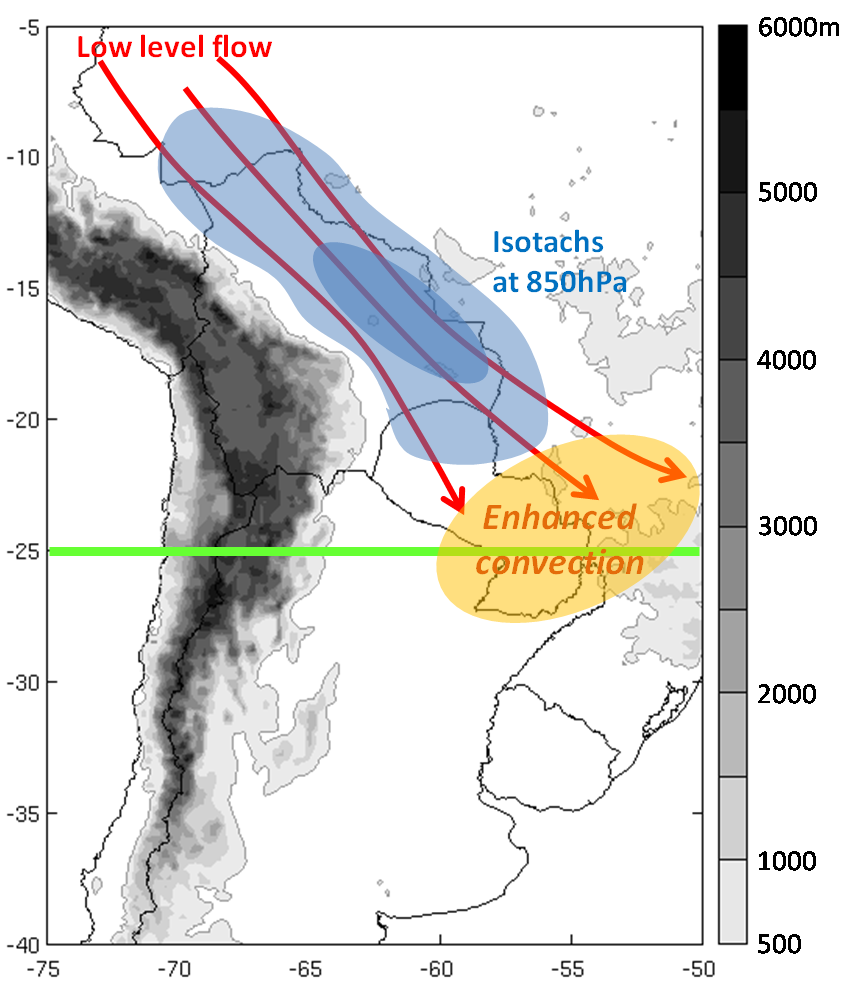
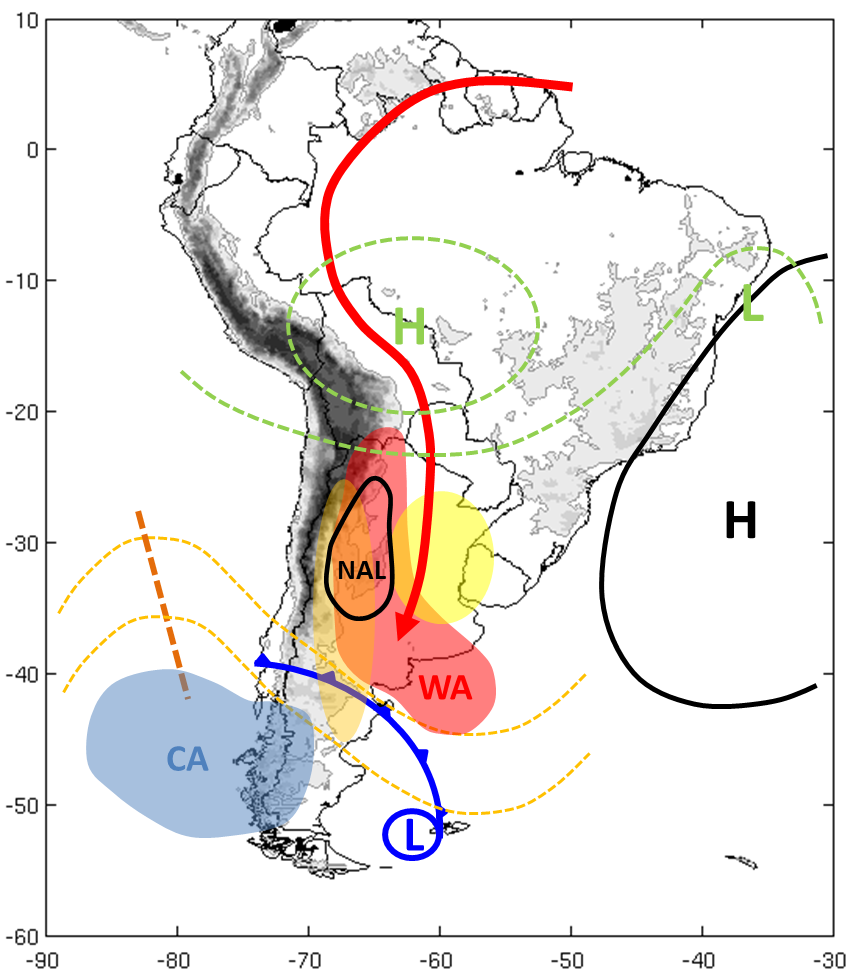
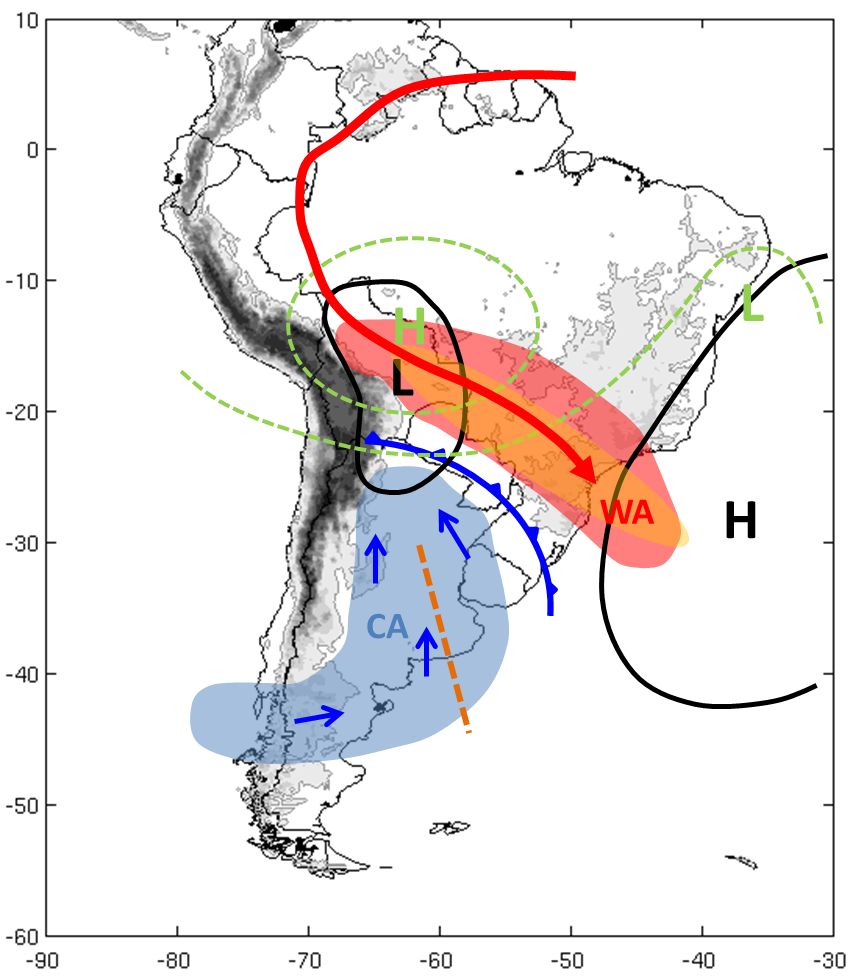
a) Chaco Jet Event (CJE)
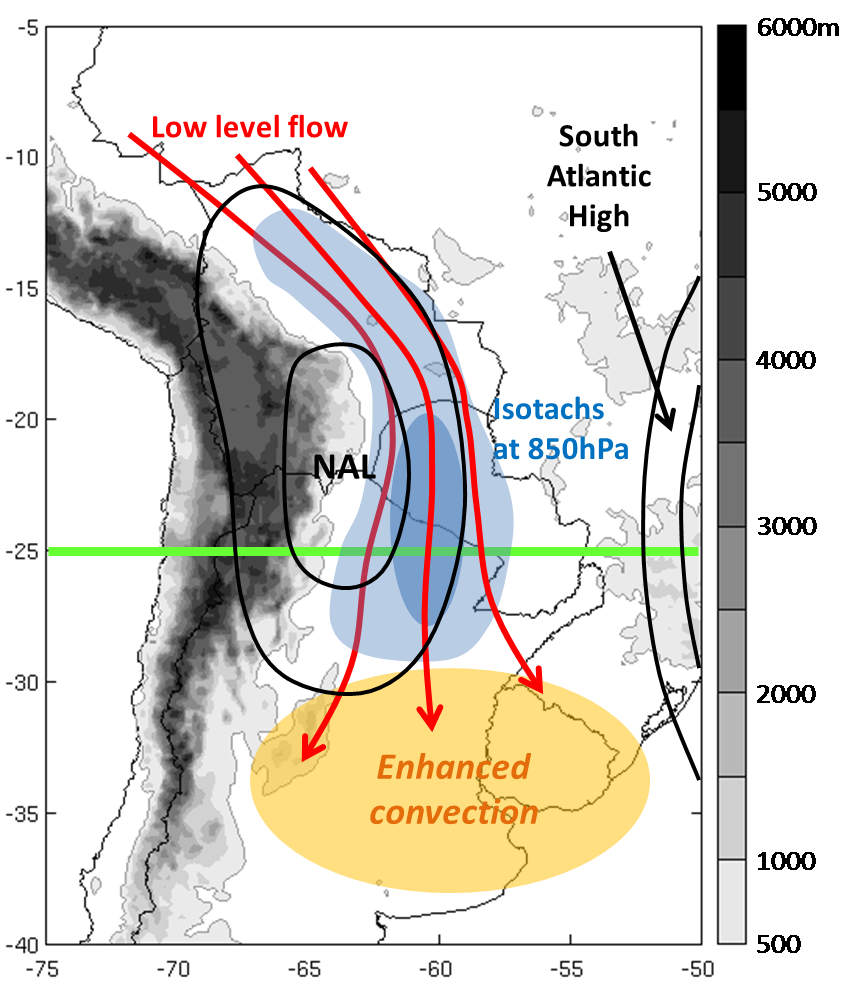
This event occurs when the SALLJ's wind maximum penetrates south of 25°S. The meridional flow lengthens as a consequence of the deepening of the thermal North Argentinian Low (NAL) commonly observed over northwestern Argentina near the Andean slopes (*). The interaction between the NAL and the Atlantic high strengthens the pressure gradient and, by so doing, increases the northerly wind component.
The thermodynamic structure and winds of the Chaco jet enhance convective instability by transporting heat and moisture over SESA. The low- and mid-level moisture flux convergence over the region is ten times greater than the summer mean during this event. The CJE only represents 17% of the mean climatological values of the summer season in the southern Argentina, but accounts for a significant amount of the precipitation in SESA (Salio et al., 2007). Most of the convective activity occurs over central and eastern Argentina, southern Brazil and Uruguay.
|
Schematics of the circulation in low levels during a CJE.
|
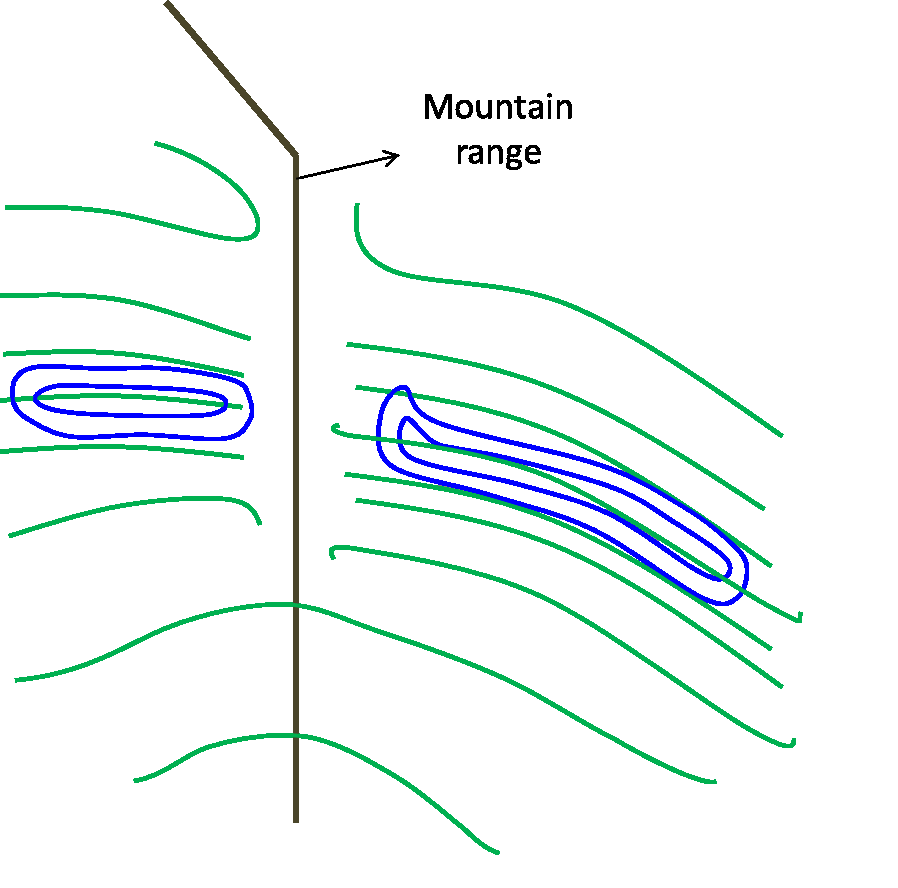
Example: 7 January 2001, 06:00 UTC; red: streamlines 850 hPa; blue: isotachs 850 hPa > 10 m/s; dark orange: IR brightness temperature < 235K; light orange: IR brightness temperature < 210K.
|
|
|
(*)The North Argentinian Low (NAL) is a thermal-orographic low pressure arising from the Chaco Low (CHL). Its mean location is around 30°S- 66°W, but it has a relatively high latitudinal variability. While it is more persistent and intense during the summer, it also occurs intermittently during the winter. The deepening of the NAL relies on two main factors: subsidence of the upper-level flow crossing the Andes, and surface heating at low levels.
b) No Chaco Jet Event (NCJE)
The configuration of these events is similar to that of the CJEs, but the wind maxima do not penetrate south of 25°S. During a NCJE, the wind is more zonal than meridional, whereas with CJEs the meridional component is the most important one.
Convection tends to develop between northern Paraguay and southern Brazil.
|
Schematics of the circulation in low levels under NCJE event
|
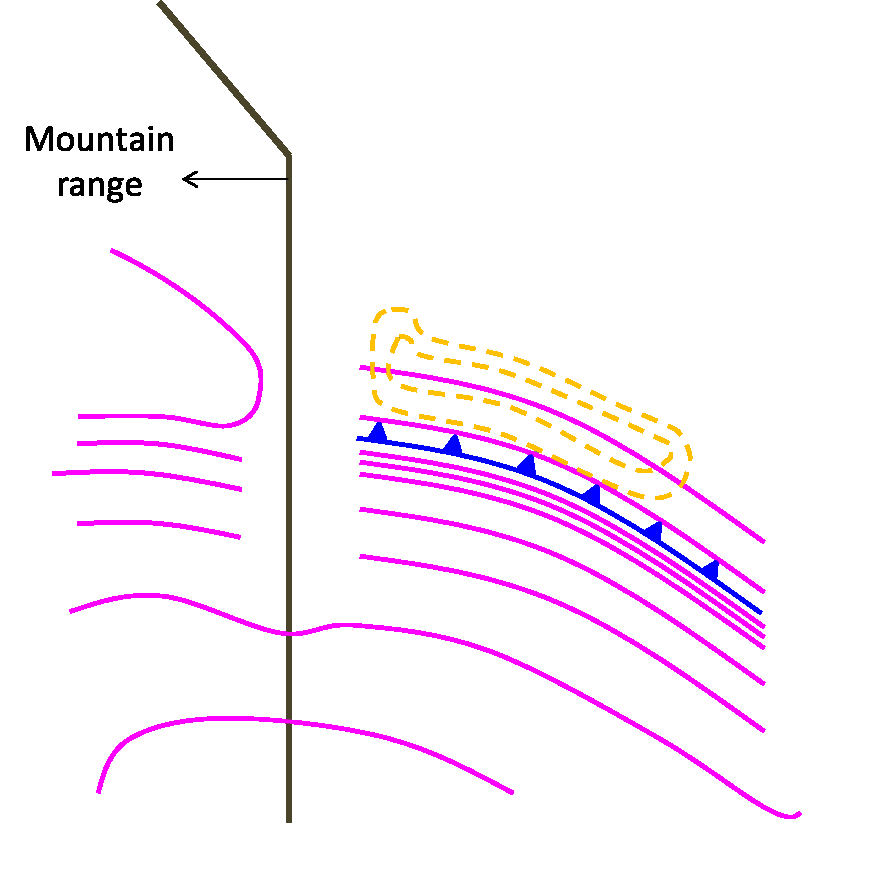
Example: 6 January 2003, 12:00 UTC; red: streamlines 850 hPa; blue: isotachs 850 hPa > 10 m/s; dark orange: IR brightness temperature < 235K; light orange: IR brightness temperature < 210K.
|
|
|
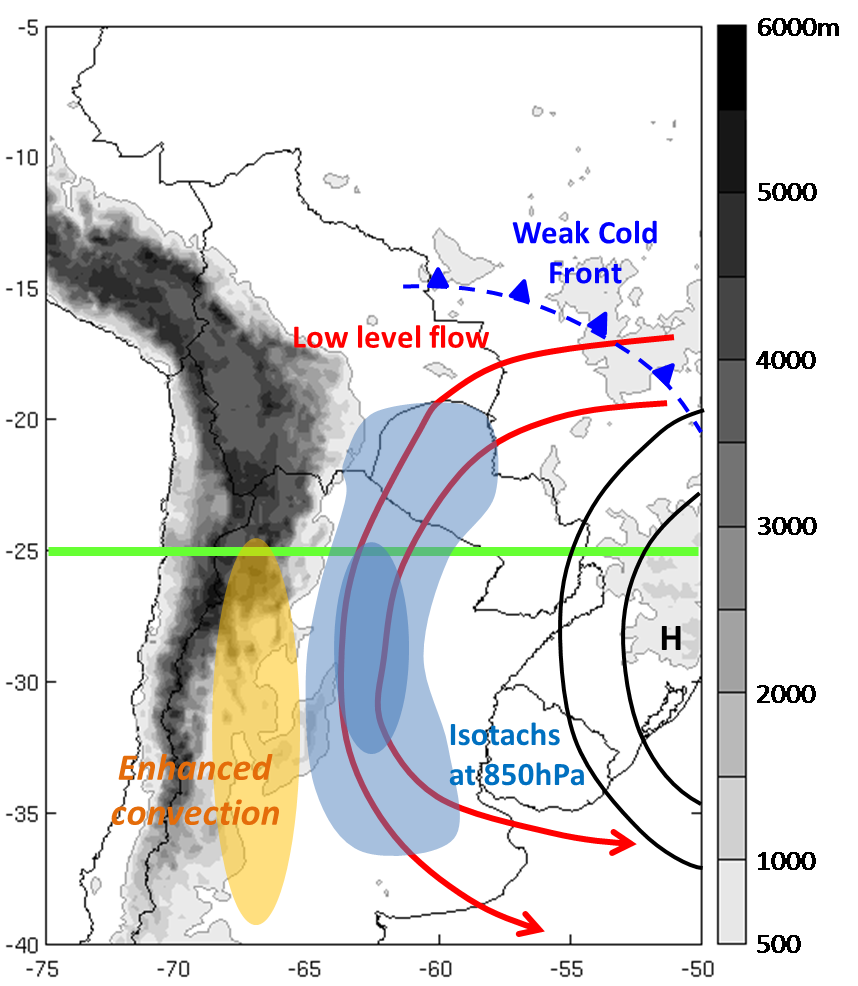
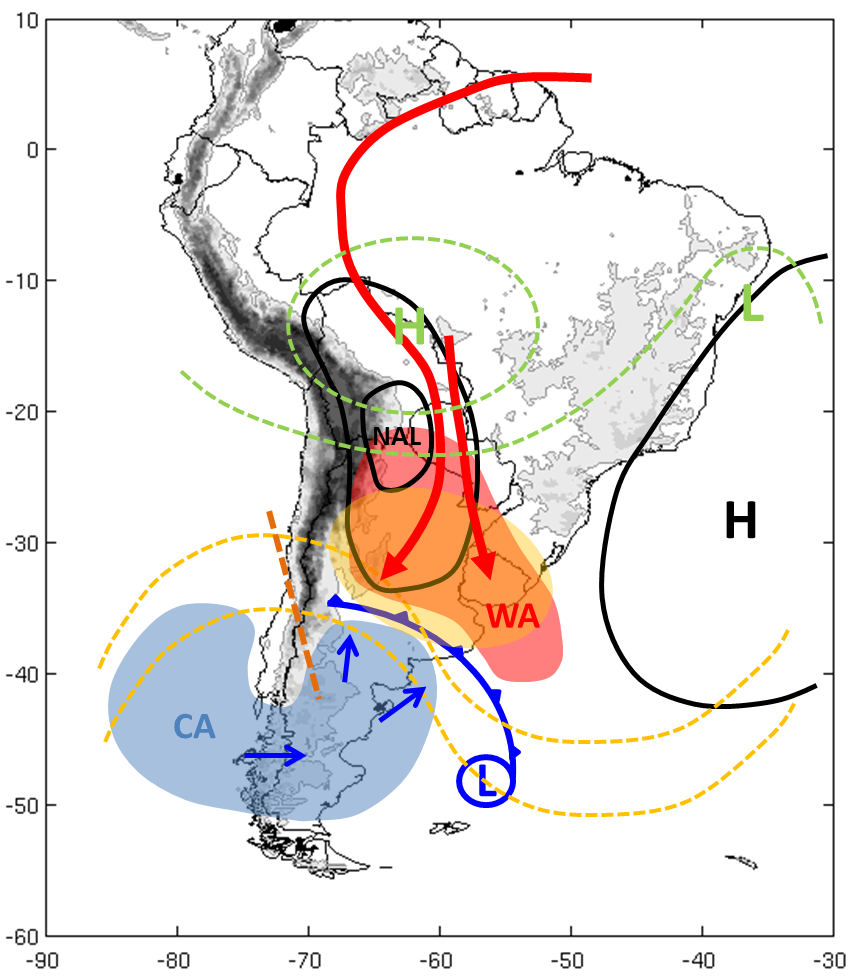
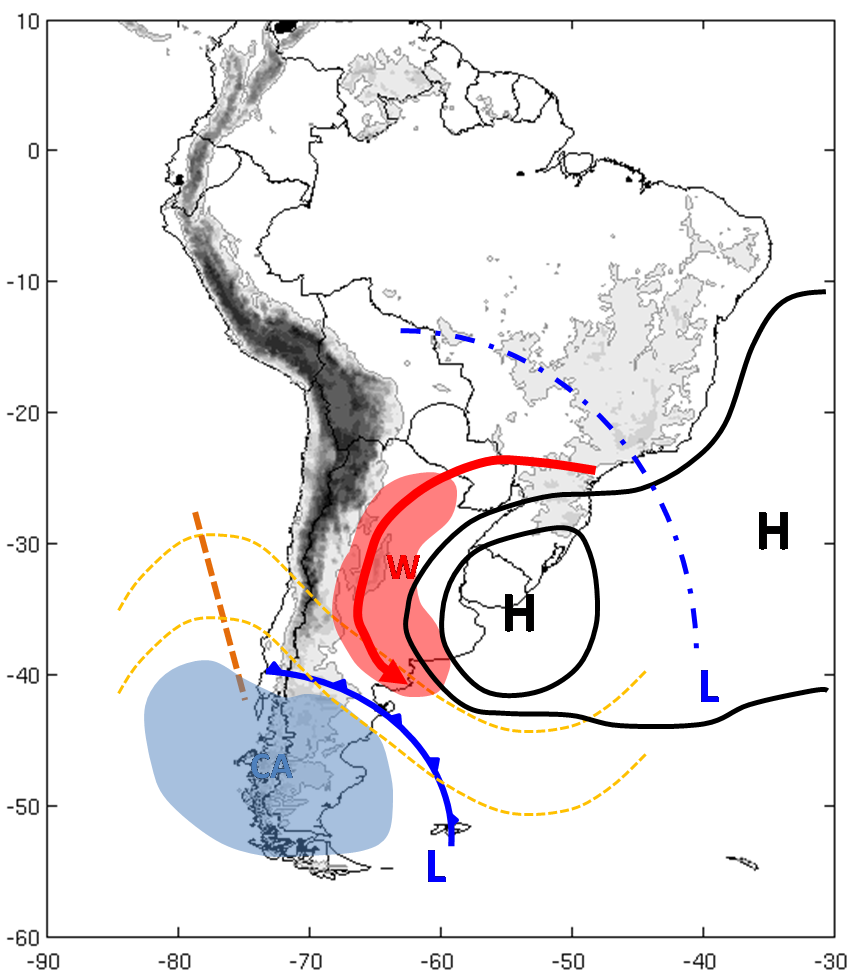
c) Argentinian Low Level Jet (LLJ-ARG)
There is another LLJ east of the Andes that is independent from the northerly SALLJ. It develops along the western periphery of a postfrontal anticyclone. In these cases, in contrast to CJEs and NCJEs, the main source of moisture is the Atlantic Ocean. Precipitation develops along the eastern slopes of the Andes in central and northwestern Argentina.
|
Schematics of the circulation in low levels under LLJ-ARG event.
|
Example: 1 March 2001, 00:00 UTC; red: streamlines 850 hPa; blue: isotachs 850 hPa > 10 m/s; dark orange: IR brightness temperature < 235K; light orange: IR brightness temperature < 210K.
|
|
|
Seasonal variety of the low-level jets
Table 1 shows the frequency of days with different types of LLJ during the four seasons (SON=spring, Sep-Nov; DEF=summer, Dec-Feb; MAM=autumn, Mar-May; JJA=winter, Jun-Aug). CJEs occur on 24% of all days, with higher frequency in winter and spring. On the other hand, NCJEs have a higher frequency in autumn and winter. LLJ-ARG events are equally distributed during all seasons with a frequency of 17% (Salio and Nicolini, 2006).
|
Table1: Frequency of LLJ occurrences by type in SESA (2000-2003)
|
|||||
| SON % | DJF % | MAM % | JJA % | Total % | |
|---|---|---|---|---|---|
| CJE | 25 | 21 | 19 | 30 | 24 |
| NCJE | 14 | 15 | 11 | 9 | 12 |
| LLJ-ARG | 17 | 14 | 18 | 19 | 17 |
| NOLLJ | 44 | 50 | 52 | 42 | 47 |
| Total | 100 | 100 | 100 | 100 | 100 |
Note: These percentages refer only to days when some type of LLJ is present; they are not related to the presence of MCS.
Diurnal cycle of the low-level winds
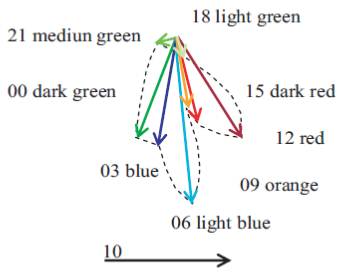
The low level wind maximum experiences variations in intensity during the day. At night, the decoupling of the surface layer from the boundary layer above results in the intensification of the LLJ. This decoupling disrupts the balance between the pressure gradient, Coriolis and frictional forces, creating inertial oscillation of the wind about its would-be equilibrium position. The oscillation leads to super-geostrophic winds and is responsible for the nocturnal low-level wind maximum, as shown in the figure corresponding to the summer diurnal cycle in Asunción, Paraguay (Nicolini et al., 2004).
|
Mean summer diurnal wind gyre (m/s) at Asunción, Paraguay (25°16' S, 57°40' W) at 1000 m asl. UTC times.
|
|
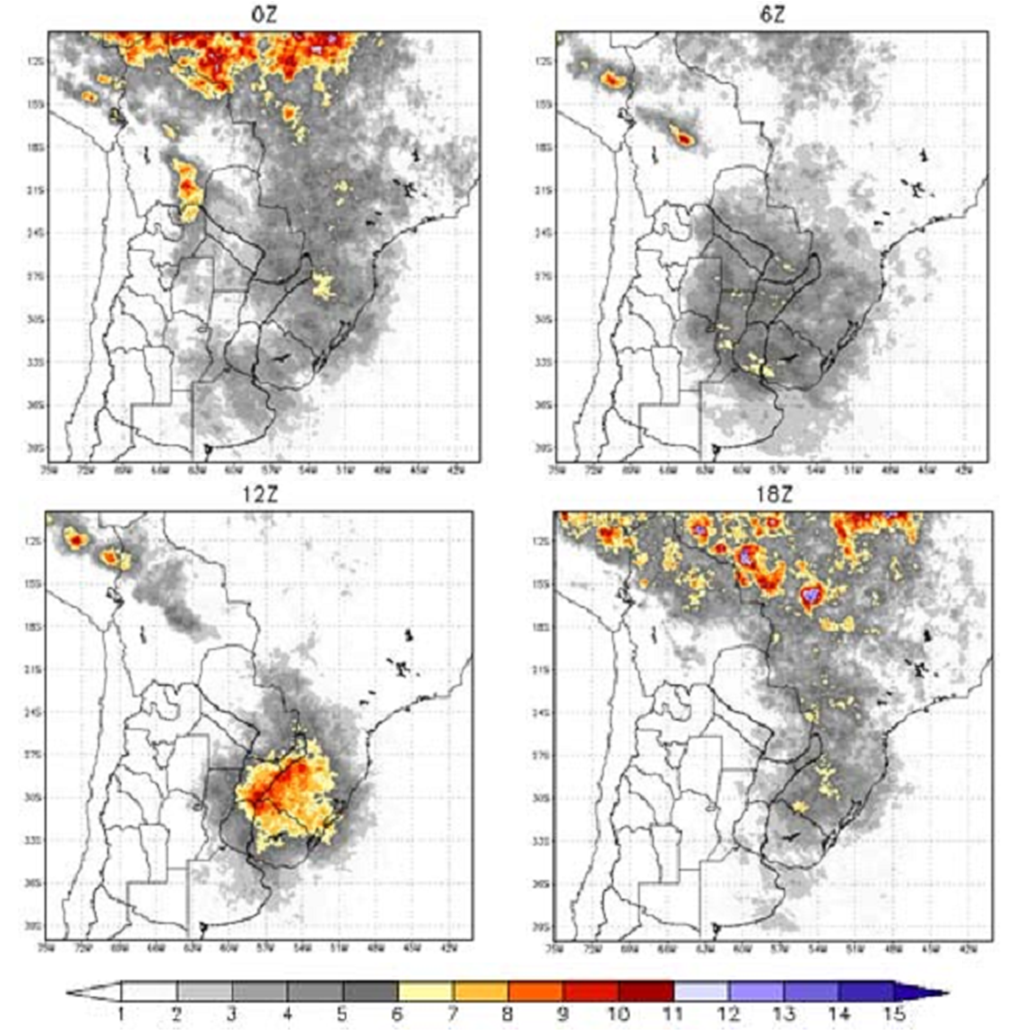
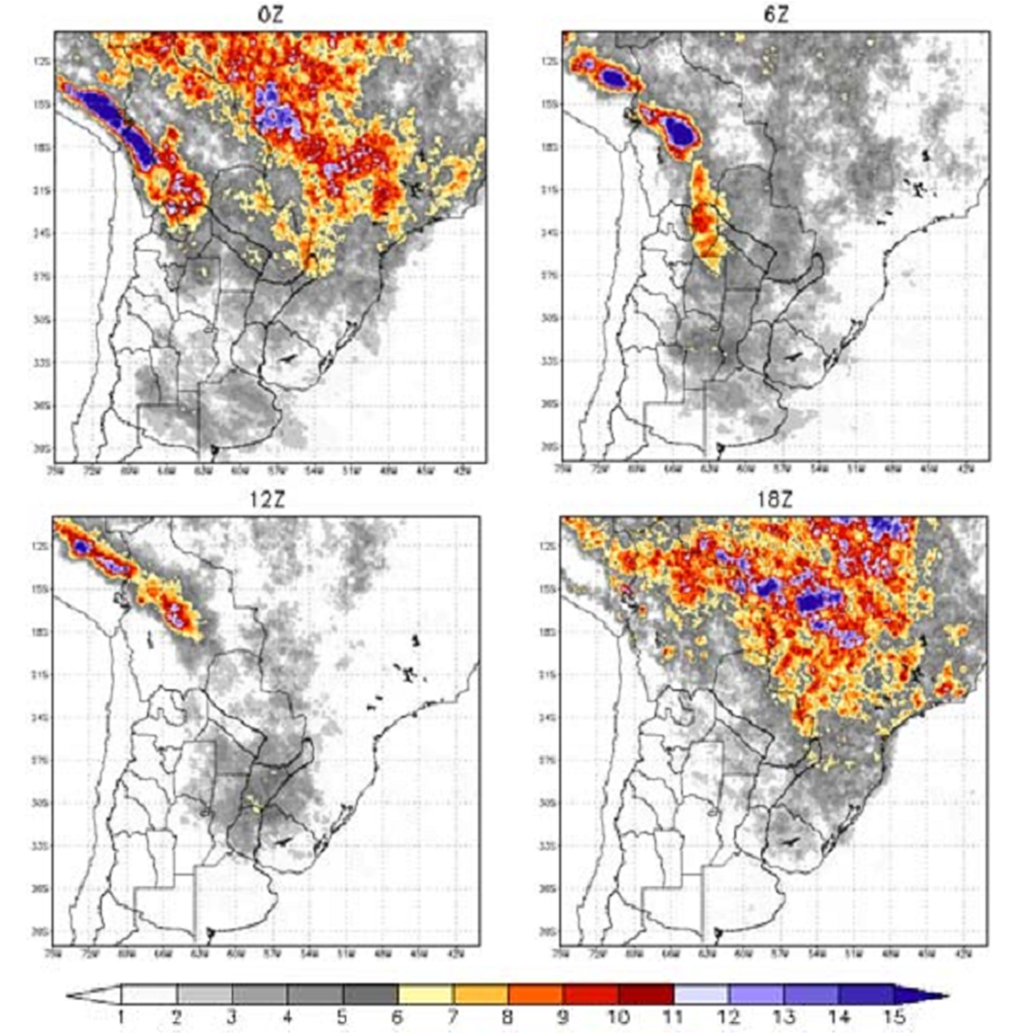
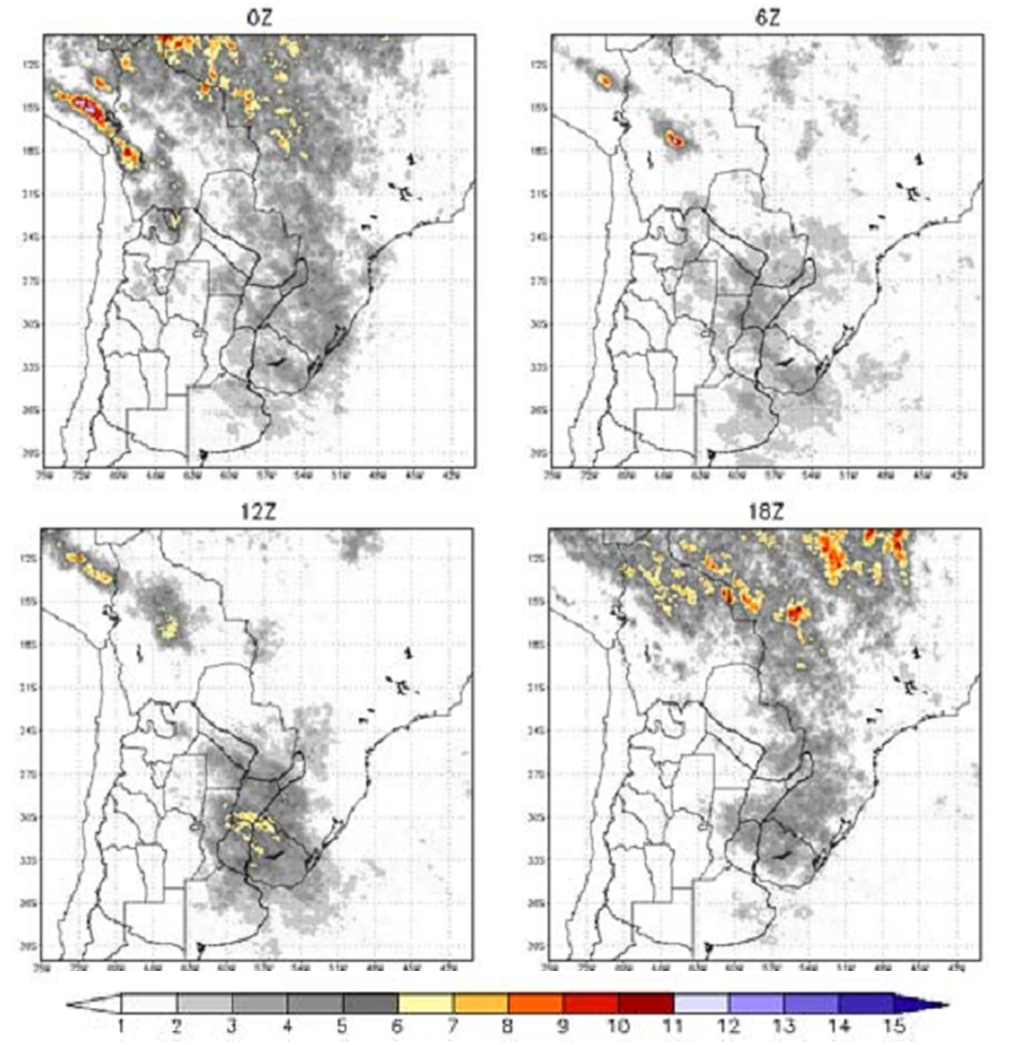
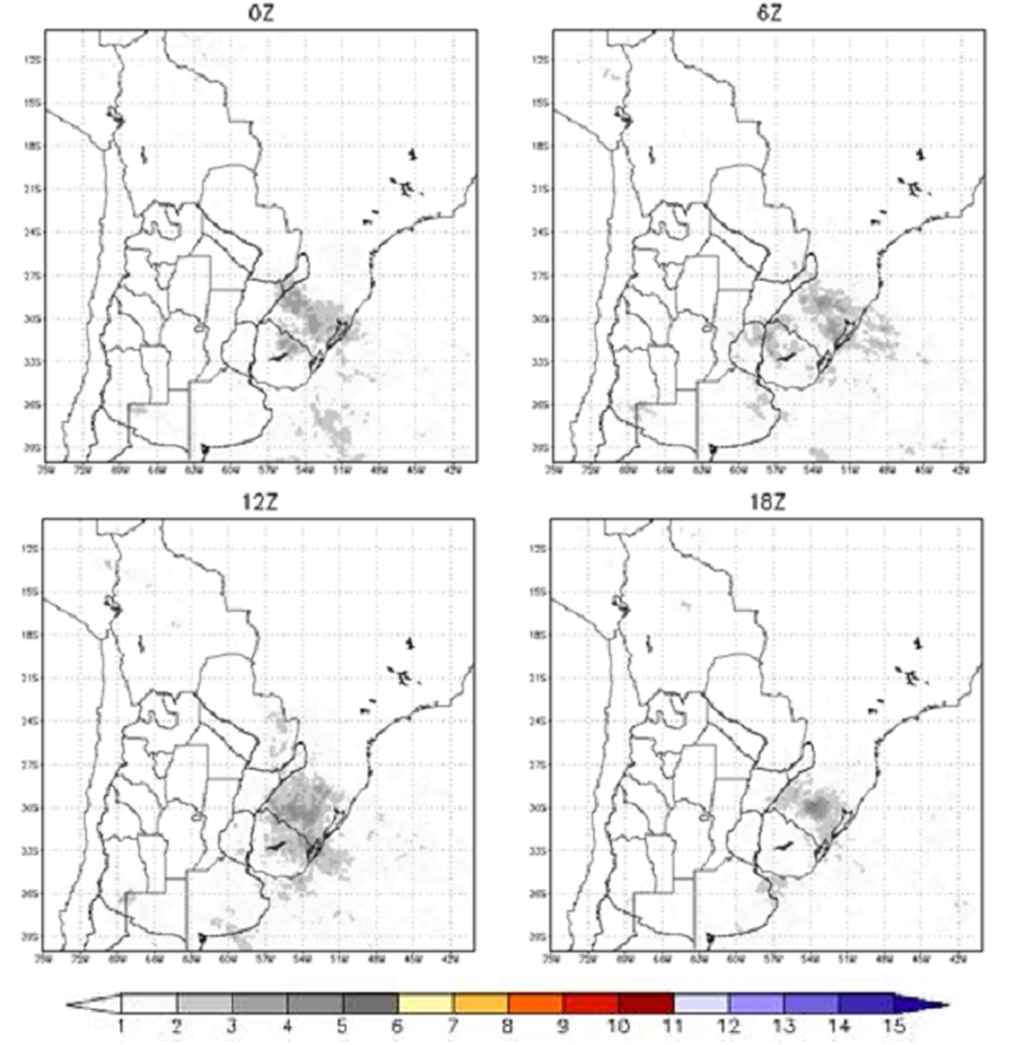
Seasonal and diurnal cycle of the convection
Convection over South America is affected by the seasonal migration of the Intertropical Convergence Zone (ITCZ). In summer, there is an increase in the intensity and frequency of convection over tropical South America. The maximum occurs during the hours of greatest radiational heating over Brazil and the Altiplano, while nocturnal convection develops over the low lands of Bolivia. In winter, due to a decrease in solar heating, there are inversions and less moisture in the troposphere, and convection is scant.
Convection over subtropical latitudes is characterized by a maximum near 32°S-58°W at 12 UTC. This maximum is prominent in spring and less substantial in summer and autumn; in winter it does not exist. There is a difference between Argentina and southern Brazil and Uruguay; in the latter two, the convection is present throughout the day, with maximum activity at night, while over Argentina the convection declines at 18 UTC in all seasons.
In the eastern slopes of the Andes, the maximum of convective activity occurs at 06 UTC. It is more pronounced in summer than in other seasons.
|
Convection frequency (percentual) every 6 hours in spring (SON) (Salio and Nicolini, 2006).
|
Convection frequency (percentual) every 6 hours in summer (DJF) (Salio and Nicolini, 2006).
|
|
|
|
Convection frequency (percentual) every 6 hours in autumn (MAM) (Salio and Nicolini, 2006).
|
Convection frequency (percentual) every 6 hours in winter (JJA) (Salio and Nicolini, 2006).
|
|
|
In summary, convection south of 25°S is clearly linked with the SALLJ. In spring and fall it exhibits a nocturnal maximum over the western and central parts of SESA. In summer there are two phases of maximum convection; one is nocturnal and the other occurs during the afternoon, especially in the eastern parts of the area. The nocturnal convection is initiated by the low-level jet maximum. In the evening the convection is triggered by the solar heating of the surface.
During LLJ-ARG events, there is no diurnal cycle in the convection.
Life Cycle of SALLJ
1. Life cycle of the Chaco Jet type
| Day - 1 | |
|
|
| Day - 0 | |
|
|
| Day + 1 | |
|
|
2. Life cycle of the No Chaco Jet type
The synoptic patterns are not as distinct as for the CJE type.
| Day - 0 | |
.png)
|
|
3. Life cycle of the LLJ-Argentina type
| Day - 0 | |
|
|
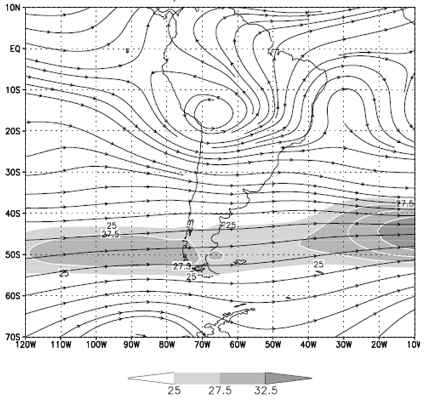
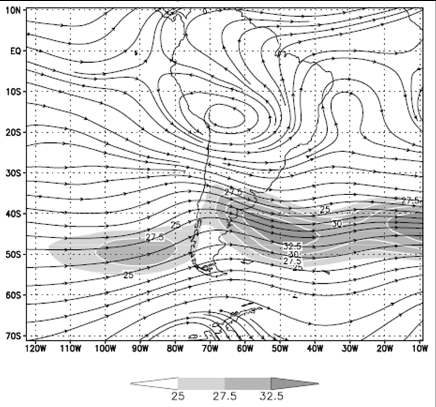
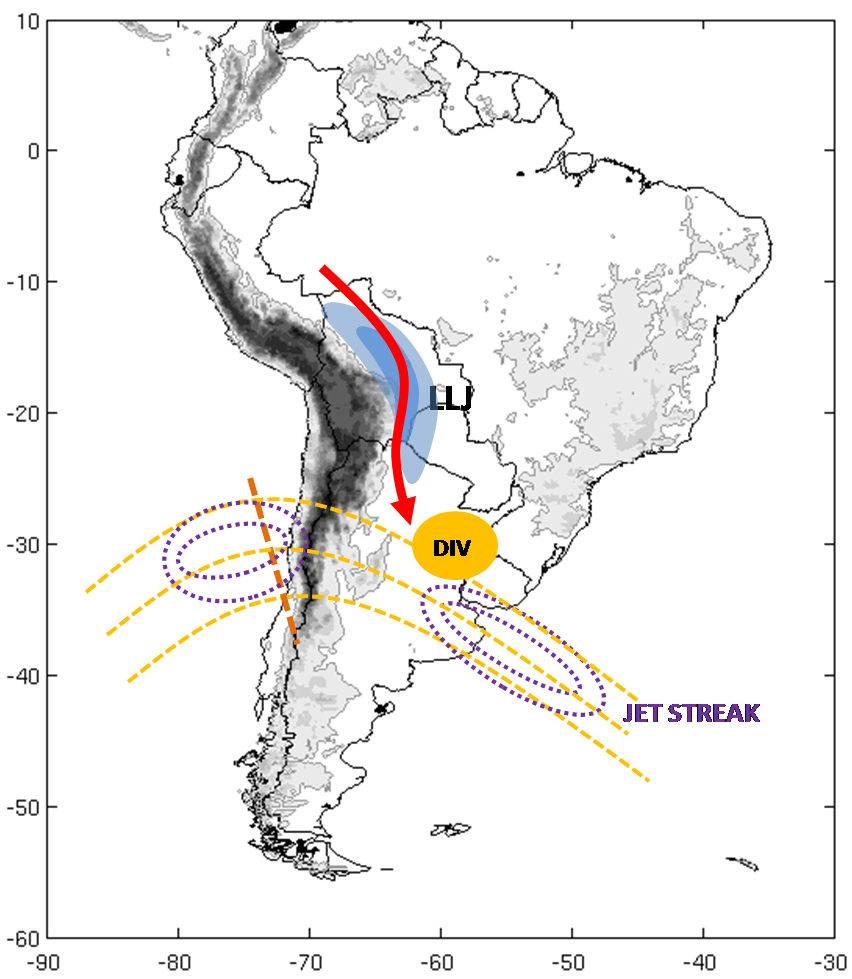
Connection between SALLJ and the upper-level jet (ULJ) for Chaco Jet events
The mean upper level wind field shows a zonal maximum around 50°S. However, for the CJE cases, the ULJ streak shows a more important meridional component with 2 jet streaks: one of them SW-NE oriented upwind of the Andes and the other one downwind with a NW-SE orientation.
|
a) Mean summer high-levels streamlines and wind speed (values greater than 25 m/s are shaded) at 300 hPa. Period: 1979-1993 sum
|
b) Streamlines and wind speed composite (contoured values greater than 25 m/s are shaded) for Chaco Jet events at 300 hPa for summers 1979-1993. Salio et al (2003)
|
|
|
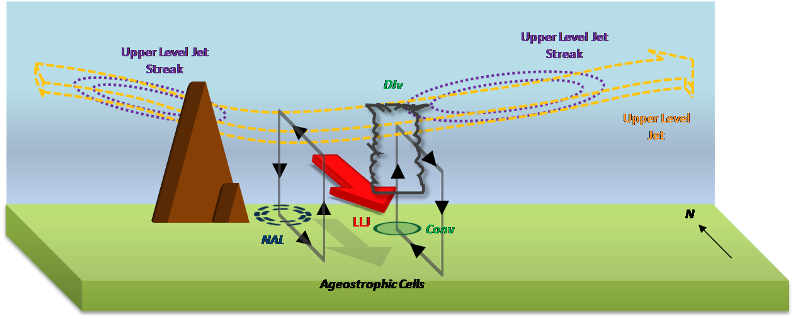
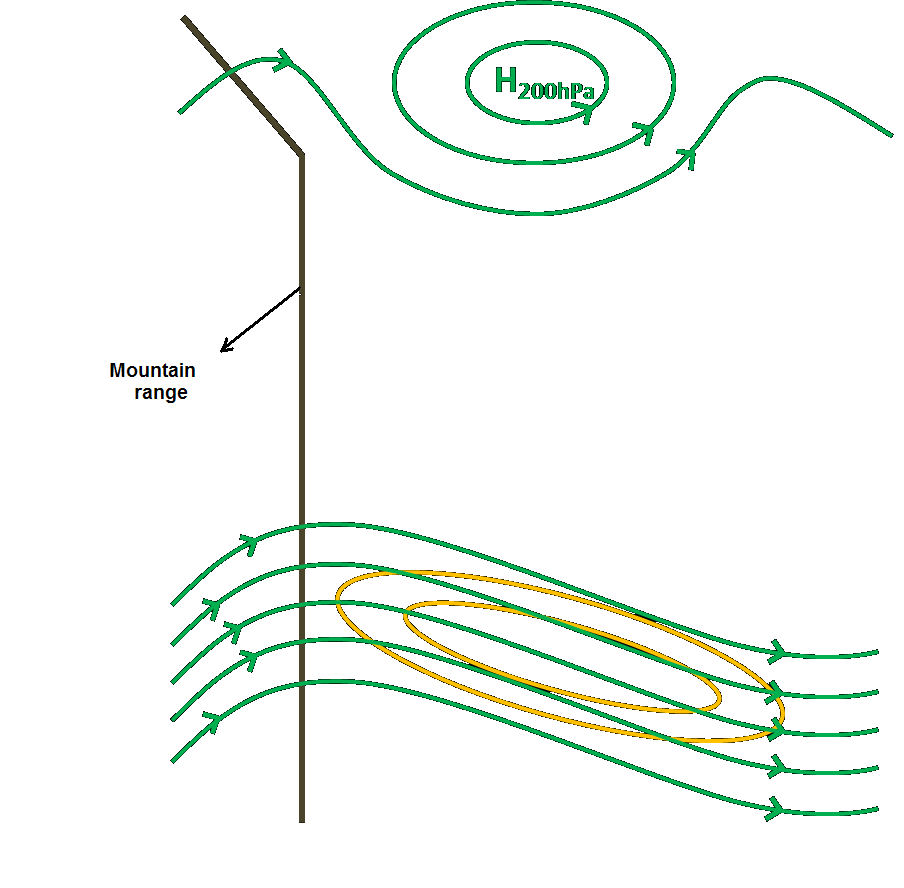
a) Dynamic aspect: secondary ageostrophic circulations
- The ULJ upwind of the Andes decelerates as it crosses the mountains. This favours a meridional indirect ageostrophic circulation on its exit region. Its low level branch, a northerly wind flow, then reinforces the SALLJ. Furthermore, as the upper jet crosses the Andes, the ensuing subsidence on the lee of the mountains induces heating and negative pressure anomalies at low levels. These anomalies are associated to the NAL.
- The NW-SE upper level jet streak produces a direct ageostrophic circulation on its entrance region. The interaction between the low level branch and the LLJ reinforces the convergence at the left entrance region of the ULJ facilitating the development of convection in this area.
|
|
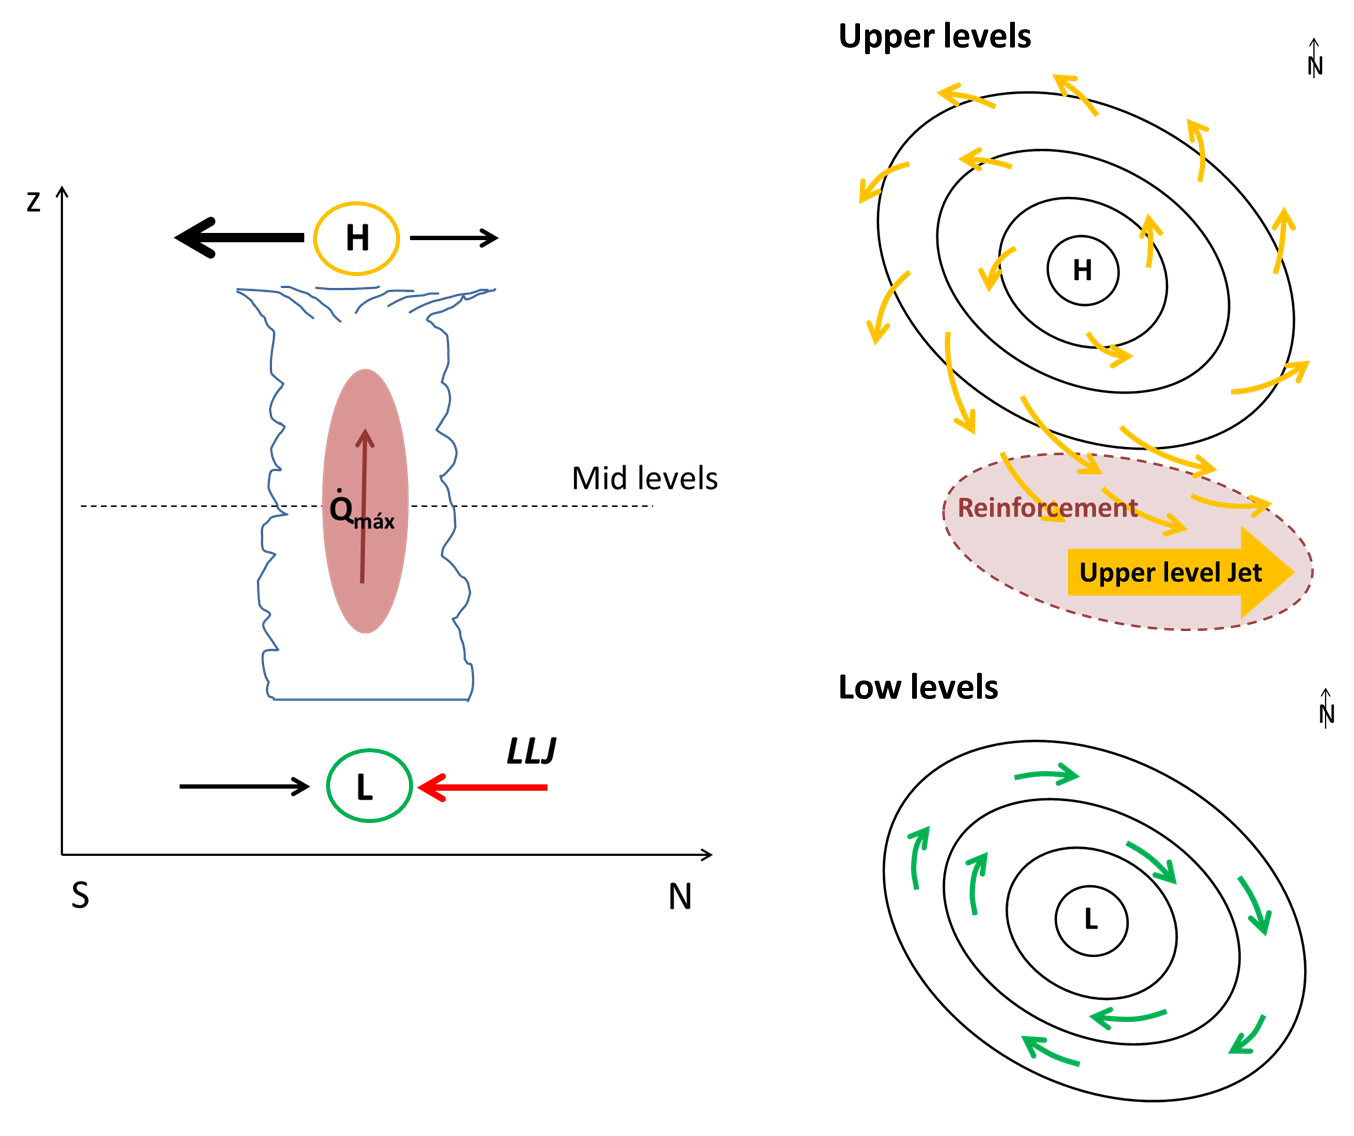
b) Interaction between SALLJ and deep convection
- The low level convergence, as it couples with upper divergence on the right entrance region of the jet maximum (direct ageostrophic circulation), favours and helps sustaining the strong moist convection. Moreover, the LLJ becomes accelerated by the convection itself. These processes facilitate the development of deeper and better organized convection as MCSs in the region.
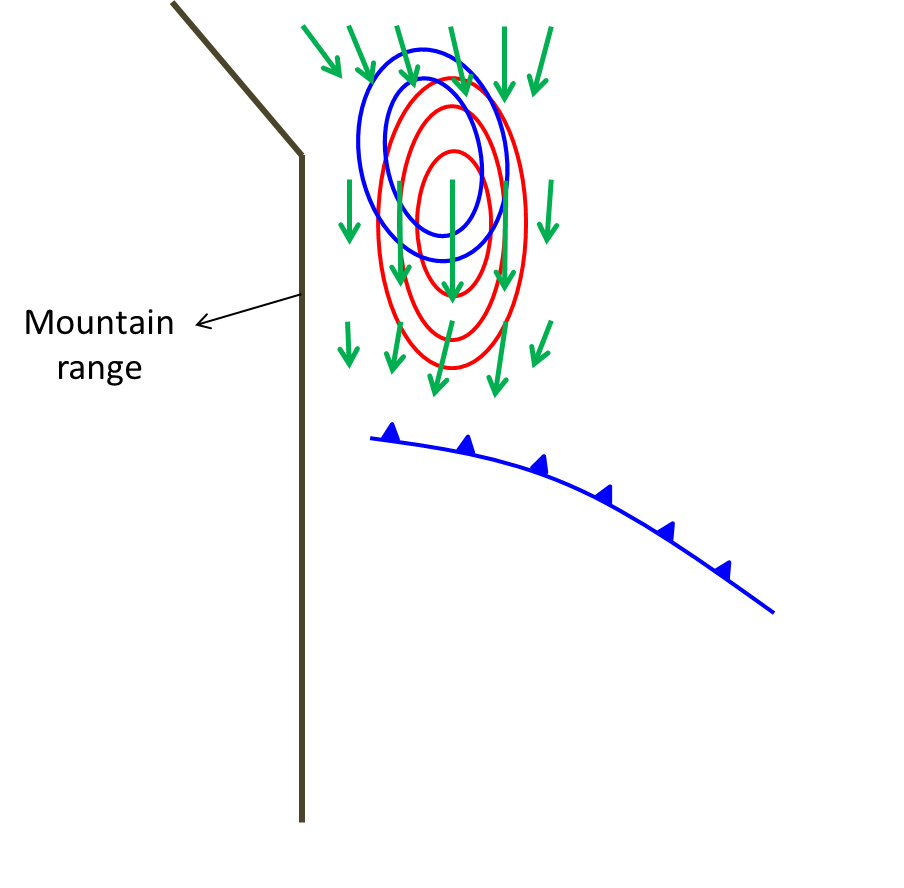
- In association to this MCS there is an important latent heat release at mid levels that promotes a low pressure anomaly at low levels and divergence at higher levels in response to the geostrophic balance. Consequently, there are 2 meridional transverse circulations: a direct one to the south of the MCS and another indirect cell to the north.
- The low pressure anomaly at low levels generates a cyclonic circulation more intense to the SW due to a greater pressure gradient. This reinforces the southern flow near surface in the direct circulation.
- An anticyclonic circulation appears in upper levels with the southern region flow more intense because the Coriolis force. This flow has an ageostrophic nature and experiments an counterclockwise gyre while it is advected by the upper level jet, which is consequently reinforced.
|
(Saulo et al., 2007)
|
|
Key Parameters
- Bonner criterion 1 is used to identify the SALLJ events and requires the following:
- Isotachs at 850 hPa: maximum wind intensity equal to or greater than 12 m/s.
- Wind shear 850-700 hPa: the wind speed difference between 850 and 700 hPa equal to or greater than 6 m/s in some part enclosed by the 12 m/s isotach.
- Wind vectors at 850 hPa: the meridional component must be northerly and greater than the zonal component in the entire region enclosed by the 12 m/s isotach.
- Equivalent thickness 850-500 hPa: maximum gradient in the frontal zone.
- Thermal front parameter (TFP): maximum values of TFP in the frontal zone.
- Moisture convergence at 850 hPa: maximum moisture convergence ahead of the front.
- Streamlines at 200 hPa: well-developed Bolivian High.
- Isotachs at 250 hPa: upper level jet at the leading side of the mid-latitude trough.
NOTE: These key parameters are shown in the following example only for a Chaco Jet event, where the synoptic pattern is the most favourable for the atmosphere destabilization over Argentina.
Bonner Criterion 1: Wind shear 850-700 hPa, isotachs and wind vectors at 850 hPa.
|
|
28 February 2002/06.00 UTC - GOES 13 IR 10.8 image; blue: wind shear 850-700 hPa, red: isotach at 850 hPa, green vector: wind at 850 hPa.
|
|
|
Equivalent Thickness 850-500 hPa and TFP
|
|
28 February 2002/06.00 UTC - GOES 13 IR 10.8 image; green: equivalent thickness, blue: TFP.
|
|
.gif)
|
Moisture convergence and Thetae at 850 hPa
|
|
28 February 2002/06.00 UTC - GOES 13 IR 10.8 image; magenta: equivalent potential temperature 850 hPa, yellow: humidity convergence, green vector: wind at 850 hPa.
|
|
|
Streamlines at 200 hPa and isotach at 250 hPa
|
|
28 February 2002/06.00 UTC - GOES 13 IR 10.8 image; yellow: isotachs at 250 hPa, green: streamlines at 200 hPa.
|
|
|
Typical Appearance In Vertical Cross Sections
Here are some relevant features from the NWP parameters that describe the vertical structure of the SALLJ events:
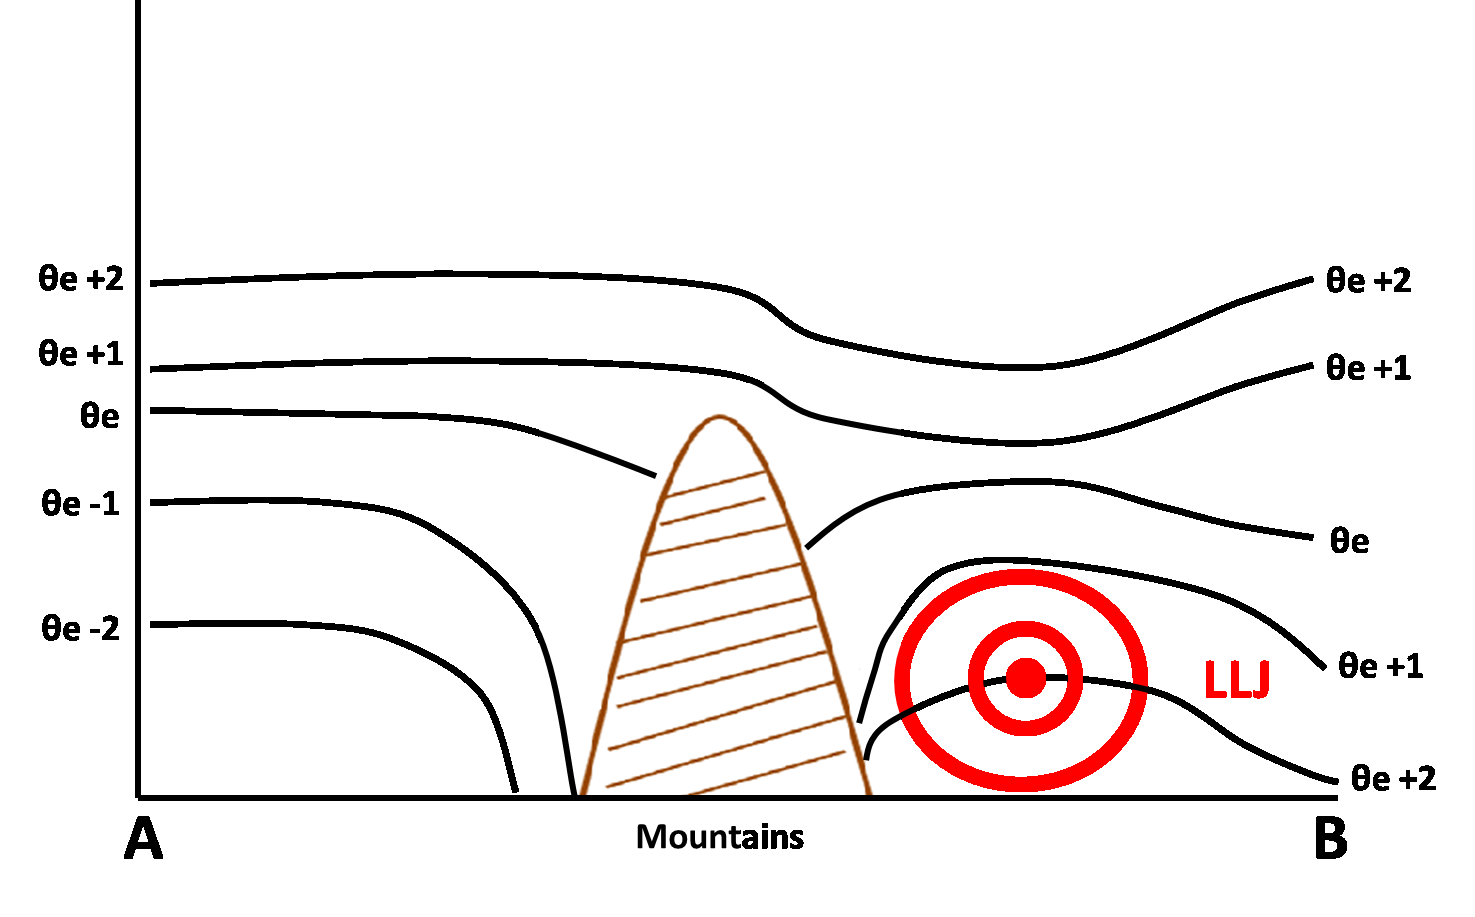
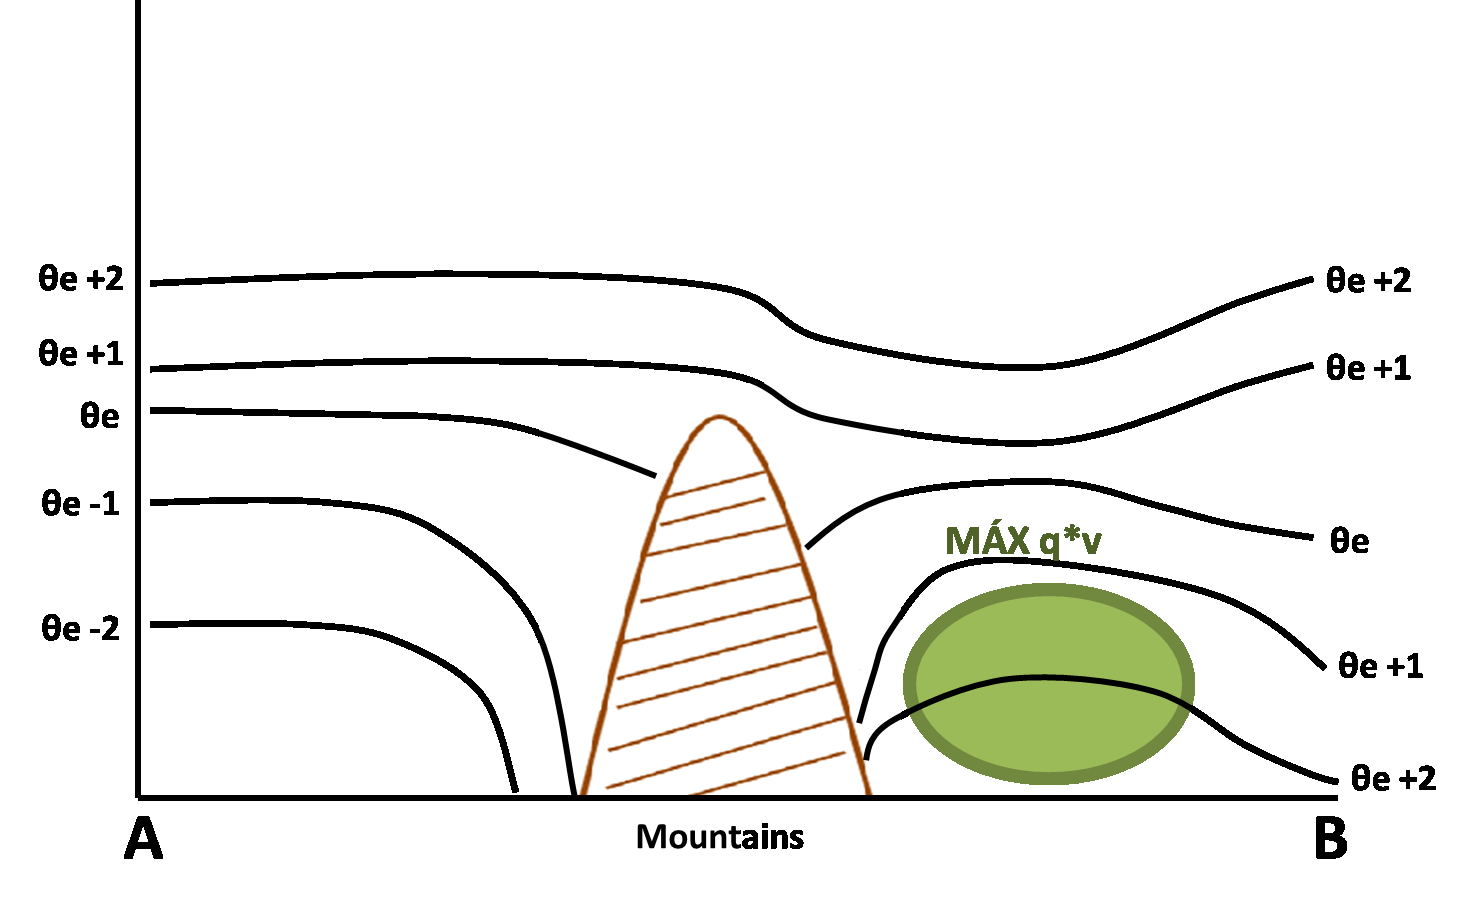
- Meridional wind: maximum of the northerly wind immediately to the east of the Andes at around 850 hPa.
- Equivalent potential temperature: statically unstable area accompanying the wind maximum.
- Meridional moisture transport: maximum of moisture transport from tropical latitudes accompanying the wind maximum.
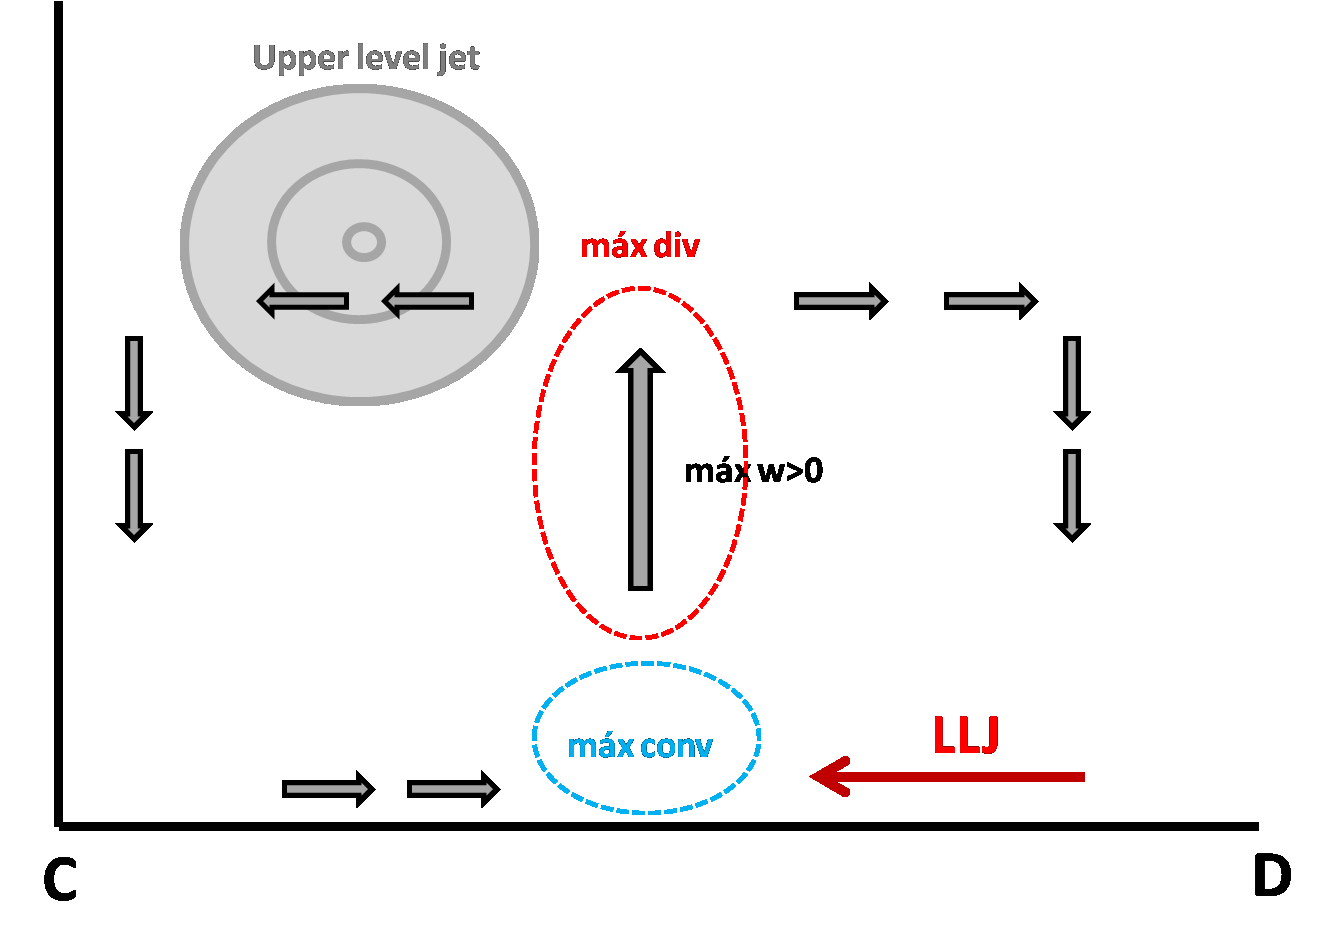
- Convergence and vertical motions: maximum of convergence at low levels and maximum of vertical motion at middle levels in the LLJ exit region.
Zonal vertical cross section
.png)
|
.gif)
|
Meridional Wind and Theta-e
|
|
Lat: 27 °S. Meridional wind velocity (shaded, m/s); black: isentropes (theta-e, K) - 28 Dec 2002 12 UTC
|
|
|
Meridional Moisture Transport
|
|
Lat: 27 °S. Meridional moisture transport (shaded, g/kg*m/s); black: isentropes (theta-e, K) - 28 Dec 2002 12 UTC
|
|
|
Meridional vertical cross section
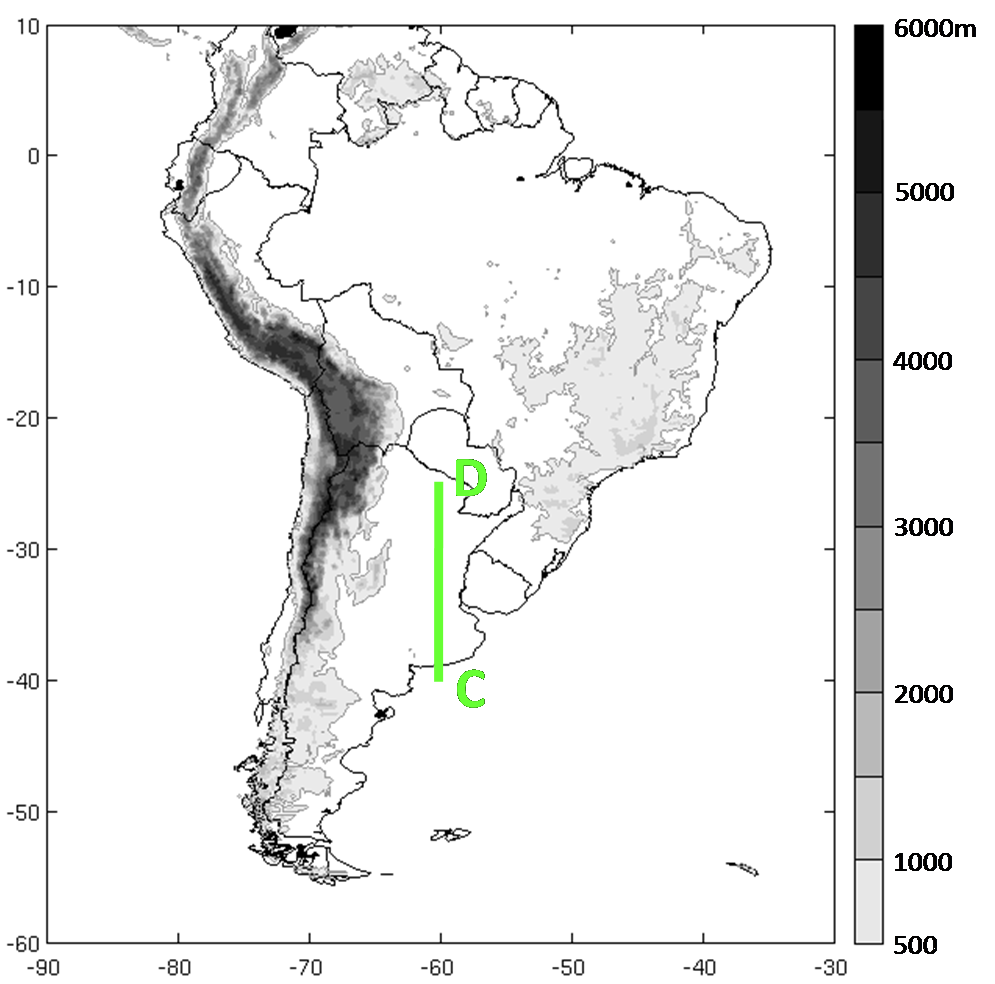
Low Level Convergence and Meridional Circulation
|
|
Lon: 60 °W. Zonal wind (shaded, m/s); contours: divergence; arrows: meridional circulation (m/s) 28 Dec 2002 12 UTC
|
|
|
Weather Events
Significant weather events are related to the occurrence of mesoscale convective systems. In Southeastern South America (SESA), where these systems are related to the presence of SALLJs, the principal weather events are heavy precipitation, gusts, hail, lightning, and tornadoes.
| Parameter | Description |
|---|---|
| Precipitation |
|
| Temperature |
|
| Wind (incl. gusts) |
|
| Lightning |
|
| Other relevant information |
|
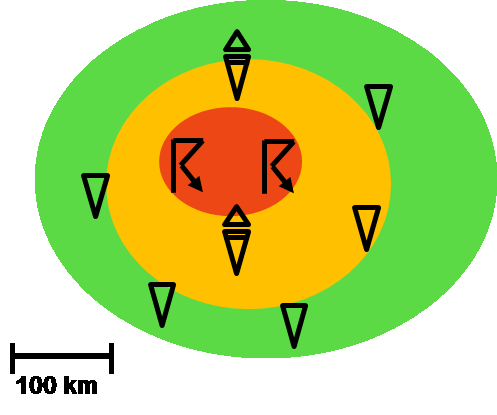
The following schemes show the main three types of MCS in SESA and the location of the significant weather events:
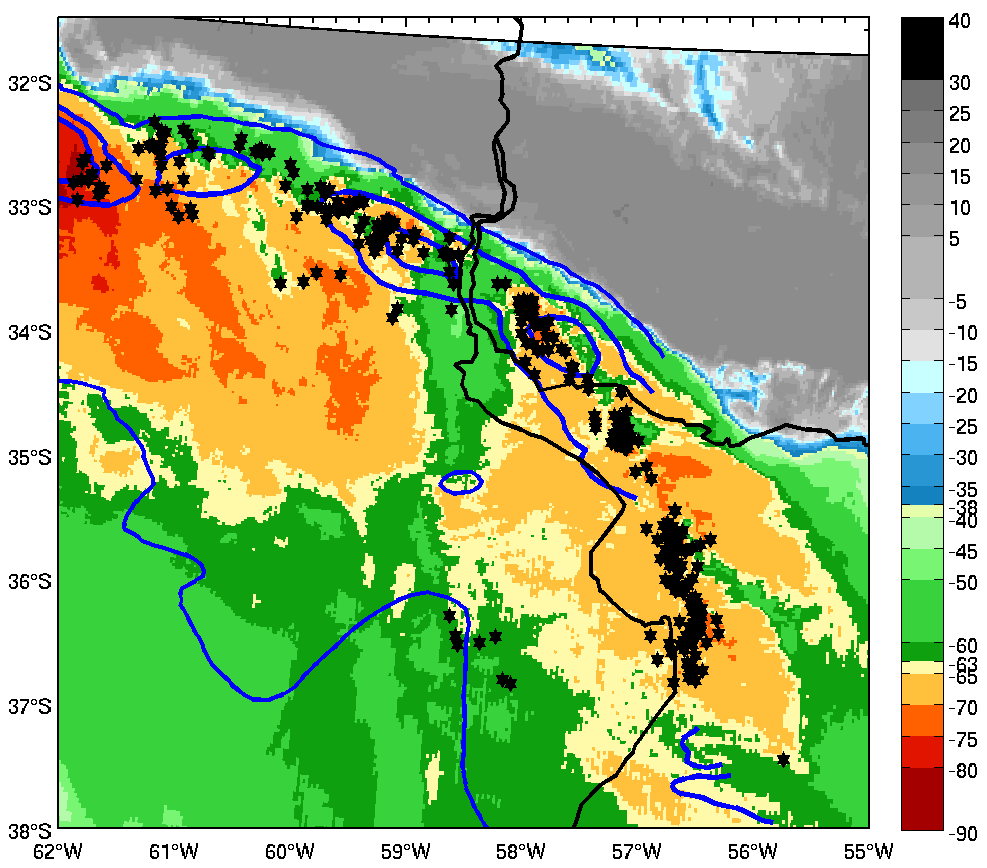
Squall line
|
|
10 January 2001/05.25 UTC - TRMM/VIRS IR 10.8 image, LIS lightning location (black dots) and TMI rain rate (blue contours).
|
|
|
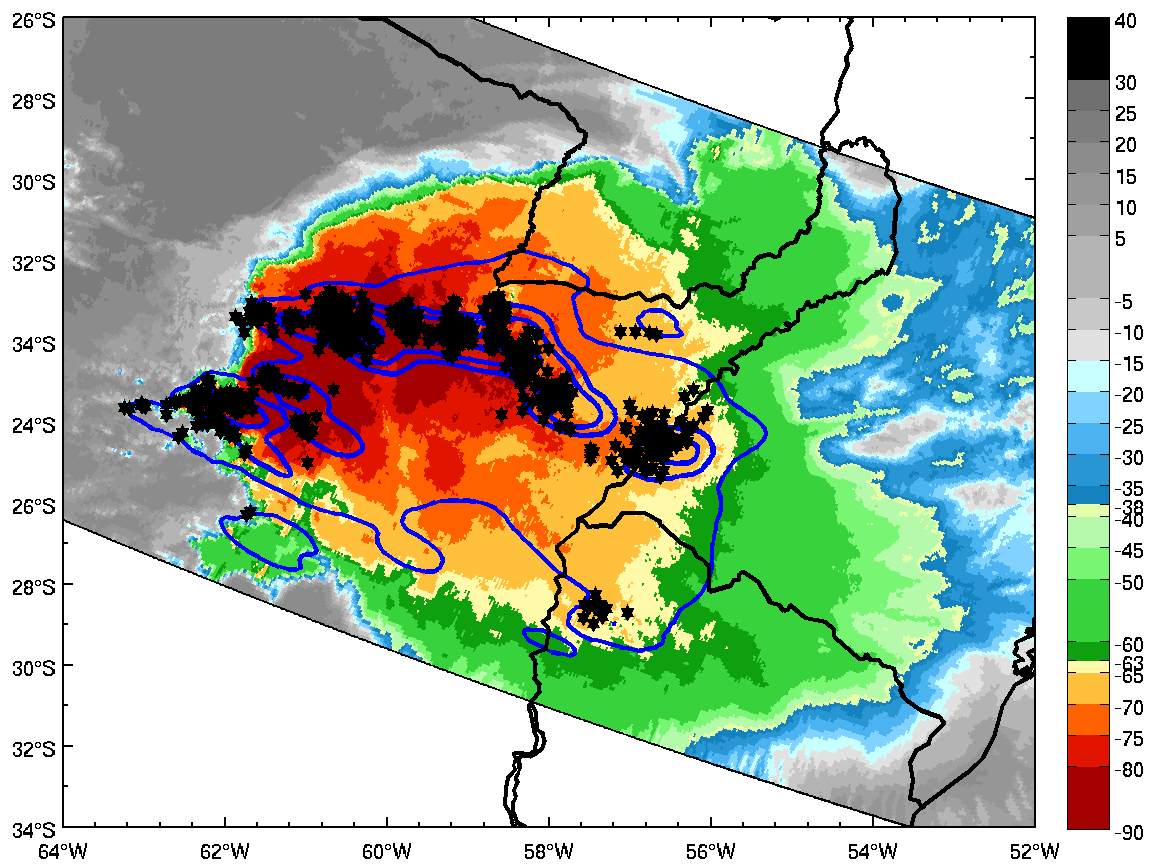
Symmetric System
|
|
21 December 2003/08.22 UTC - TRMM/VIRS IR 10.8 image, LIS lightning location (black dots) and TMI rain rate (blue contours).
|
|
|
MCS with embedded supercells
|
|
15 November 2006/23.36 UTC - TRMM/VIRS IR 10.8 image, LIS lightning location (black dots) and TMI rain rate (blue contours).
|
|
|
References
- Cecil, Daniel J., 2009: Passive Microwave Brightness Temperatures as Proxies for Hailstorms. J. Appl. Meteor. Climatol., 48, 1281-1286.doi: http://dx.doi.org/10.1175/2009JAMC2125.1
- Nicolini, M., Saulo, C., Torres, J. and Salio, P., 2002. Enhanced precipitation over southeastern South America related to strong low-level jet events during austral warm season. Meteorologica (Special Issue on South American Moonsoon System) 27, 59-69.
- Nicolini, M., Salio, P., Ulke, G., Marengo, J., Douglas, M., Peagle, J. and Zipser, E., 2004. South America Low Level Jet diurnal cycle and three dimensional structure. CLIVAR Exchanges, 9 (1), 6-8.
- Rotunno, R., J. B. Klemp, and M. L. Weisman, 1988: A theory for strong, long-lived squall lines. J. Atmos. Sci., 45, 463-485.
- Salio, P., Nicolini, M. and Saulo, C., 2002. Chaco low-level jet events chacaracterization during the austral summer season. Journal of Geophysical Research, 107, 4816.
- Salio, P. and Nicolini, M., 2006. Seasonal characterization of the diurnal cycle of convection frequency over southeastern South America under different low-level conditions. Proceedings of 8 ICSHMO, Foz do Iguacu, Brazil. April 24-28, 2006. P. 1157-1162.
- Salio, P., Nicolini, M. and Zipser, E., 2007. Mesoscale convective systems over southeastern South America and their relationship with the South American Low-Level Jet. Monthly Weather Review, 135, 1290-1309.
- Saulo, C., Ruiz, J. and García Skabar, Y., 2007. Synergism between the Loe-Level Jet and organized convection at its exit region. Monthly Weather Review, 135, 1310-1326.
- Vera, C., Baez, M., Douglas, M., Emmanuel, C. B., Marengo, J., Meitin, J., Nicolini, M., Nogues-Paegle, J., Paegle, J., Penalba, O., Salio, P., Saulo, C., Silva Dias, M. A. and Zipser, E., 2006. The South American Low-Level Jet Experiment (SALLJEX). Bulletin of the American Meteorological Society, 87, 63-77.
- The CLIVAR's VAMOS program developed an experiment, named South American Low-Level Jet Experiment (SALLJEX), to contributed to undestanding the role of SALLJ in moisture and energy exchange between the tropics and extratropics and related aspects of regional hydrology, climate and climate variability. The field campaign was carried out during the warm season between 15 November 2002 and 15 February 2003, over Bolivia, Paraguay, central and northern Argentina, western Brazil and Perú. SALLJEX data set provided us more than 300 study cases.