Chapter VI: Advantages of polar satellite data at high latitudes
6. Advantages of polar satellite data at high latitudes
Addressing the challenges of using satellite data in high-latitude regions requires a strategic combination of different observation methods. By leveraging the high-resolution capabilities of polar-orbiting satellites, the detailed atmospheric profiles from radio soundings, and continuous surface observations from automatic weather stations, meteorologists can significantly enhance the accuracy of weather forecasts and climate monitoring in northern latitudes. In addition to existing methods and observations, investing in advanced data assimilation techniques and enhancing international collaboration can further strengthen these efforts.
The higher the latitude, the more frequently a polar satellite passes over a given region (see Figure 34), so using polar satellite data at high latitudes is extremely important, especially north of 65N, where the spatial resolution of geostationary satellite products is poor. Geostationary data cannot be used north of 70N. Polar-orbiting satellites such as EUMETSAT's MetOp series provide high-resolution data that can capture detailed information about temperature, humidity, and ice cover, which are important for making detailed forecasts in northern regions. These satellites' frequent passes over high-latitude regions ensure that real-time data is continually available, mitigating the limitations of geostationary satellites in these areas.
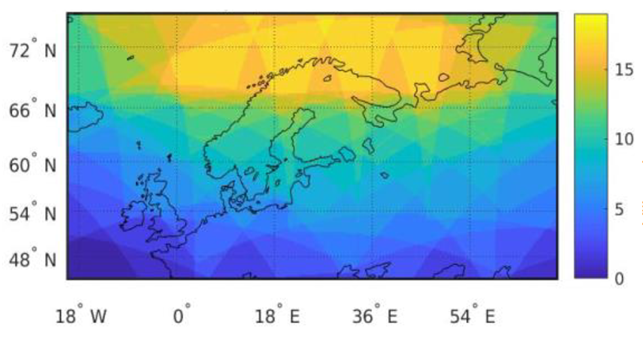
Figure 34: VIIRS (Suomi-NPP/NOAA-20) overlaps coverage within a day. The number of overflights varies regionally and temporally.
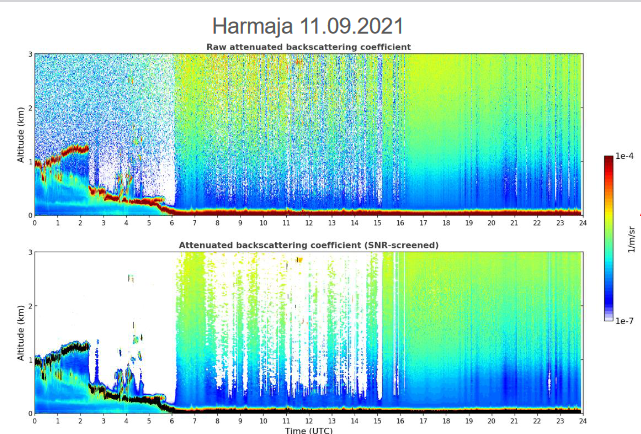
High-latitude regions, such as northern Scandinavia, experience unique meteorological phenomena including polar lows, Arctic fronts, and ice fog. Accurate prediction of these events requires high-resolution data from polar-orbiting satellites and surface observations from both land and ocean areas. Examples of useful observations that can complement satellite data include ceilometer, lidar, radar, and radiosonde data. For effective use of ceilometers, the spatial coverage of these observations should be dense to be able to predict cloud formation and movement.
Exercise 8
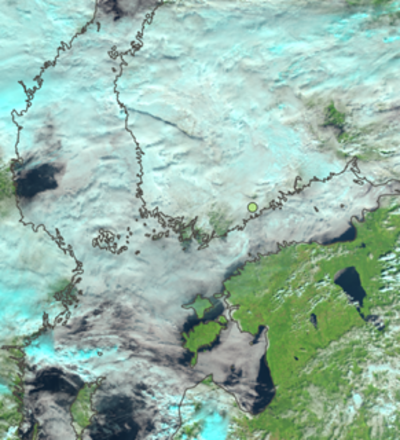
Imagine that you are on shift as an aviation forecaster and Helsinki air traffic control tower calls you for a fog forecast. The airport is marked with a green circle.
How would you assess the fog risk based only on SEVIRI imagery?
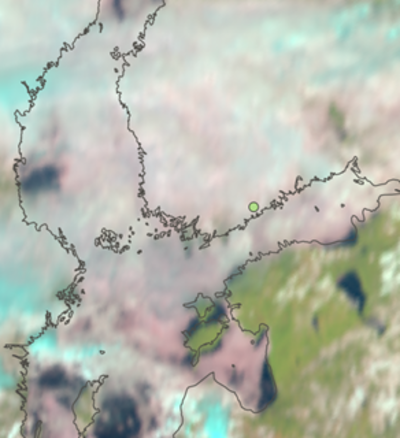
How would you assess the fog risk now, based on the VIIRS image?