Chapter I: Why the Solar Angle Matters: Interpreting Satellite Imagery Accurately
2. Why the Solar Angle Matters: Interpreting Satellite Imagery Accurately
The lack of sunlight during the winter months and at nighttime leads to several limitations when using satellite data, e.g. RGB satellite products using visible channels are not available. These limitations are particularly pronounced in the Nordic countries, where the duration of the darkness at high latitudes is significantly longer than it is in areas closer to the equator.
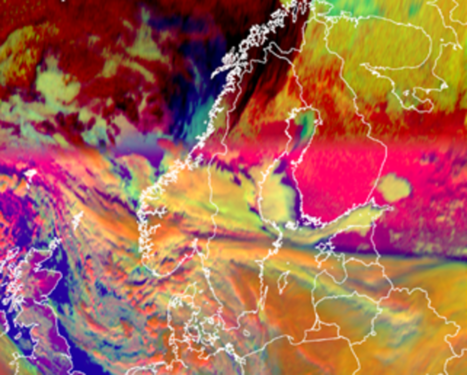
Figure 1 illustrates this issue. It is much more difficult to distinguish between areas with low-level clouds and cloud-free areas in the left image (24-hour Microphysics RGB) than in the right image (Day Microphysics RGB). The yellow/greenish areas in the left image indicate low-level clouds. Unfortunately, the cloud-free areas are very similar in color, which makes interpreting the satellite images more difficult. For large cloud-free areas, e.g., in southwest Lapland (the largest black circle) it is somewhat possible to distinguish between the different color scales, but for the smaller areas it is almost impossible. In the image to the right, which uses visible channels and is therefore only available during daytime, it is much easier to distinguish cloud-free areas from areas with low-level clouds. In this particular case, the meteorologists at shift were fortunate enough to have both satellite images available. However, one can imagine a similar situation in the evening, when no visible channel products are available, and the analysis of cloudiness would be significantly more challenging.
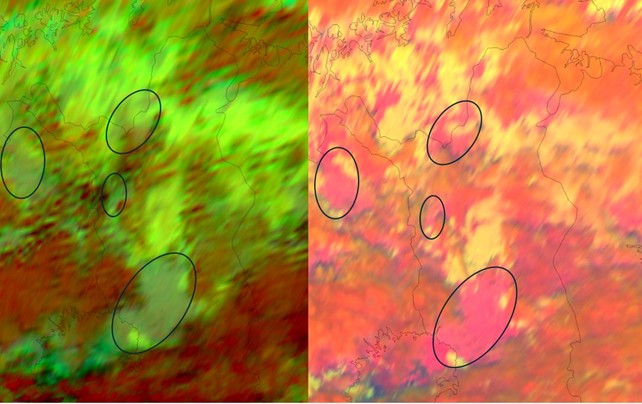
Figure 1: FCI 24h Microphysics RGB (left) and FCI Day Microphysics RGB (right): 14 February 2025, 12:00 UTC over northern Finland. The black circles indicate areas with clear skies.
The solar zenith angle has a significant impact on satellite imagery. As the angle α (Figure 2) between the Sun and the satellite varies, changes in the solar zenith angle result in notable fluctuations in the hues observed in satellite imagery on a daily and a seasonal basis. A small solar zenith angle results in increased atmospheric scattering due to the longer distance the light must travel through the atmosphere, which affects the radiation detected by the sensor.
The angle α of a GEO satellite remains constant over the course of a day, due to the satellite's apparent stationarity over a fixed position. This is a consequence of the satellite's orbital velocity being precisely aligned with the rotation of the Earth. In contrast, the angle of a LEO satellite varies throughout the day, due to its faster orbital speed around the Earth. Therefore, the angle α between the Sun and the GEO satellite will vary between sunrise and sunset, as well as between summer and winter months. These changes will impact the satellite imagery and result in modified colors.
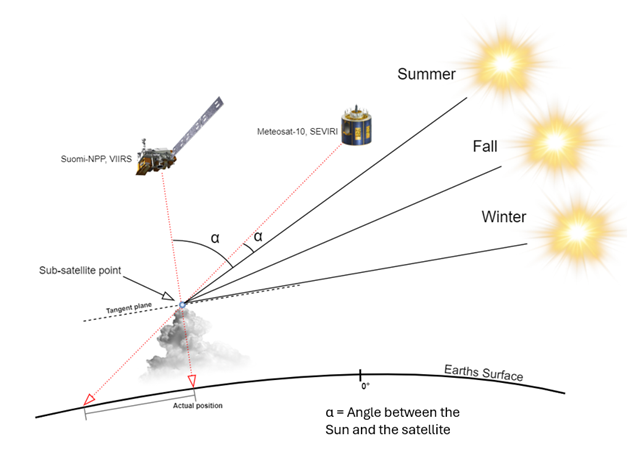
Figure 2: Seasonal changes of the angle between both a GEO (Meteosat-10) and a LEO (Suomi-NPP) satellite and the sun. 2
In high latitude regions, where the Earth tilts away from the Sun at its greatest angle during the winter months, the angle α between the Sun and the satellite becomes a significant factor. This alters the way solar radiation interacts with the atmosphere and the Earth's surface, resulting in modified colors in RGB satellite images. It is notable that these modified colors do not typically align with the colors presented in EUMeTrain Quick guides. It is therefore crucial for operational meteorologists to be aware of this feature when analyzing and interpreting satellite images during the winter months. It is also essential to consider the trade-off between the spatial coverage and resolution of satellite images between LEO and GEO satellites. Many natural phenomena that exhibit high temporal and spatial variability are not fully captured at the frequency and spatial coverage of LEO satellites.
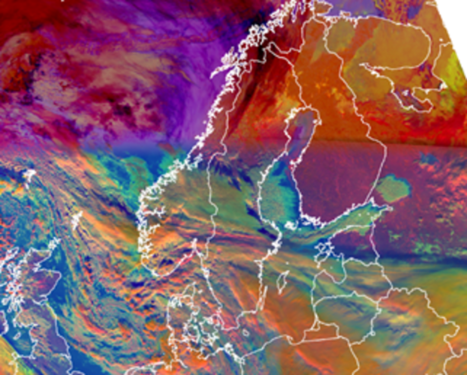
At extremely low solar elevation angles, with a very tilted view, the satellite actually measures the side of the cloud rather than the top of the cloud. As a result, it detects sunlight hitting the edges of higher clouds, making them appear bright as seen in Figure 3, showing the southern part of Finland. This is particularly noticeable at sunrise and sunset and in winter, and can occur frequently in some weather situations. Conversely, the shadow of a cloud is characterized by its dark appearance during sunrise and sunset (see upper part of Figure 3), which can also complicate the interpretation of satellite images.
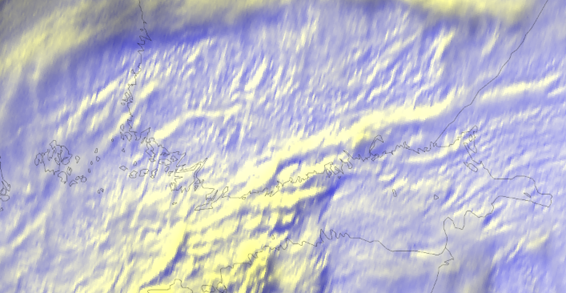
Figure 3: SEVIRI HRV Clouds RGB: 20 November 2024, 07:55 UTC. The satellite imagery illustrates how clouds appear brighter at sunrise as the satellite measures the cloud from the side rather than from above. The bright yellow cloud line extends from the northern part of the Baltic Sea across the southern part of Finland.
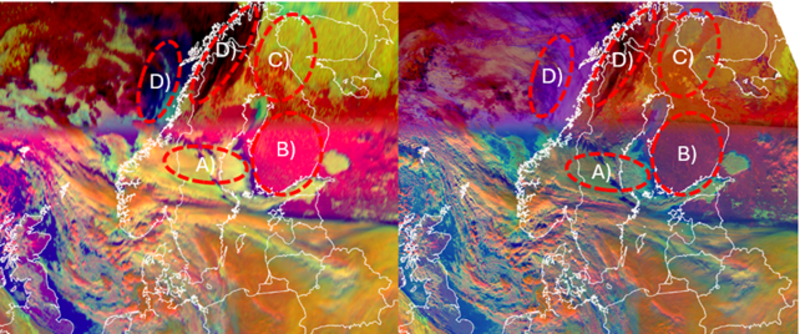
Figures 4 and 5 illustrate the impact of a small solar zenith angle (corresponding to a large angle α between the Sun and the satellite) in October 2024. The colors shown in the Day Microphysics RGB (SEVIRI and FCI, GEO satellite, left image) are not representative of those typically observed during the summer months or at lower latitudes. When the same satellite product is viewed from a polar satellite (VIIRS, LEO satellite, right image), the colors are more discernible. A small solar zenith angle can result in RGB composite showing unexpected hues, with for example blue tones (colors representing cloud-free land and ocean areas) becoming more pronounced and shifting towards purple (thick low-level water clouds) and pink (snow or ice on the ground), which can lead to misinterpretation of snow cover on the ground. Green tones also shift towards yellow, as can be seen in Figures 4 and 5 over northern Norway and the Norwegian Sea. Low to mid-level thick water clouds with small particles should appear green in the Day Microphysics RGB, with yellow colors not included in the EUMeTrain Quick guides. Similarly, the low cloud area with purple hues (thick low-level water clouds with large particles, VIIRS image) over Central and Northern Finnish Lapland appears in a very different color in the SEVIRI and FCI images compared to VIIRS. This is partially due to the VIIRS' channels not being exactly the same as those in FCI and SEVIRI; some FCI and SEVIRI channels are also slightly different 1,2.
Additionally, thick ice clouds with large particles should appear reddish, but the color in LEO satellite images is more orange (northern Sweden/Norway). In the Quick guide, orange is the color for thick ice clouds with small particles on top. This type of color distortion can result in misinterpretation of the data. In addition, some color distortion can be observed towards the edges of an imaging swath, although this phenomenon is less pronounced in VIIRS, where the colors closely match those in the Quick guides. It is noteworthy that in this case the same limitations are still present in the FCI imagery as in SEVIRI, since the increased resolution and other improvements in MTG do not overcome the limitations imposed by the small solar zenith angle.
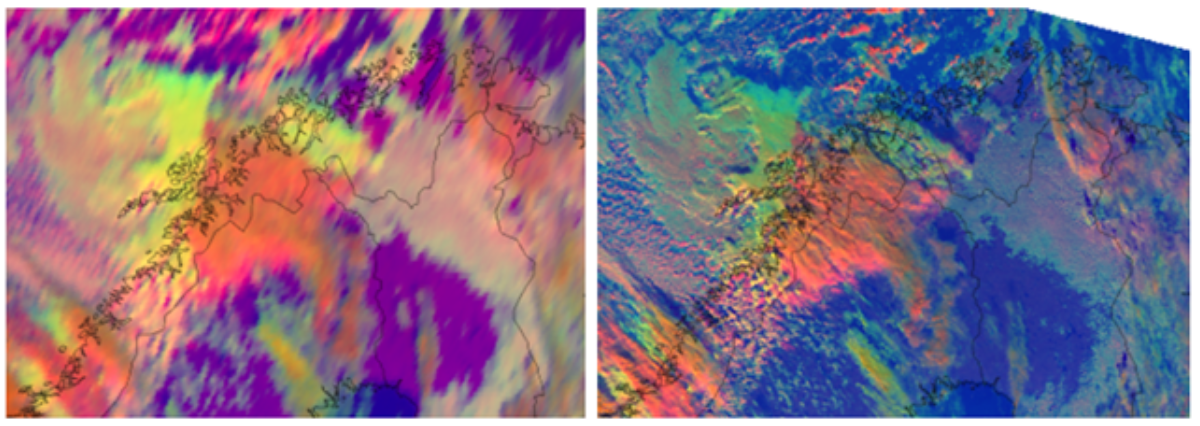
Figure 4: Day Microphysics RGB image from SEVIRI (left) and VIIRS (right) for Northern Europe: 23 October 2024, 10:00 and 10:02 UTC
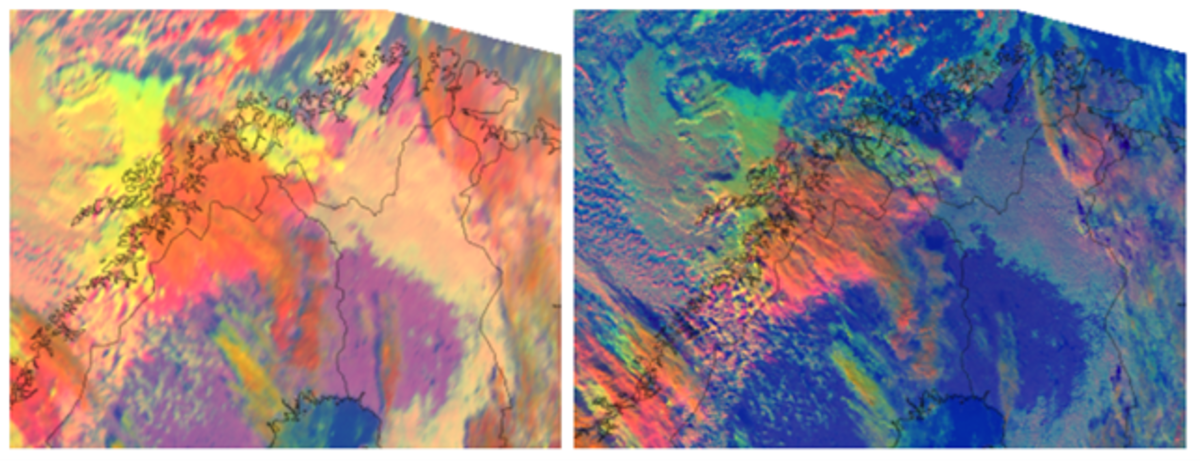
Figure 5: Day Microphysics RGB image from FCI (left) and VIIRS (right) for Northern Europe: 23 October 2024, 10:00 and 10:02 UTC
Exercise 1
Compare the Day and Night Microphysics RGB satellite images of a GEO and a polar satellite. Use the slider and try to notice the areas of difference. See the Quick guides for Day Microphysics RGB and Night Microphysics RGB.
|
|
Day and Night Microphysics RGB image from SEVIRI (left) and VIIRS (right) from Northern Europe 01 January 2024, 11:15 and 11:19 UTC