Conclusion
In the northern part of Hungary (indicated by the red circle in Figure 9), IASI data suggest a more unstable environment than the ECMWF forecast. Profiles at the selected location show that ECMWF forecasted more stable air around 600 hPa than the IASI retrievals Figure 6 ; we can see lower lapse rates around 600 hPa in the ECMWF profile). More cloud occurs in the forecast than is the case in reality (Figure 10 and Figure 11). This missing cloud may have meant higher near-surface temperatures and a stronger/faster destabilization of the atmosphere than expected. These two factors (higher lapse rate and less cloudiness) played a major role in the earlier onset of convection in reality than in the forecast. The first showers actually occurred around 09 UTC (Figure 12).
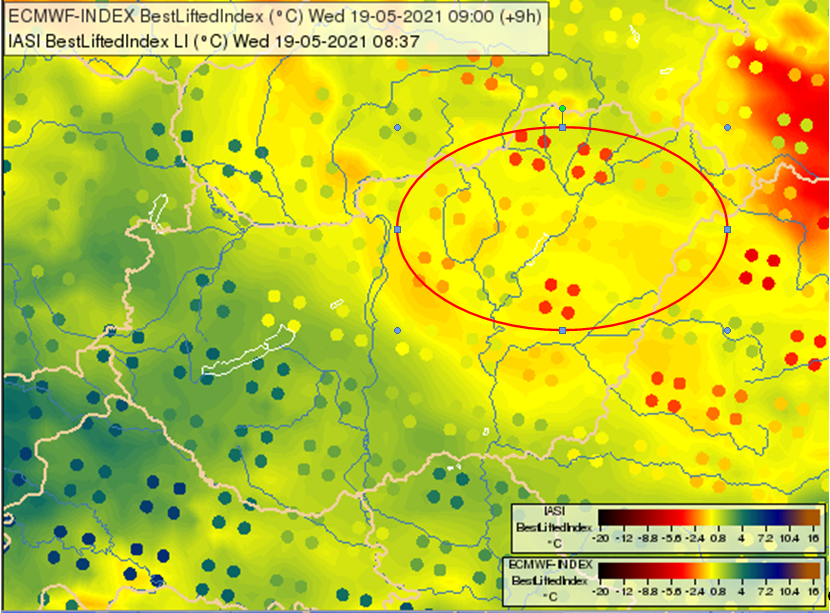
Figure 9: ECMWF forecast of Best Lifted Index, valid for 09 UTC, overlaid by IASI Best lifted index at 08:37 UTC. The red circle indicates the area that is more unstable according to the IASI data.
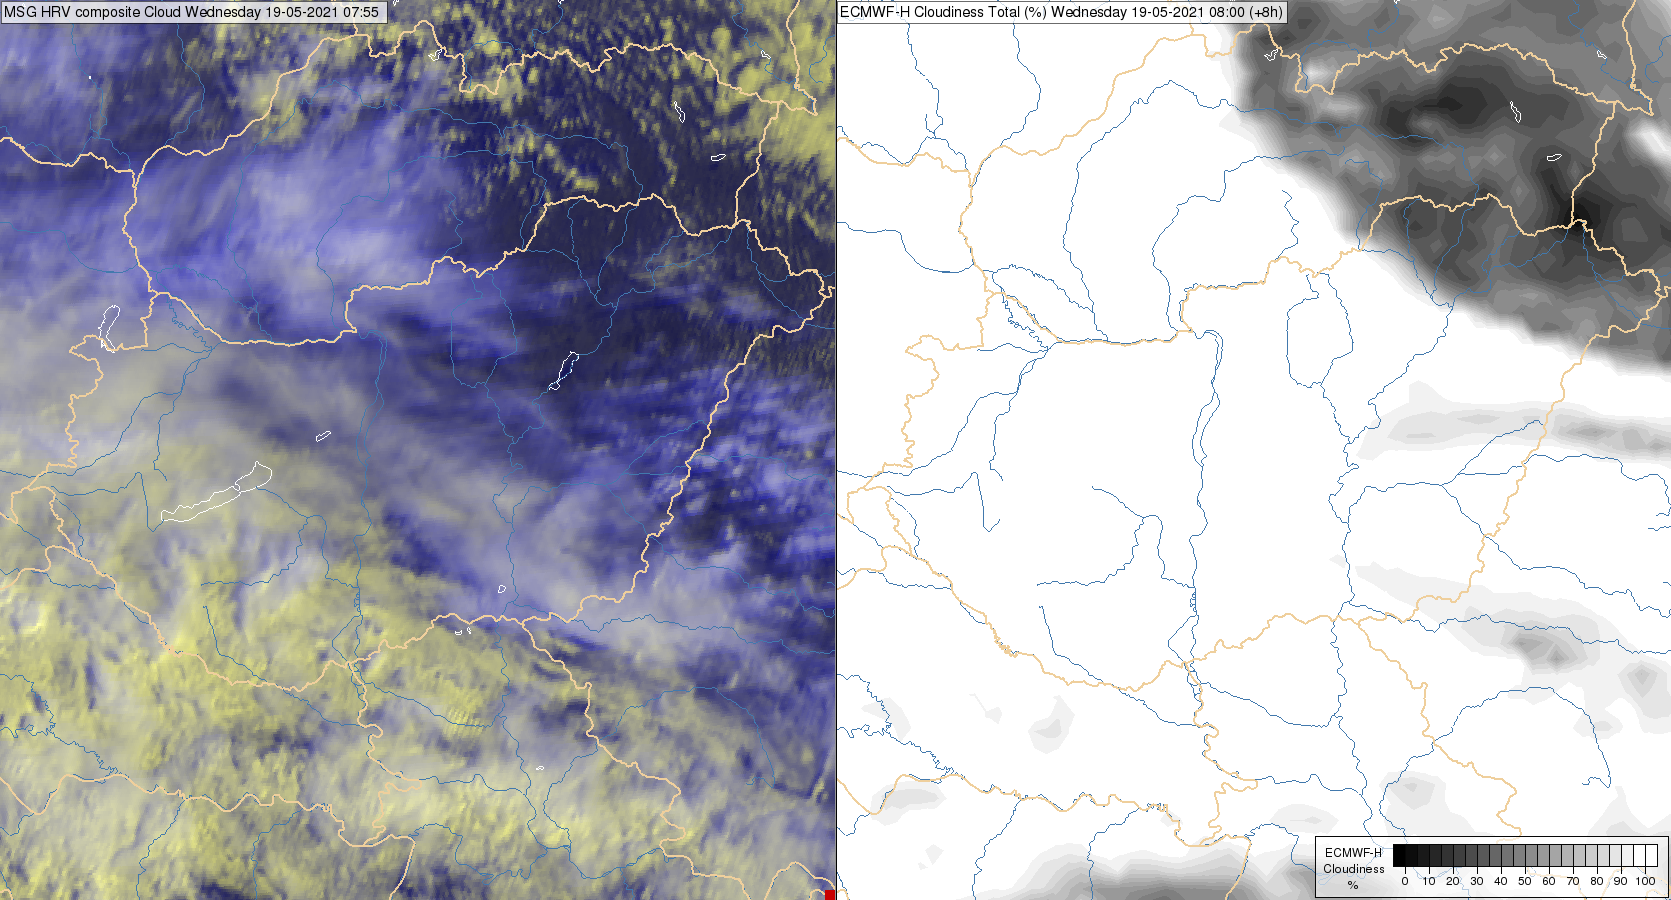
Figure 10: SEVIRI HRV Cloud RGB (left) taken on 19 May 2023 at 07:55 UTC, ECMWF forecast of total cloud amount, valid for 08 UTC.
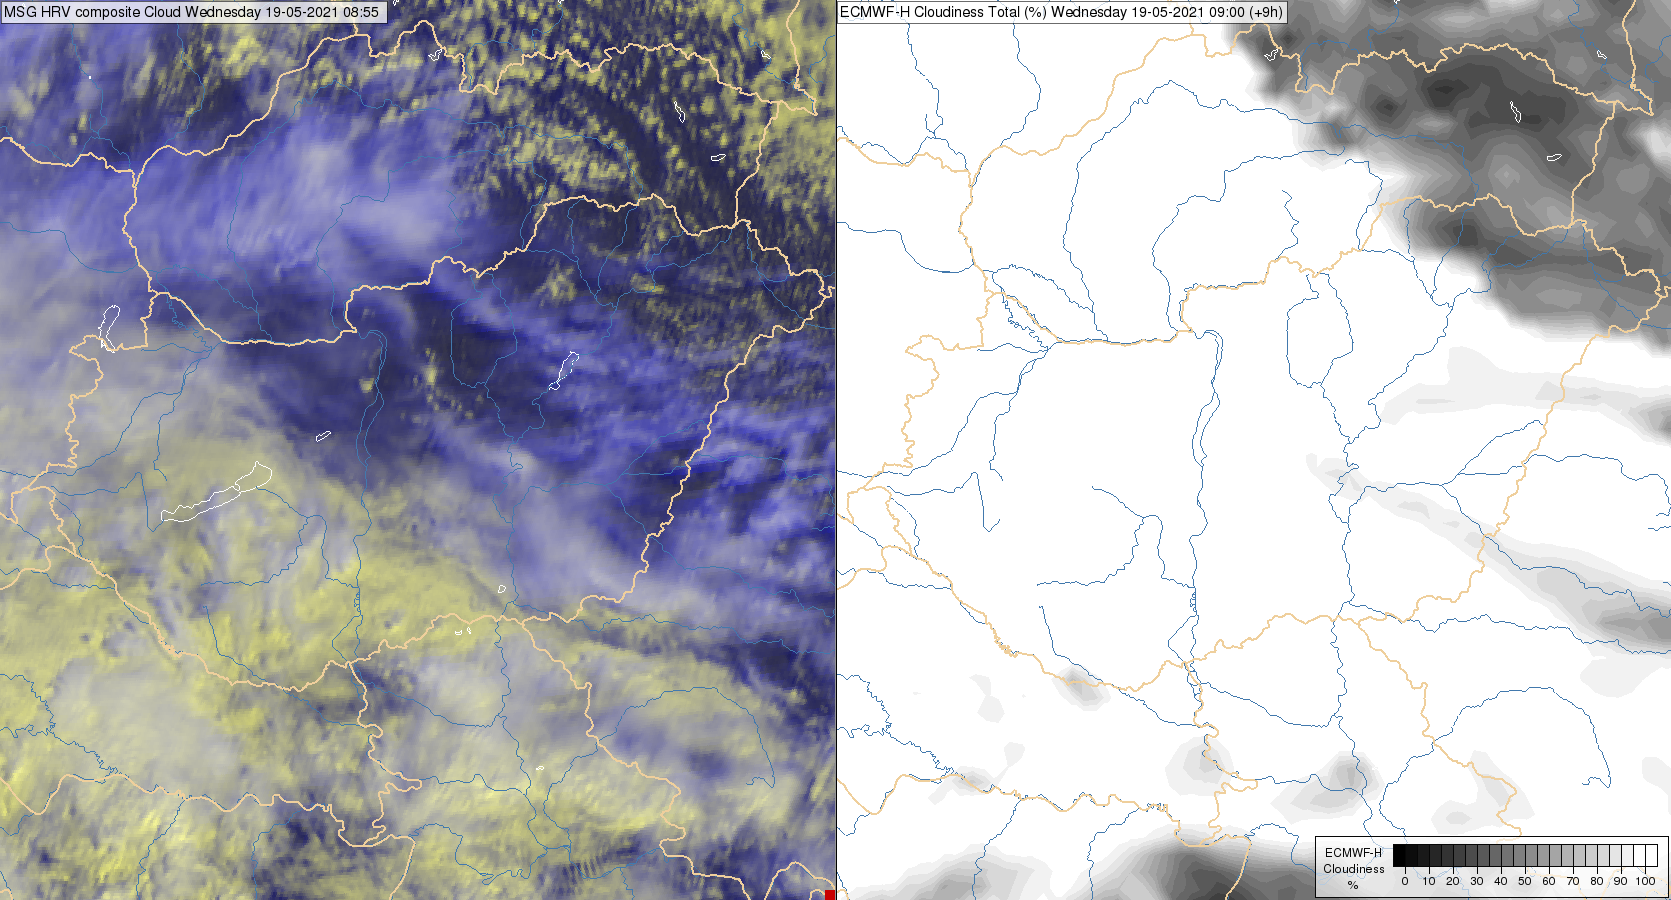
Figure 11: SEVIRI HRV Cloud RGB (left) taken on 19 May 2023 at 08:55 UTC, ECMWF forecast of total cloud amount, valid for 09 UTC.
Figure 12: Radar rain rate animation for 08:10 UTC-13:25 UTC.
In this case, IASI data provide added value to the forecast. They provide information about the vertical structure and instability of the atmosphere at a time when no other measurements providing such information are available. Differences between the model forecast and IASI retrieval data can indicate when and where the model might differ from the real state of the atmosphere, thus giving the forecaster more time to react.