Instability indices
NWP forecast
The following animations show the forecasts of various instability related parameters by the ECMWF IFS model.


Figure 3: ECMWF forecast of Best Lifted Index (upper left), MLCAPE (upper middle), MUCAPE (upper right), 10-m wind (lower left) and CIN (lower right), valid for 08-14 UTC.
TASK 1: Based on the information above, do you expect thunderstorms over Hungary? Please select one of the scenarios.
Hyperspectral data
In the following images you can see indices calculated from hyperspectral IASI retrievals overlaid on the ECWMF forecast. IASI indices are marked with small circles and are calculated in exactly the same way as the NWP indices. You can also see radar and satellite images from the same time as the hyperspectral data.
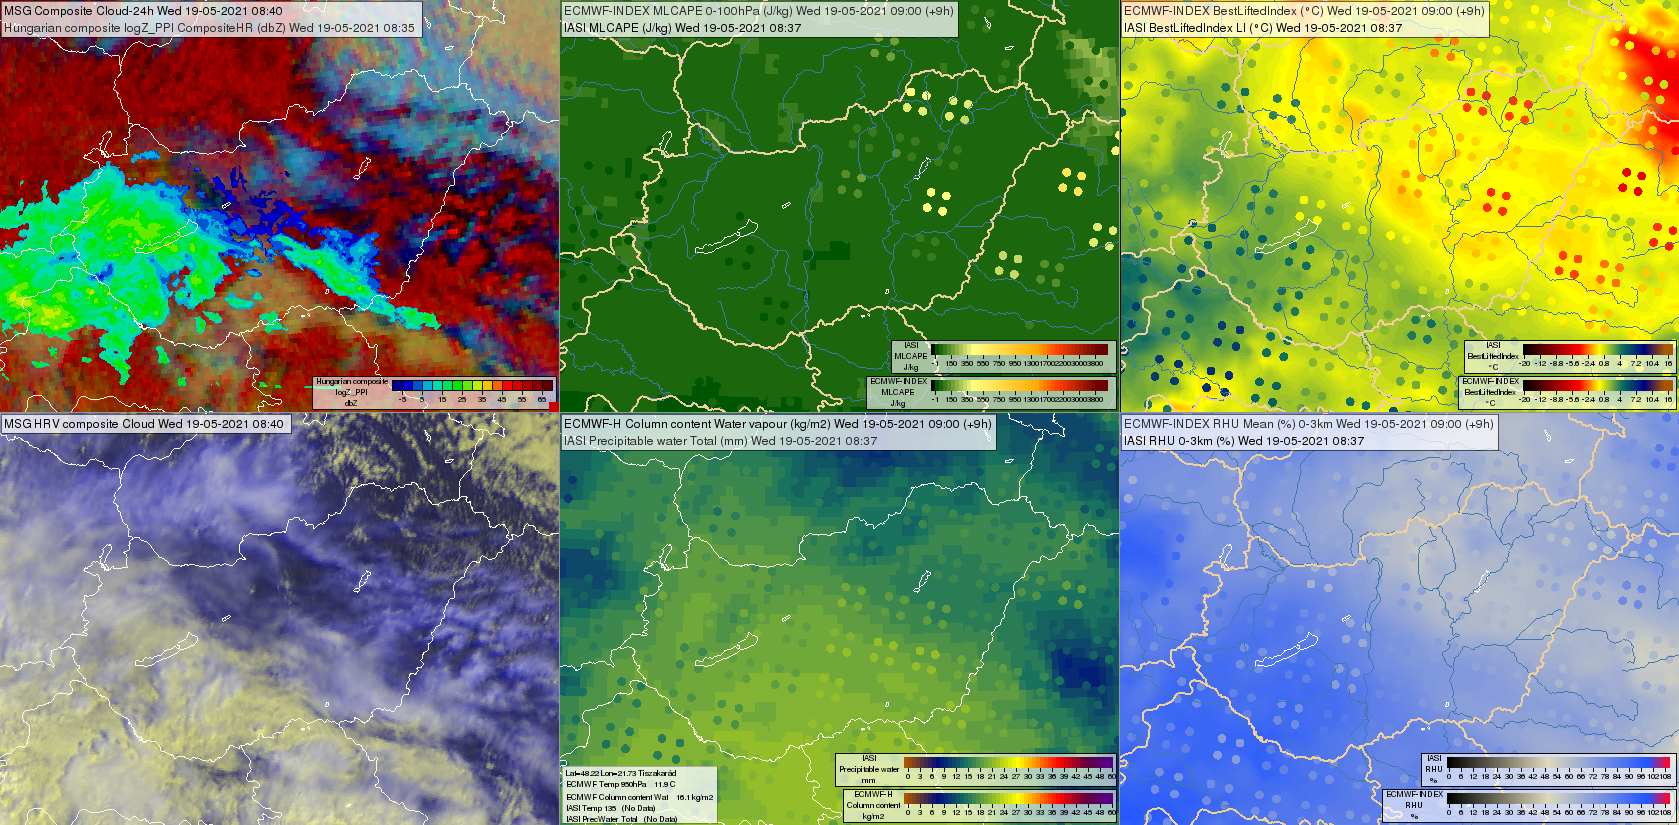
Figure 4: SEVIRI 24-hour Microphysics RGB overlaid by radar (upper left), ECMWF forecast of MLCAPE overlaid by IASI MLCAPE (upper middle panel), ECMWF forecast of Best Lifted Index overlaid by IASI Best Lifted Index (upper right), SEVIRI HRV Cloud RGB (lower left), ECMWF forecast of Total Precipitable Water overlaid by IASI Total Precipitable Water (lower middle panel) and ECMWF forecast Relative Humidity in the 0-3 km layer overlaid by IASI Relative Humidity in the 0-3 km layer (lower right). SEVIRI images taken on 19 May 2023 at 08:40 UTC, IASI data measured at 08:37 UTC and ECMWF forecast valid for 09 UTC.

Figure 5: The arrow indicates the location of the ECMWF and IASI profiles in Figure 6.
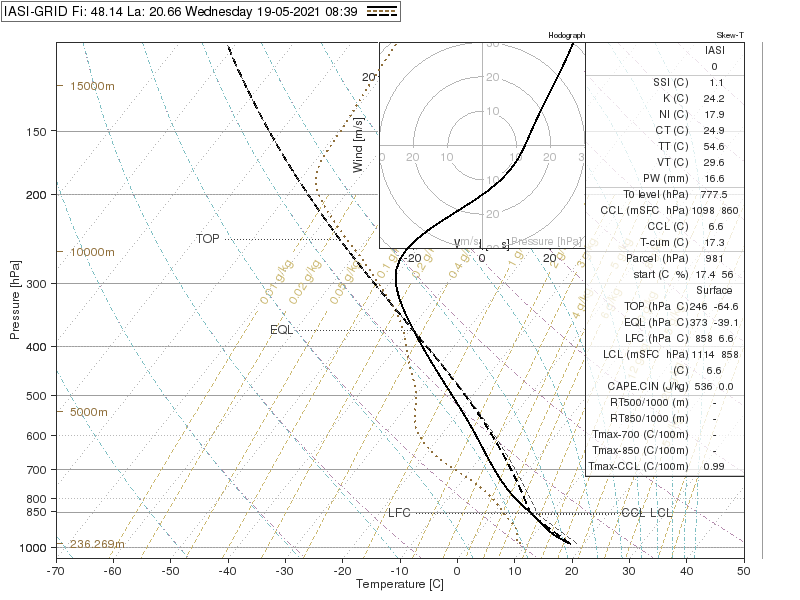
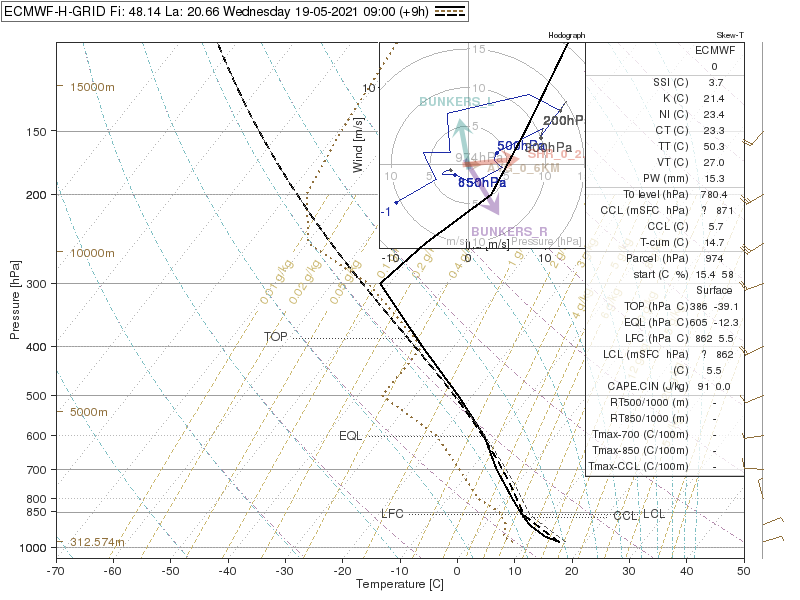
Figure 6: IASI profile at 08:39 UTC (left) and ECMWF vertical profile valid for 09 UTC (right), both on 19 May 2023. (Location of the profiles is indicated in Figure 5.)
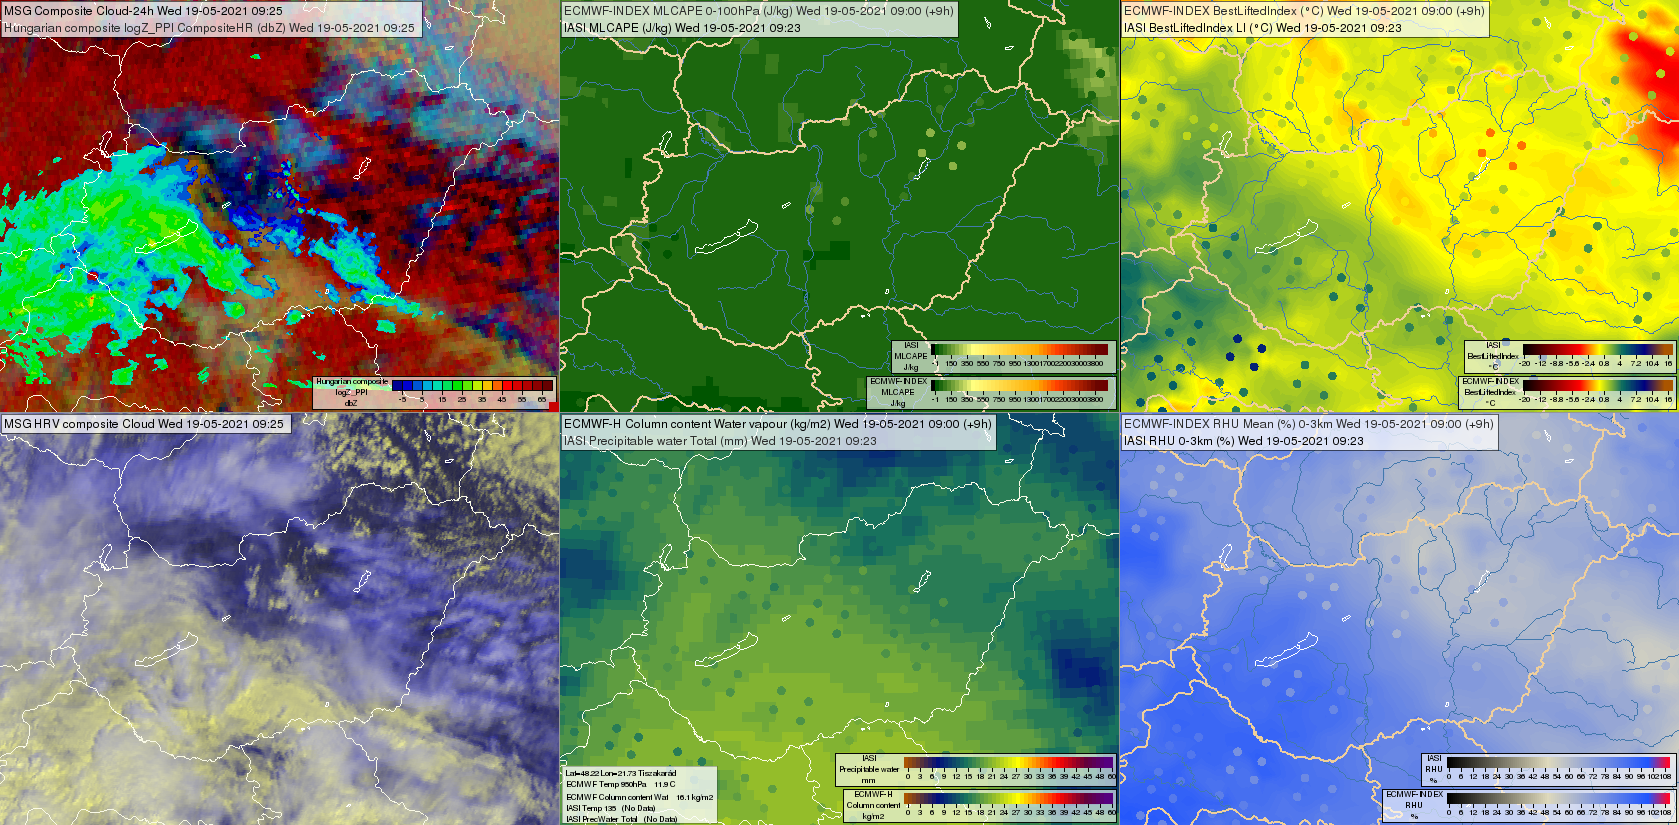
Figure 7: SEVIRI 24-hour Microphysics RGB overlaid by radar (upper left), ECMWF forecast of MLCAPE overlaid by IASI MLCAPE (upper middle panel), ECMWF forecast of Best Lifted Index overlaid by IASI Best Lifted Index (upper right), SEVIRI HRV Cloud RGB (lower left), ECMWF forecast of Total Precipitable Water overlaid by IASI Total Precipitable Water (lower middle panel), ECMWF forecast of Relative Humidity in the 0-3 km layer overlaid by IASI Relative Humidity in the 0-3 km layer (lower right). SEVIRI images taken on 19 May 2023 at 09:25 UTC, IASI data measured at 09:23 UTC and ECMWF forecast valid for 09 UTC.
TASK 2: After looking at the IASI fields, which scenario do you think is most likely to happen?