Areas of application
This chapter lists the main areas of application of the Cloud Phase RGB, together with some examples.
The applicability of an RGB type depends on its main characteristics: which cloud, atmospheric and surface features are identifiable/detectable and how well these features can be distinguished from each other. In practice the structure, movement and colours help us to identify the cloud, atmospheric or surface feature. In this guide the focus is on the colours.
Overall cloud analysis
The Cloud Phase RGB is suitable for cloud analysis at both smaller and synoptic scales. The colour contrast is good between cloudy and cloud-free areas, between thick water and ice clouds and between cloud tops covered by small and large particles. Figure 7.1 shows an example of these colour contrasts. Land appears in brownish shades (depending mainly on the green vegetation amount) and ocean, sea, lake, river usually appear black. Thick water clouds appear pale yellow, pink or magenta depending on the cloud top droplet size. Thick ice clouds appear medium blue if they are covered by large ice crystals, and light blue or cyan if they are covered by small ice crystals. Thin ice clouds appear as a transparent greenish veil. Note that the presence of small particles at the top of a convective cloud can be an indicator of its severity: in this case the convective system over Central Italy caused severe weather at the surface, and a tornado was even reported.
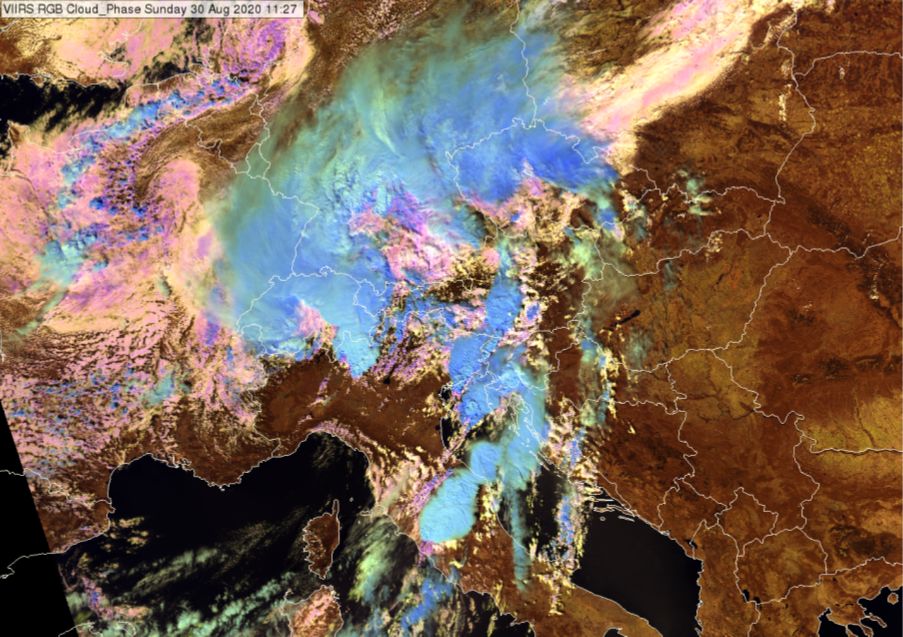
Fig. 7.1: VIIRS Cloud Phase RGB taken on 30 August 2020 at 11:27 UTC.
Monitoring developing convective clouds
During the developing phase, one can easily use the Cloud Phase RGB to follow the glaciation at the tops of towering cumulus clouds. Glaciated cumulus clouds appear blue, while cumulus clouds covered by water droplets appear yellowish, pink or magenta, depending on the mean droplet size at their tops.
Fig. 7.2 shows developing convective clouds. In this Cloud Phase RGB image multiple isolated convective cells are seen. Those cumulus clouds that are still water clouds appear yellowish or pinkish; when the glaciation takes place, they turn blue.
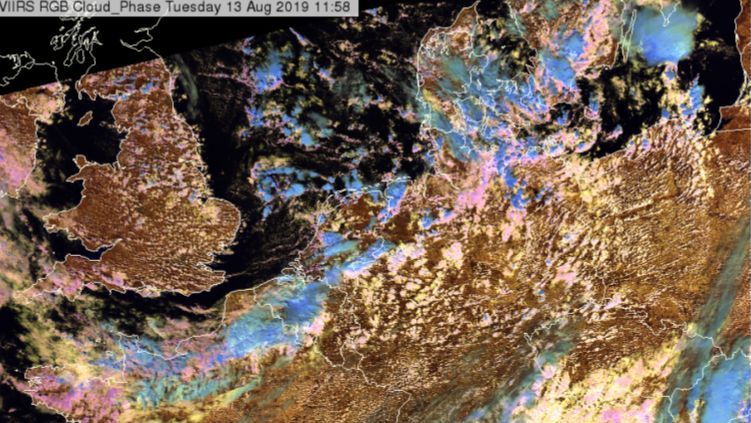
Fig. 7.2: Growing convective cells in a VIIRS Cloud Phase RGB image taken on 13 August 2019 at 11:58 UTC.
Figs 7.3 shows mature convective clouds with outflow boundaries. The mature convective cloud systems appear in blue shades while the new convective cells forming along the outflow boundaries first appear yellowish and pinkish (being initially water clouds) and later some of them turn blue (glaciating at the top).
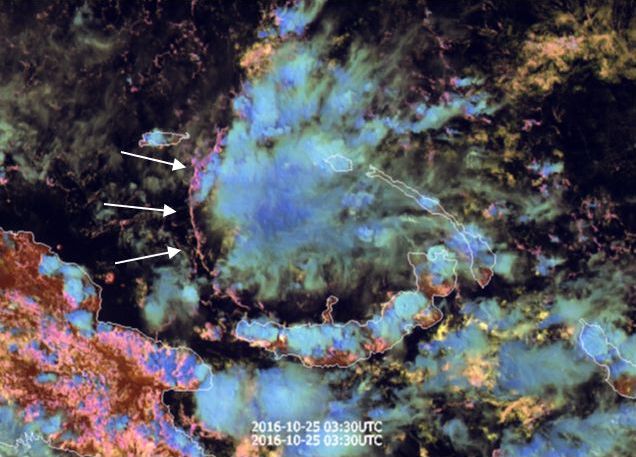
Fig. 7.3: Convective storm with outflow boundary over the Bismarck Sea at the coast of Papua New Guinea on a Himawari/AHI Cloud Phase RGB image, 25 October 2016, 03:30 UTC.
Click here to see a 10-minute animation of the period 02:00–04:00 UTC on 25 October 2016.
Monitoring mature convective clouds
The main product used to monitor mature convection is the VIS+IR Sandwich product, which can be complemented by the Cloud Phase RGB. The cloud top microphysics information that it provides can serve as an indicator of the possible severity of the convective cloud.
In most cases thick ice clouds are covered by large ice crystals (appearing medium blue in the Cloud Phase RGB). However, there are some exceptions when the cloud top ice crystals are small, and one of these is severe convection with strong updrafts. At mid-latitudes, the continental convective clouds with very strong updrafts typically have small ice crystals at or above their tops (appearing light blue or cyan in Cloud Phase RGB). The reason is that, due to the strong updraft, the small droplets formed at the cloud base do not have much time to grow by coagulation before freezing.
However, one has to take into account that not all convective clouds covered by small ice crystals are severe storms: small ice crystals do not only form due to intense updrafts. They can also be observed on the tops of storms with a cold (high) cloud base, in high-level lee clouds and on the tops of highly polluted thick ice clouds.
In Fig. 7.4a a convective systemis seen over central Italy. The thunderstorm appears light blue and cyan, so it is covered mainly by small ice crystals.
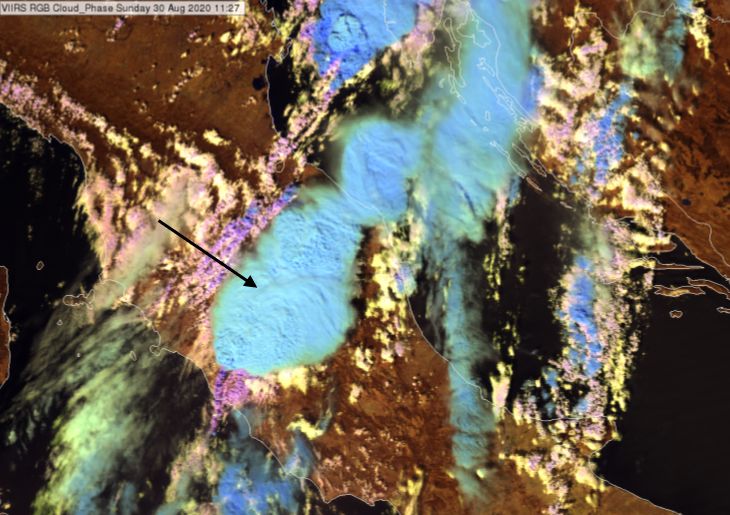
Fig. 7.4a: Mature convective cloud systems over Italy and the Adriatic Sea in a VIIRS Cloud Phase RGB taken on 30 August 2020 at 11:27 UTC.
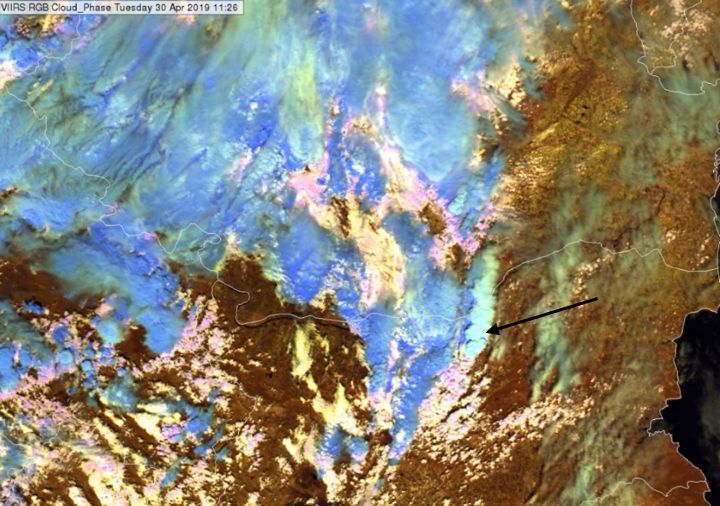
Fig. 7.4b: VIIRS Cloud Phase RGB taken on 30 April 2019 at 11:26 UTC.
In Fig. 7.4b the thunderstorm indicated by the arrow appears cyan. This thunderstorm was very severe, causing large hail in Romania. A further example of mature convective clouds is shown in Fig. 4.2.
Monitoring fog and low clouds
As thick water clouds are well separated from both cloud-free areas and ice clouds, the Cloud Phase RGB is a good tool for low water cloud (or fog) detection. Note that one cannot separate fog from low water clouds based only on the colours, but other data and investigation of the cloud structure and movement can help to do this.
Fig. 7.5 shows fog and/or water clouds. The left panel shows low-level wave clouds over the area around Denmark. The right panel shows the Black and Caspian Sea region, with fog in yellow and pink colours, see the arrows.
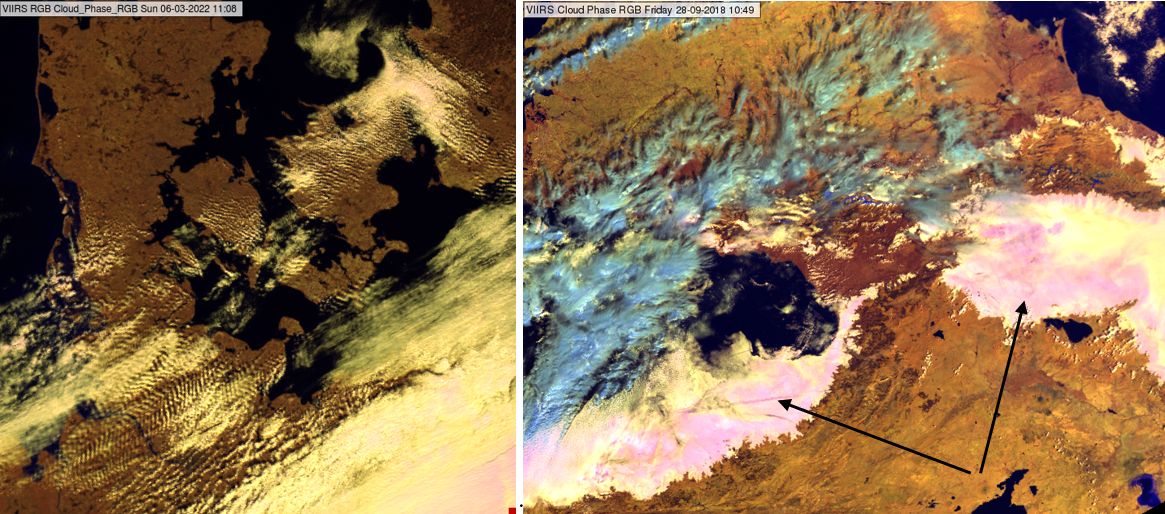
Fig. 7.5: VIIRS Cloud Phase RGB images taken on 06 March 2022 at 11:08 UTC (left) and 28 September 2018 at 10:49 UTC (right).
Fog and water clouds also have good colour contrast against snow, which is important for detecting fog and stratus over snowy areas (see Fig. 7.6).
Monitoring snow-covered land
Cloud-free snow-covered areas are usually easy to identify. They appear in blue shades, usually dark blue, a darker blue than ice clouds. Fig. 7.6 shows the snow-covered Alps, with the areas north and northeast of the Alps also partly covered by snow. The snow appears somewhat brighter over the high mountains where it is likely deeper, colder (with smaller ice crystals), more continuous and less affected by vegetation. Land is brown and water bodies are black. Snow has good colour contrast against water clouds, which is important for being able to see the fog and stratus over snowy areas.
Ice clouds have similar colours to snow in several RGBs. In the Cloud Phase RGB both appear in blue tones, but usually in rather different shades, so it is less difficult to separate snow from ice clouds. In Fig. 7.6 ice clouds are indicated by arrows.
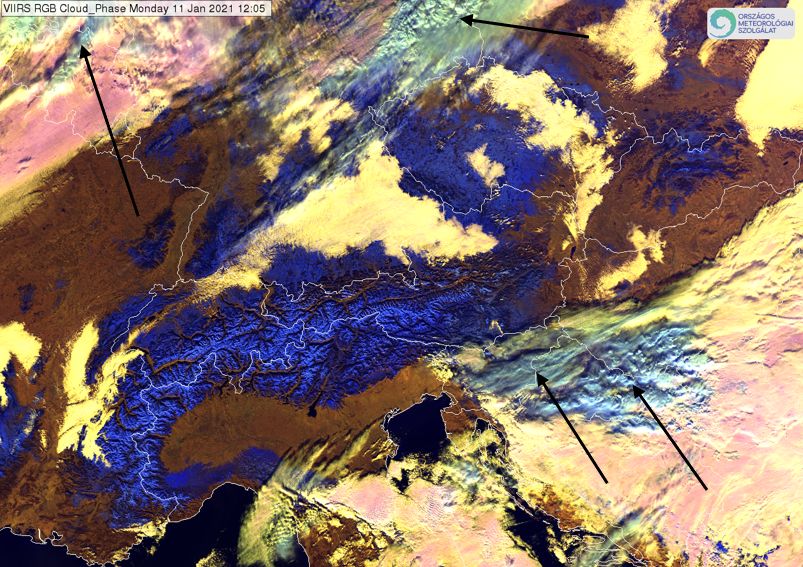
Fig. 7.6: VIIRS Cloud Phase RGB taken on 11 January 2021 at 12:05 UTC. Ice clouds are indicated by arrows.
The Cloud Phase RGB also contains information about the snow grain size. If the snow is unbroken and not melting, the fresh snow, consisting of small grains, appears somewhat lighter blue than (older) snow consisting of larger grains. You can read a case study about this effect on the EUMeTrain webpage.
Monitoring aerosol-cloud interaction
The Cloud Phase RGB is not designed for aerosol monitoring. Only sufficiently dense aerosol plumes with larger particles can be detected, mainly over dark backgrounds such as ocean. (An example of dust cloud detection is shown in Fig. 7.7b, and of smoke detection in Fig. 6.6.)
However, the Cloud Phase RGB is a good tool for monitoring aerosol-cloud interaction. When a large amount of aerosol is injected into a cloud, the effective particle size decreases due to the increased number of condensation nuclei. The following features in the Cloud Phase RGB enable observation of aerosol-cloud interactions:
- Ship tracks over oceans and seas - moving ships inject smoke into the maritime low clouds, so their droplets become smaller, and the tracks become visible due to the higher reflectivity.
- Industrial plumes - Industrial chimneys emit smoke into fog or stratus. The wind may advect the stratus cloud, causing elongated cloud features containing smaller droplets.
- Ice clouds highly polluted by dust - strong winds can pick up large amounts of dust from deserts and inject it into a cloud system, changing its microphysical structure.
- Pyro Cb - Cumulonimbus triggered by intense fire, strongly polluted by smoke.
A case study about ship tracks and industrial plumes is available on the EUMETSAT webpage. In Fig 7.7a the arrow indicates an industrial plume over Belarus. It originates from a large industrial city. Pink colours indicate stratus with larger droplets, while pale yellow indicates stratus with smaller droplets.
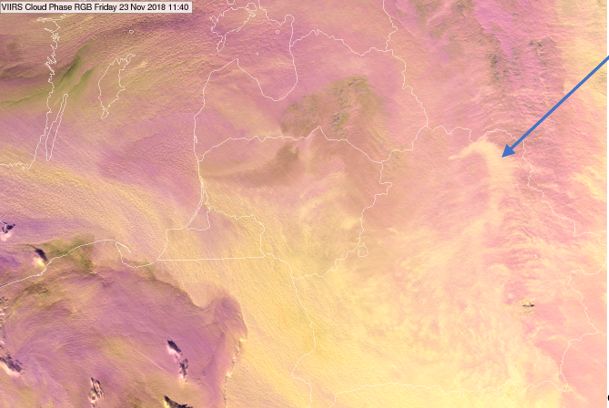
Fig. 7.7a: Industrial plume in a VIIRS Cloud Phase RGB, 23 November 2018, 11:40 UTC.
In the left panel of Fig 7.7b one can see a very dense dust cloud in yellowish brown colours (indicated by the white arrow). The right panel image was taken on the following day. The ice clouds polluted by dust particles (black arrows) appear yellowish green, because they are covered by extremely small ice crystals due to the increased number of condensation nuclei.
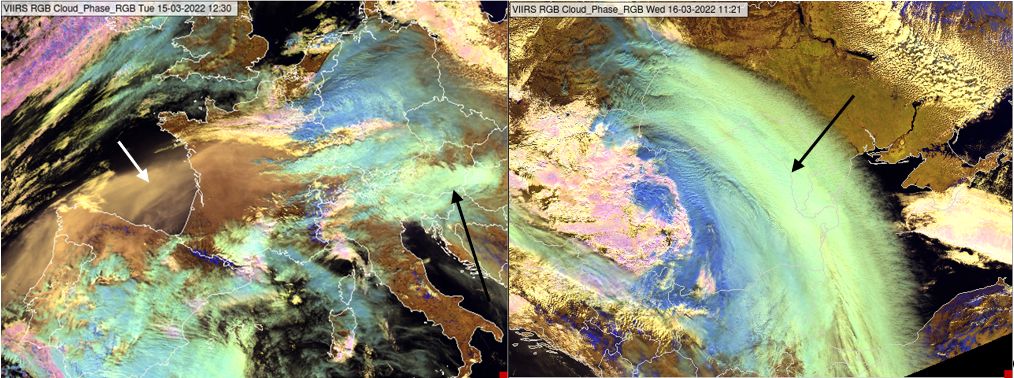
Fig. 7.7b: Cloud Phase RGBs taken on 15 March 2022 at 12:30 UTC (left) and 16 March 2022 11:21 UTC (right).