Comparison with similar products and RGBs
In Fig. 6.1 the Cloud Phase RGB and the NWCSAF Cloud Effective Radius product are compared. Note that only the effective radius values of thick ice clouds are visualised. The Cloud Effective Radius product confirms that the cyan clouds in the Cloud Phase RGB are really covered by much smaller ice crystals than the medium blue clouds.
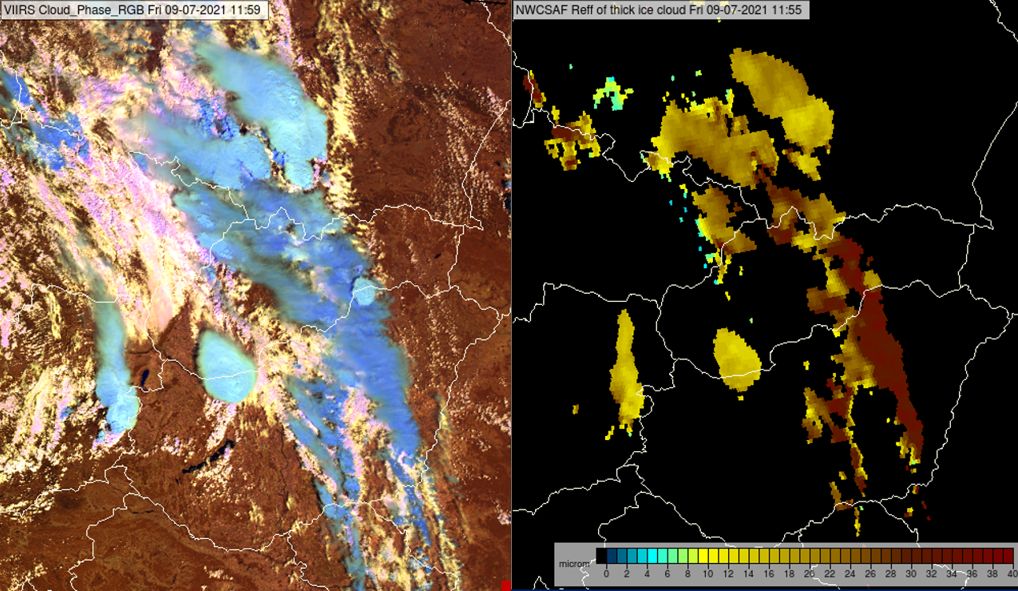
Fig. 6.1: VIIRS Cloud Phase RGB (left) and NWCSAF Cloud Effected Radius product (right), 9 July 2021, 11:59 UTC. On the right panel only the effective radius values of thick ice clouds are visualised.
In this chapter the main characteristics of the Cloud Phase RGB are compared with those of other RGB types for different applications.
Monitoring convection
The Sandwich product is the base product to use for monitoring mature convection. The Cloud Phase RGB complements the Sandwich product, as it shows the cloud top microphysics (which is not seen in the Sandwich product).
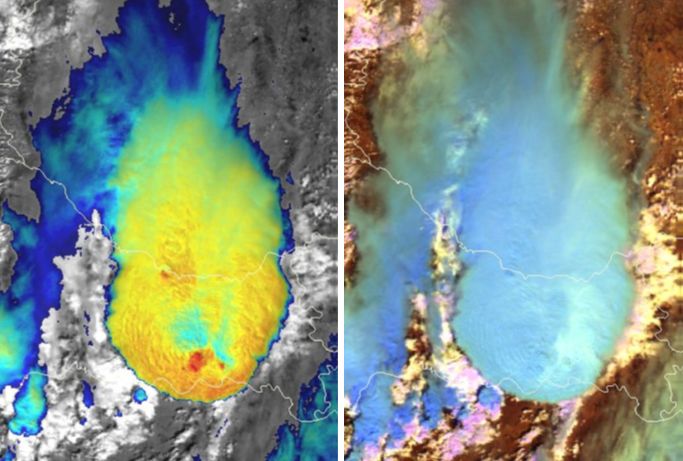
Fig. 6.2: Mature severe storm system in VIIRS Sandwich product (left) and VIIRS Cloud Phase RGB (right) images taken on 04 August 2020 at 12:05 UTC over Croatia and Hungary.
Fig. 6.2 shows a mature severe storm in VIIRS Sandwich product and Cloud Phase RGB images. Severe weather (severe wind, large hail, heavy rain) was reported from Croatia and Hungary along the track of this thunderstorm.
The Sandwich product image shows the cloud top orography and temperature distribution, while the Cloud Phase RGB shows cloud top microphysics information.
- In the Sandwich product we see a Cold-U signature, gravity waves and two strong overshooting tops in the southern part of the storm. On the downwind parts of the overshooting tops, warm spots are present. One of them is elongated in the downwind direction. This might represent an above-anvil ice plume.
- In the Cloud Phase RGB one can see that the cloud top is covered mainly by small ice crystals, which appear in pale blue colours. On the south east part of the anvil the particles seem to be even smaller. This pale cyan area has a complex structure; the small ice crystals seem to originate from the area of the overshooting tops. It elongates from there mainly in the downwind direction. We may see an above-anvil plume (or more smaller plumes), which consists of extremely small ice crystals.
In Fig. 6.3 the Cloud Phase RGB is compared to the Day Microphysics RGB. Both RGBs show cloud top microphysics information. The example shows deep convective clouds with outflow boundaries over the Philippine Sea in the Pacific Ocean. The water clouds along the outflow boundary consist of large droplets, as cloud drops over pristine ocean are typically large. In the Cloud Phase RGB ice clouds appear bluish or greenish (thick and thin ice clouds), while water clouds with large droplets appear pink or magenta. In the Day Microphysics RGB ice clouds appear red, while water clouds with large droplets appear pink. In the Cloud Phase RGB the colour contrast between thick ice and water clouds is much higher than in the Day Microphysics RGB.
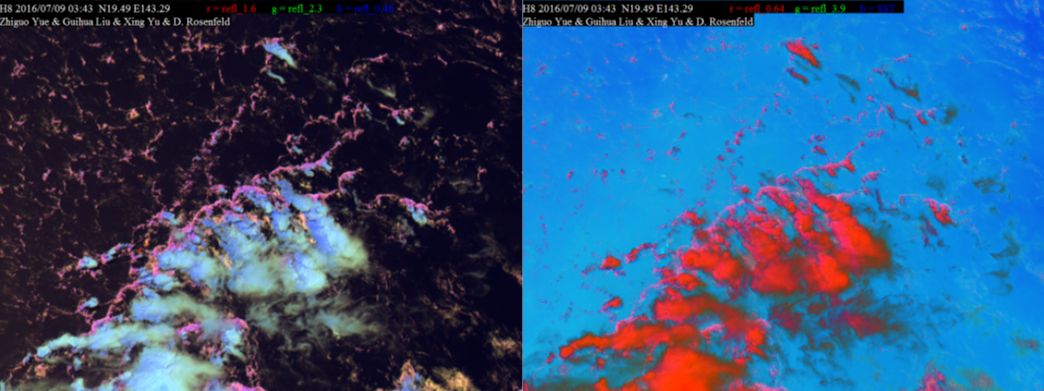
Fig. 6.3: Convective clouds with outflow boundaries in Himawari/AHI Cloud Phase and Day Microphysics RGB (with IR3.85) images taken on 09 July 2016 at 03:43 UTC over the Philippine Sea. (Credit to Daniel Rosenfeld, Hebrew University of Jerusalem, Israel.)
The Cloud Phase and Cloud Type RGBs will both be new with FCI data. They provide different information and complement each other.
- The Cloud Phase RGB provides good cloud top microphysics information. However, (very) thin high-level ice clouds are not well detected.
- The Cloud Type RGB is very sensitive to high-level very thin ice clouds (over both land and water). Note that the Cloud Type RGB also provides cloud top microphysics information (by using the NIR1.6 channel), but it visualises mainly cloud phase information rather than cloud top particle size information.
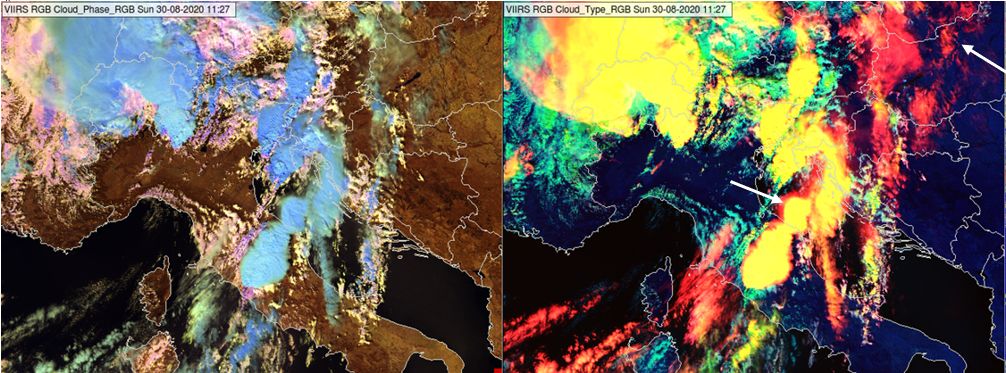
Fig. 6.4a: VIIRS Cloud Phase and Cloud Type RGBs from 30 August 2020, 11:27 UTC.
In Fig. 6.4a thick ice clouds in the Cloud Phase RGB appear in several blue shades indicating different ice crystal sizes at the tops of ice clouds. These differences are not seen in the Cloud Type RGB. However, the high-level thin ice clouds are much better seen in the Cloud Type RGB: both the thin parts of the anvils and the thin cirrus clouds, see the areas indicated by arrows.
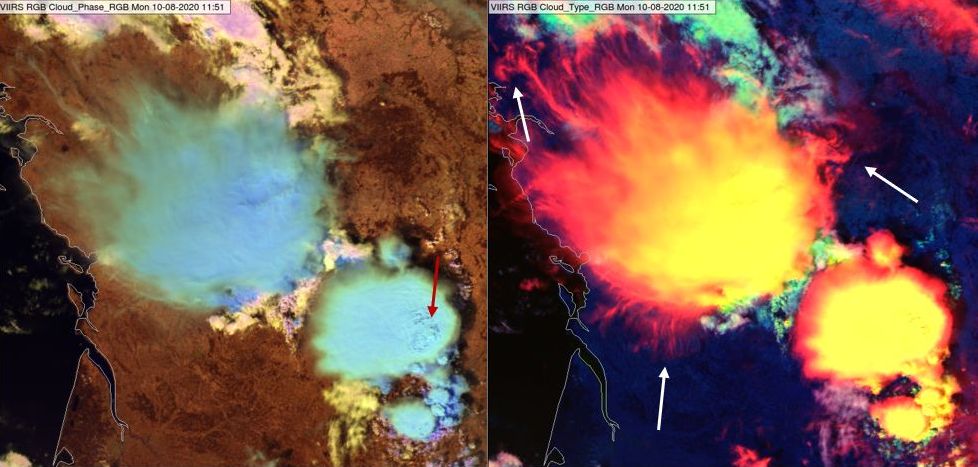
Fig. 6.4b: VIIRS Cloud Phase and Cloud Type RGBs from 30 August 2020, 11:27 UTC.
In the Cloud Phase RGB in Fig. 6.4b one can see the overshooting tops (indicated by a red arrow), which are (almost) not seen in the Cloud Type RGB. However, the details of the thin anvil edge (indicated by white arrows) are better seen in the Cloud Type RGB.
Detection of very thin cirrus clouds
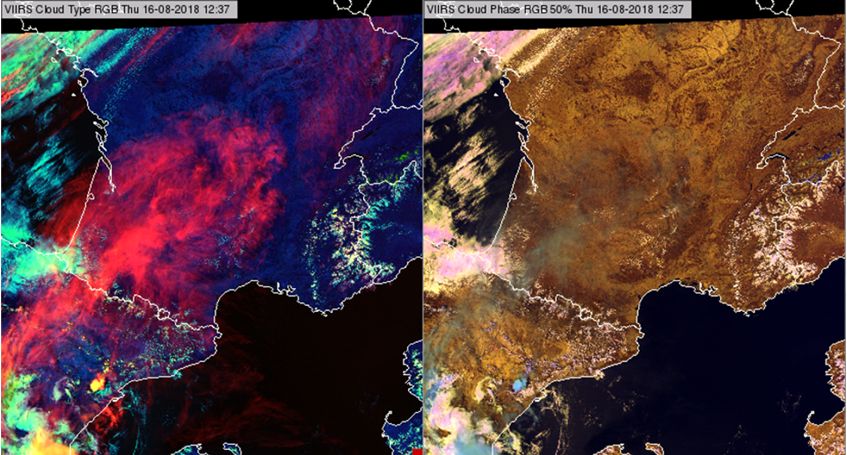
Fig. 6.5: VIIRS Cloud Type and Cloud Phase RGBs from 16 August 2018, 11:37 UTC
While the Cloud Type RGB is very sensitive to high-level very thin cirrus clouds, these can hardly be seen in the Cloud Phase RGB (Fig. 6.5). Deciding which RGB to use depends on the purpose. For example, surface features and lower small cumulus clouds are depicted rather well in the Cloud Phase RGB, even under thin cirrus layers.
Fires, burnt areas and smoke
Fig 6.6 shows California fires in three RGB types: Fire Temperature, Cloud Phase and Natural Colour RGBs. The Fire Temperature RGB is the basic RGB for fire detection. Fires are also eye-catching in the Cloud Phase RGB, but the Fire Temperature RGB detects larger areas of fires than the Cloud Phase RGB (the Cloud Phase RGB uses the fire-sensitive NIR1.6 and NIR2.25 channels, while the Fire Temperature RGB uses the IR3.7 channel as well as these two; the IR3.7 channel is very sensitive to fires, while the NIR2.25 and NIR1.6 channels can see only larger, warmer, more intense fires). Only the hottest fires (with large extents) can be seen in the Natural Colours RGB.
Burnt areas can be seen in all three RGBs, and best in the Natural Colours RGB. Smoke is seen most clearly in the Natural Colour RGB and least clearly in the Fire Temperature RGB (due to the small particle sizes of smoke, relative to the channel wavelengths).
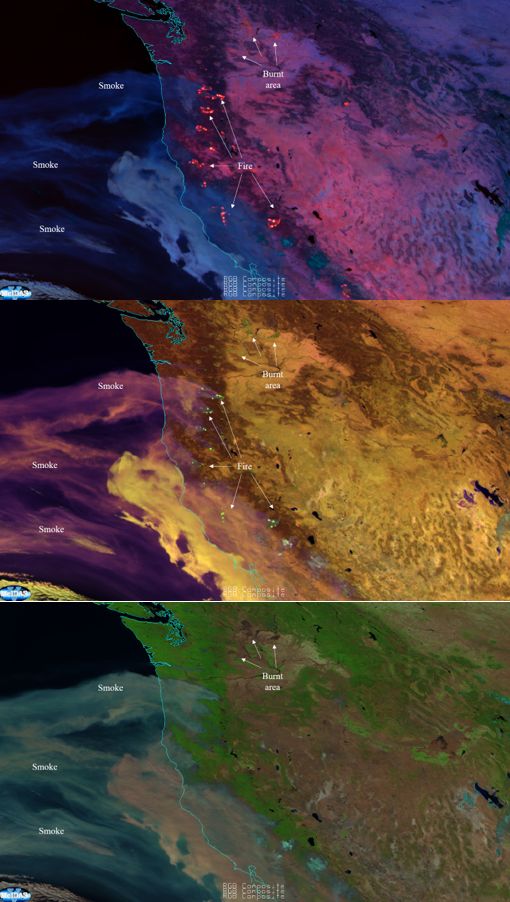
Fig. 6.6: Fires in California in Fire Temperature, Cloud Phase and Natural Colour RGBs, GOES16/ABI, 09 September 2020, 21 UTC.