Extratropical cyclone
Extratropical transition from hurricane Ophelia to extratropical depression
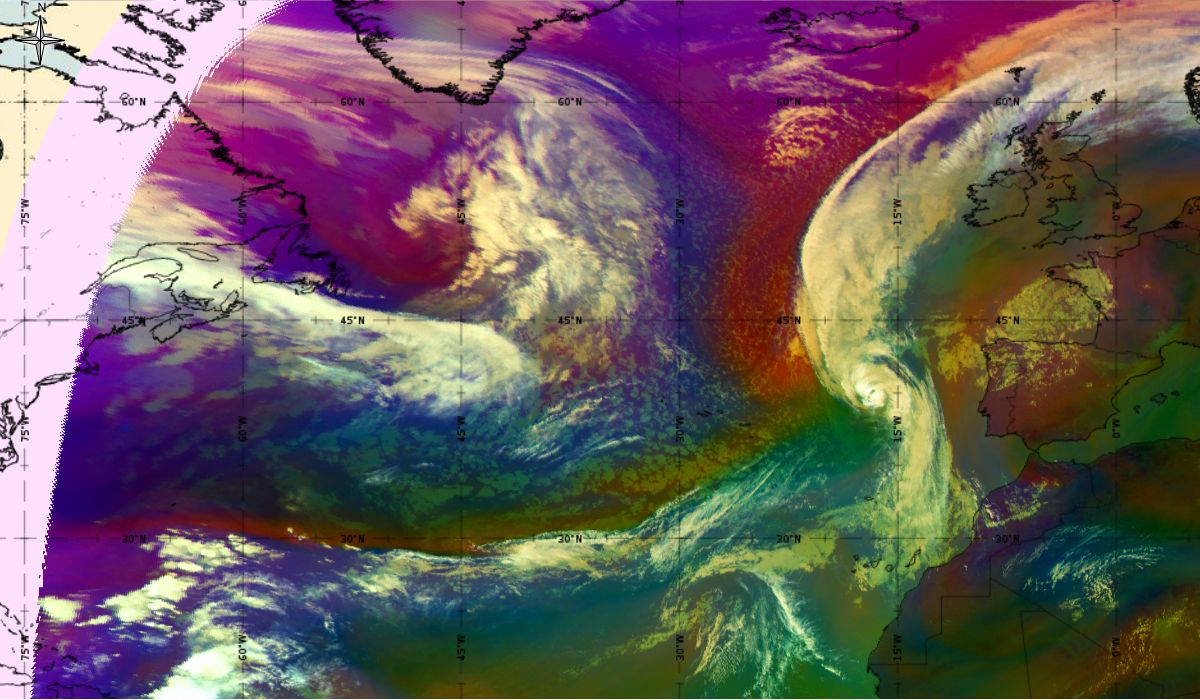
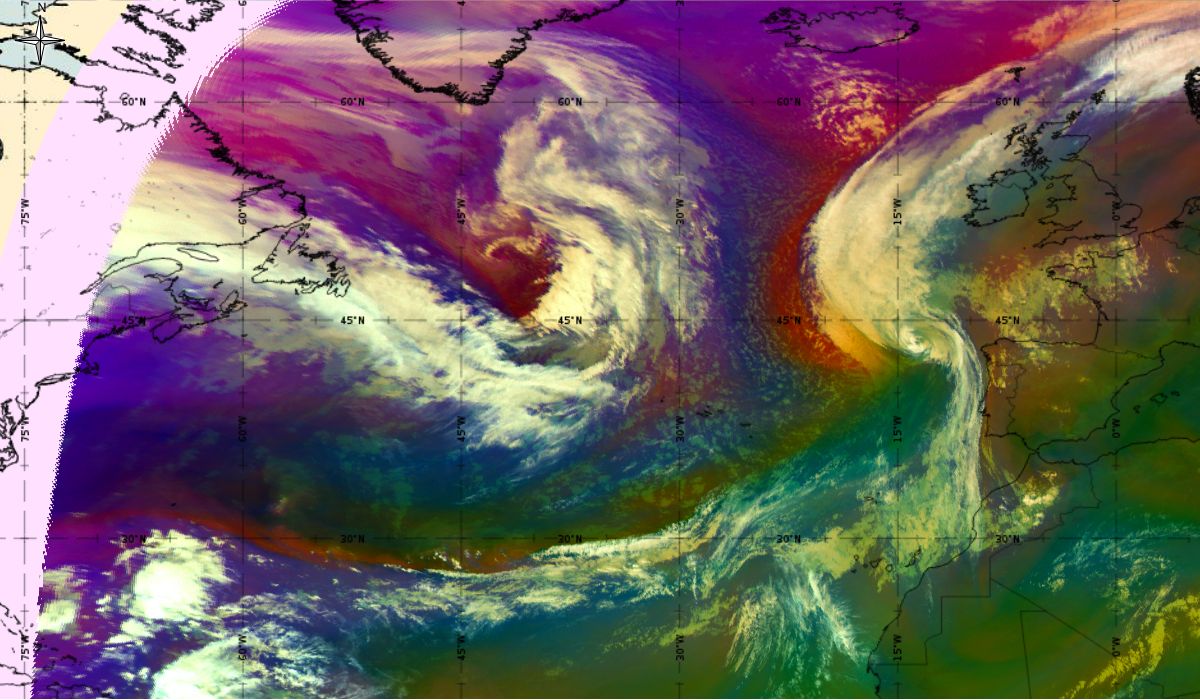
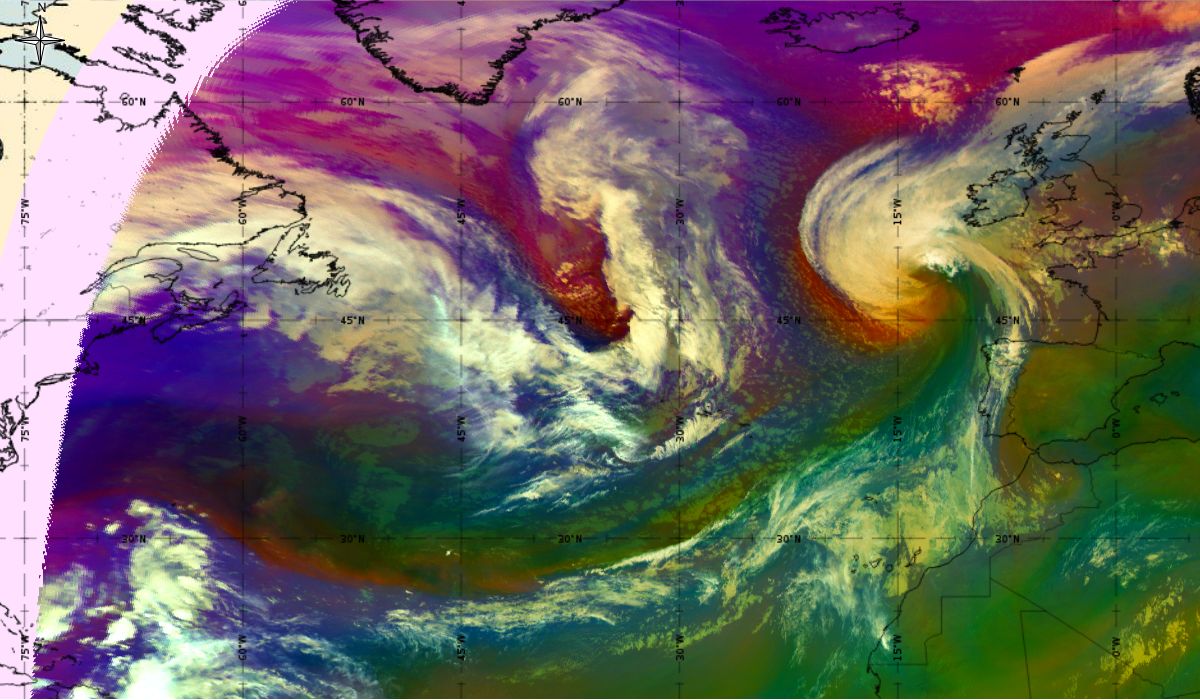
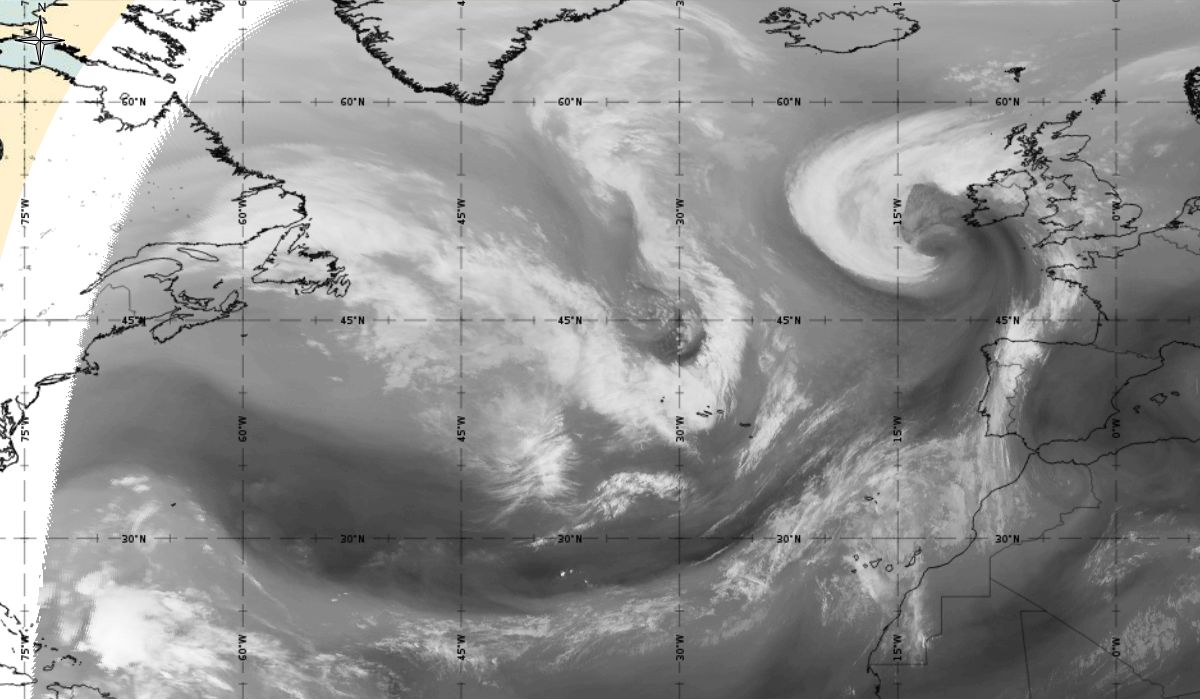
Loop 7 and 8: Meteosat 10 IR 10.8 and Airmass RGB animation from 15th October 2017, 06:00 UTC to 16th October 2017, 06:00 UTC (source: EUMeTrain, ePort)
Note: To go through individual images, click Loop 7 or
Loop 8
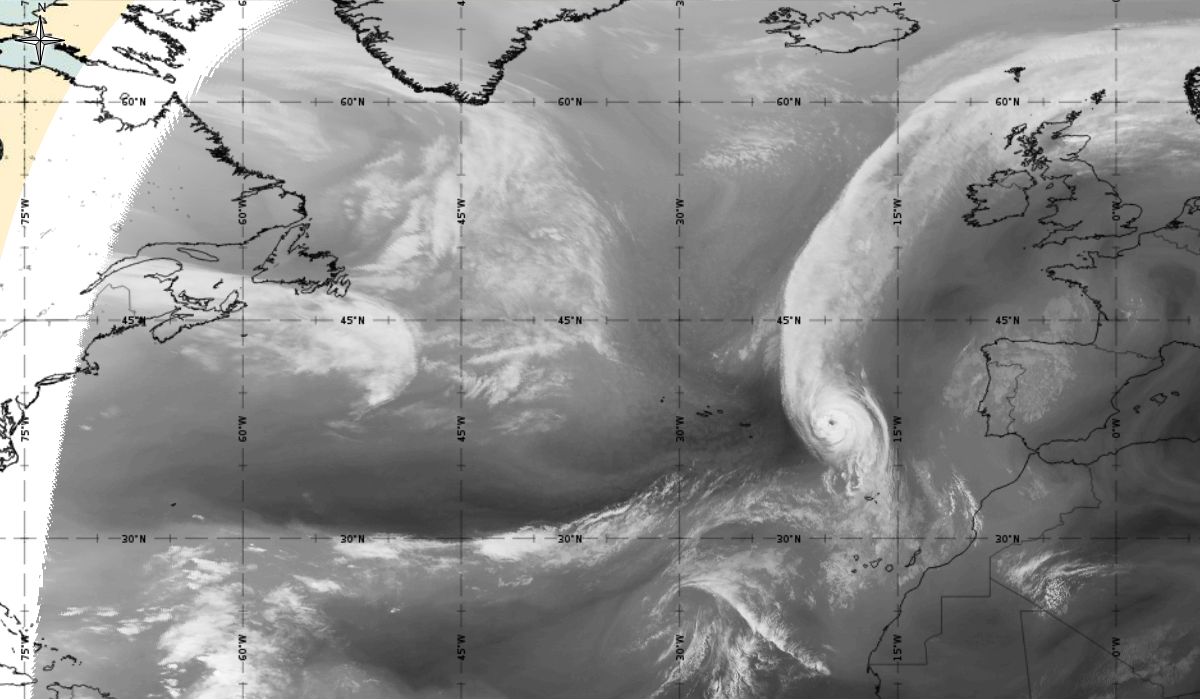
In the beginning, hurricane Ophelia is still in a relatively warm environment, however in the last phase of the transition, stratospheric air at the rear side of the cloud band (red colour) coincides with the upper level trough. The jet stream is clearly visible in transition from blue to red colours, like a pinstripe at the rear side of the cloud band. The jet is coming from behind/above the cold front. The moving to the northeast and development of a comma cloud took place in the left exit region of a jet.
Loop 9: Meteosat 10 WV 7.3 animation from 15th October 2017, 06:00 UTC to 16th October 2017, 06:00 UTC (source: EUMeTrain, ePort)
Note: To go through individual images, click Loop 9
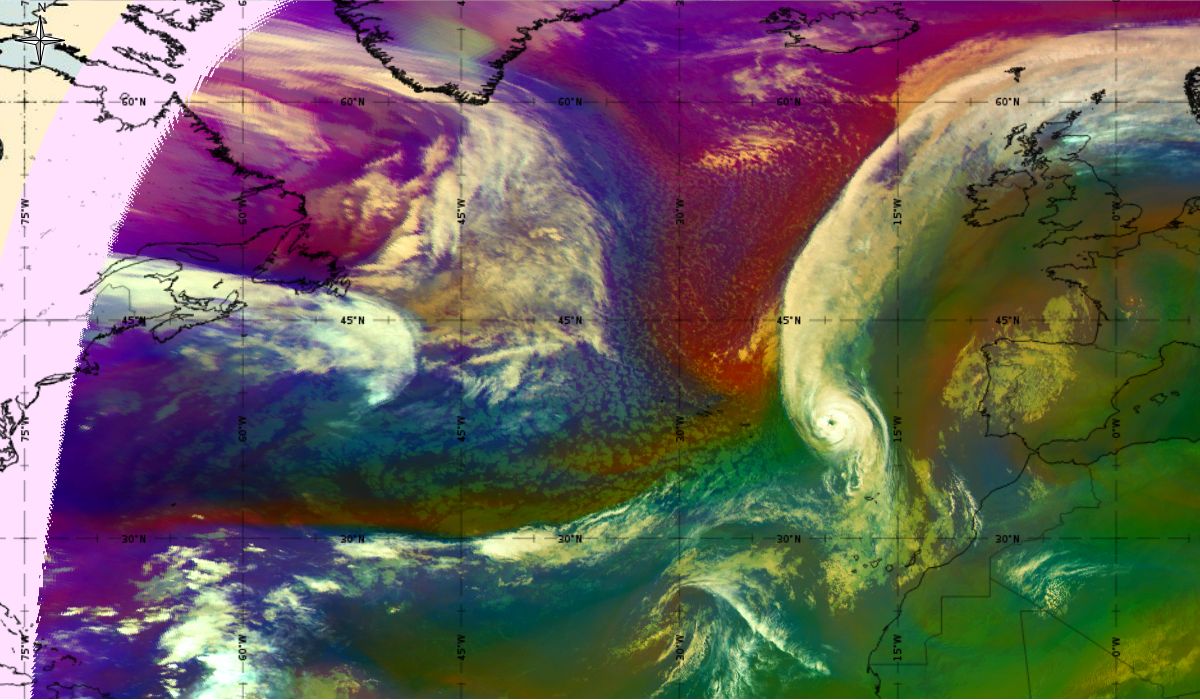
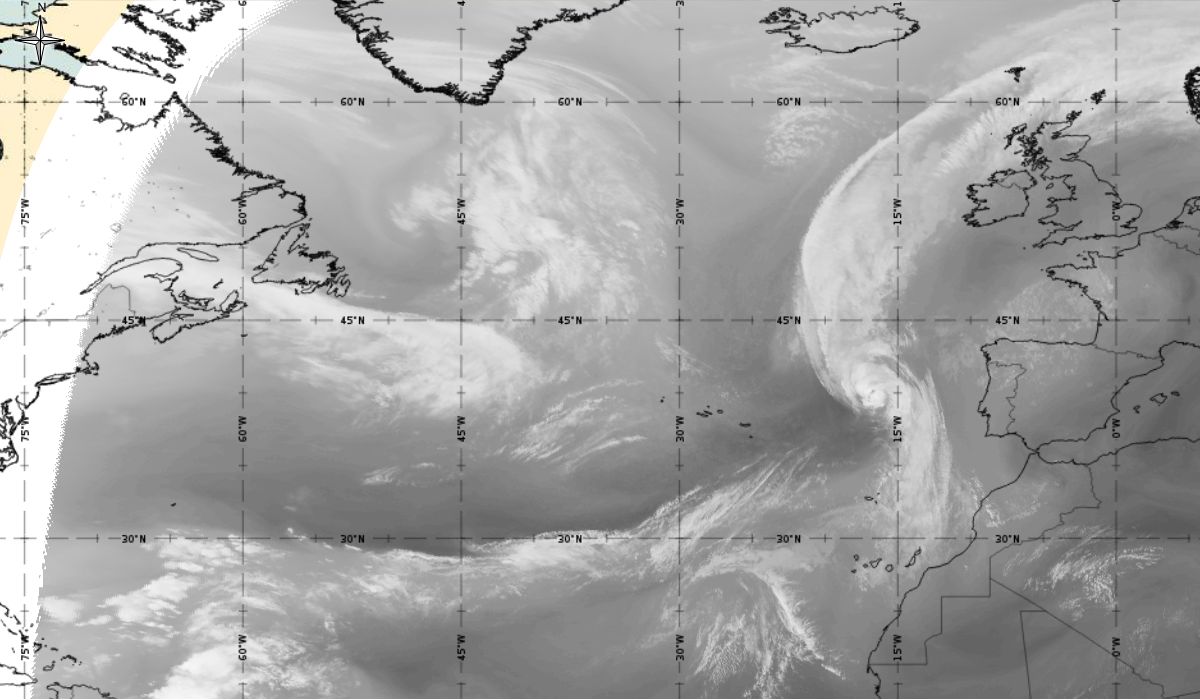
In the water vapor channel the dark area which represents dry air in the upper levels can be seen behind the cloud structure. At the same time, the development of the comma structure in the cold air behind the front can be followed.
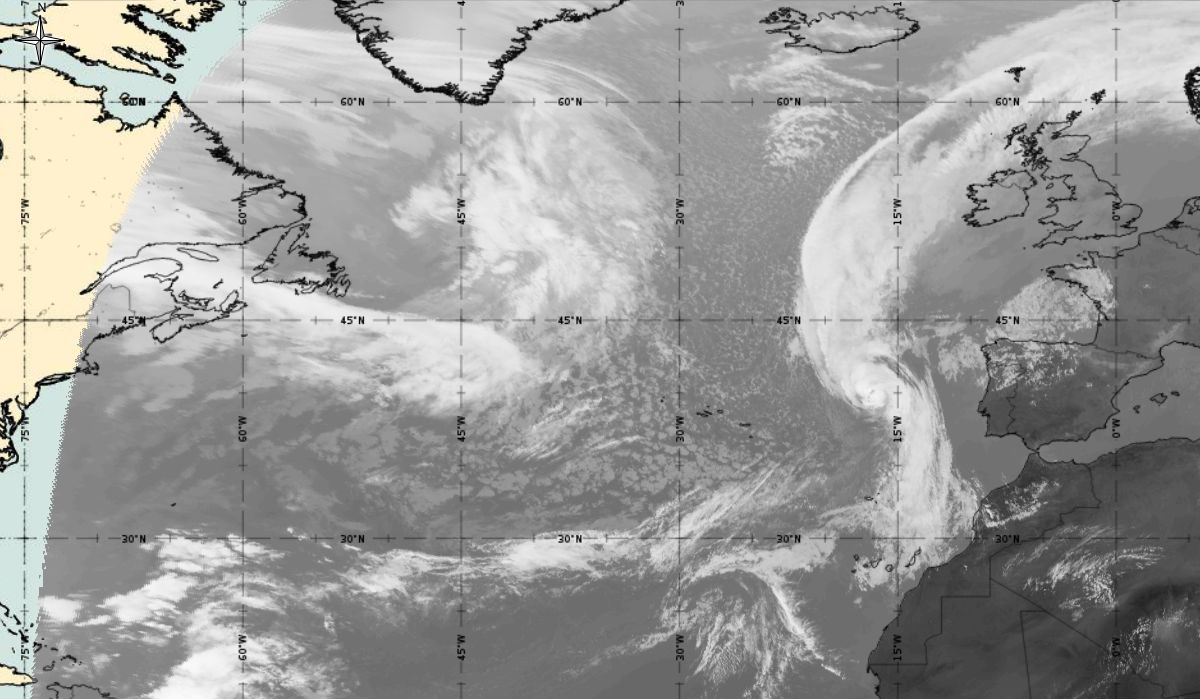
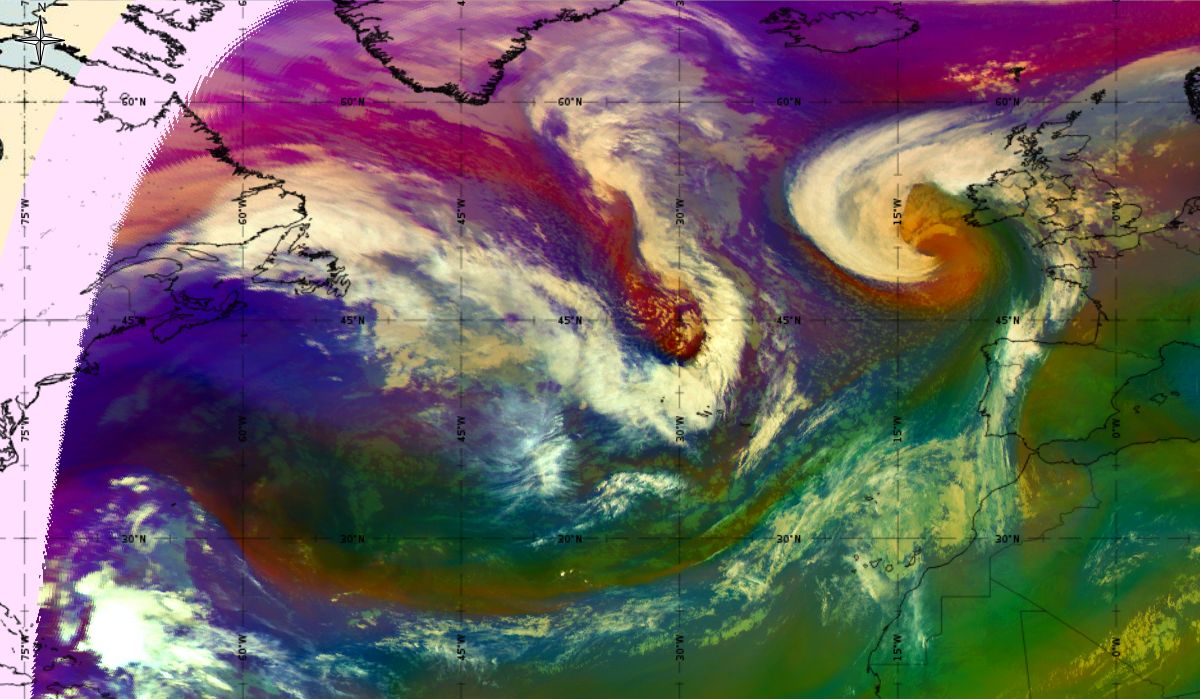
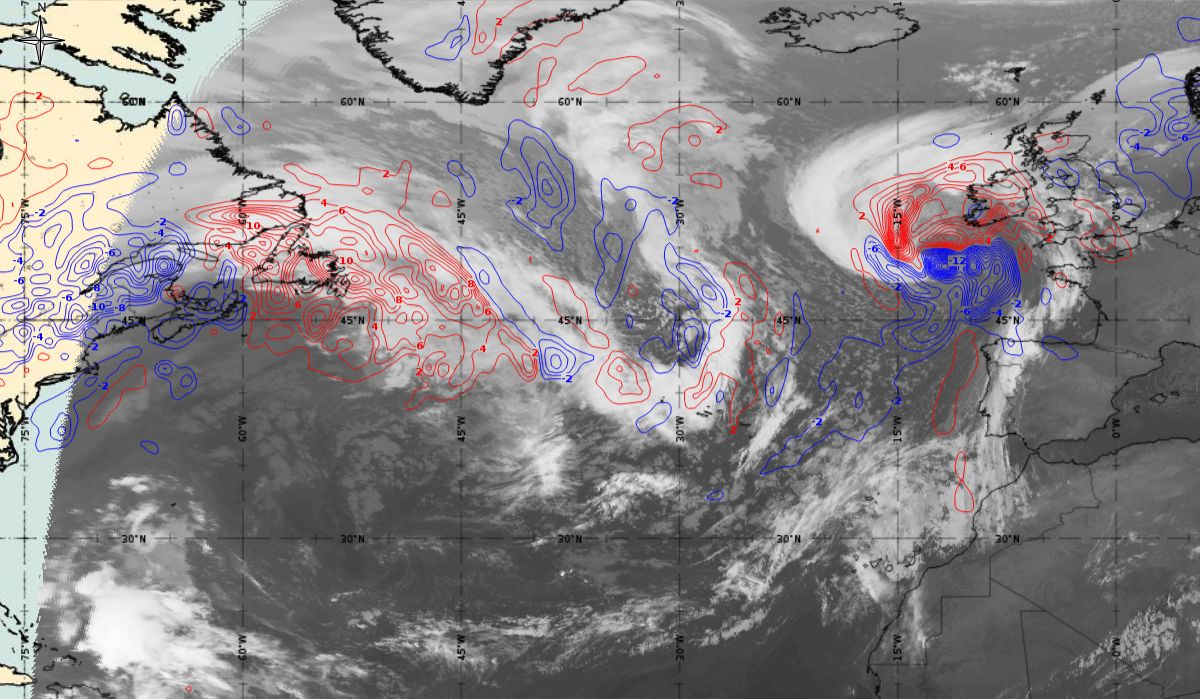
On 15th October 00:00 UTC Ophelia moved north eastward over SST less than 23 °C, which induced a steady weakening trend. It became well embedded within the fast flow of another large mid-latitude trough moving eastwards over the Atlantic. An interaction with the strong upper-level trough and jet stream flow caused the hurricane to begin losing its tropical characteristics and become an extratropical cyclone. It can be seen by comma cloud appearance in the satellite image (Figure 22) - a classical shape of an extratropical cyclone. The comma is located at the left exit of one of the brunches of the jet streak. The cold and dry stratospheric air (red colour) is located on the west and south side of the cyclone, while warm, moist air (greenish colour) is located behind the frontal cloud cover.
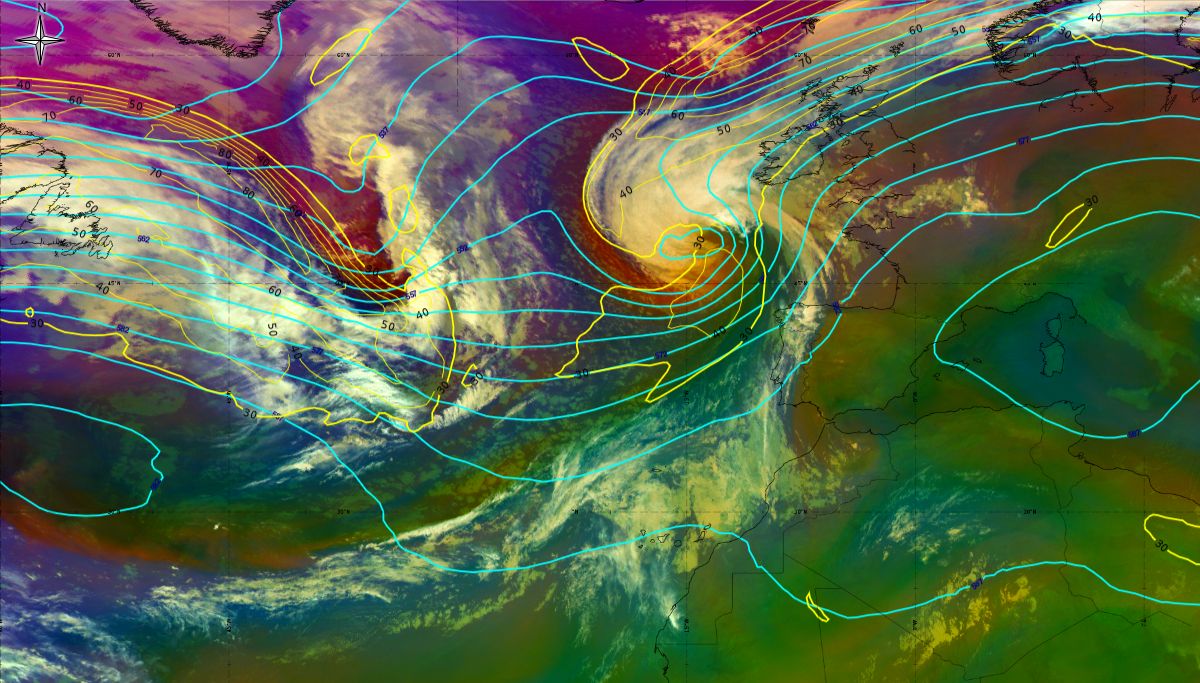
Figure 22: 16th October 2017 00:00 UTC - MSG Airmass RGB, geopotential height at 500 hPa (blue line), isotach at 300 hPa (yellow line - both ECMWF), source: EUMeTrain, ePort.
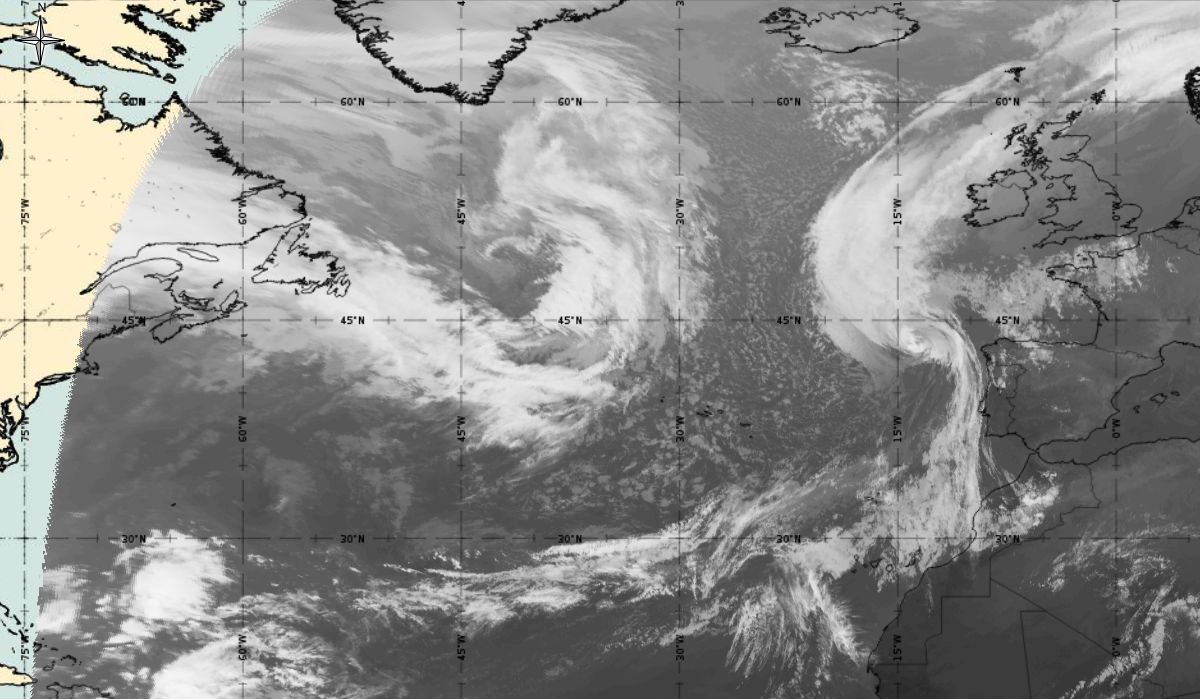
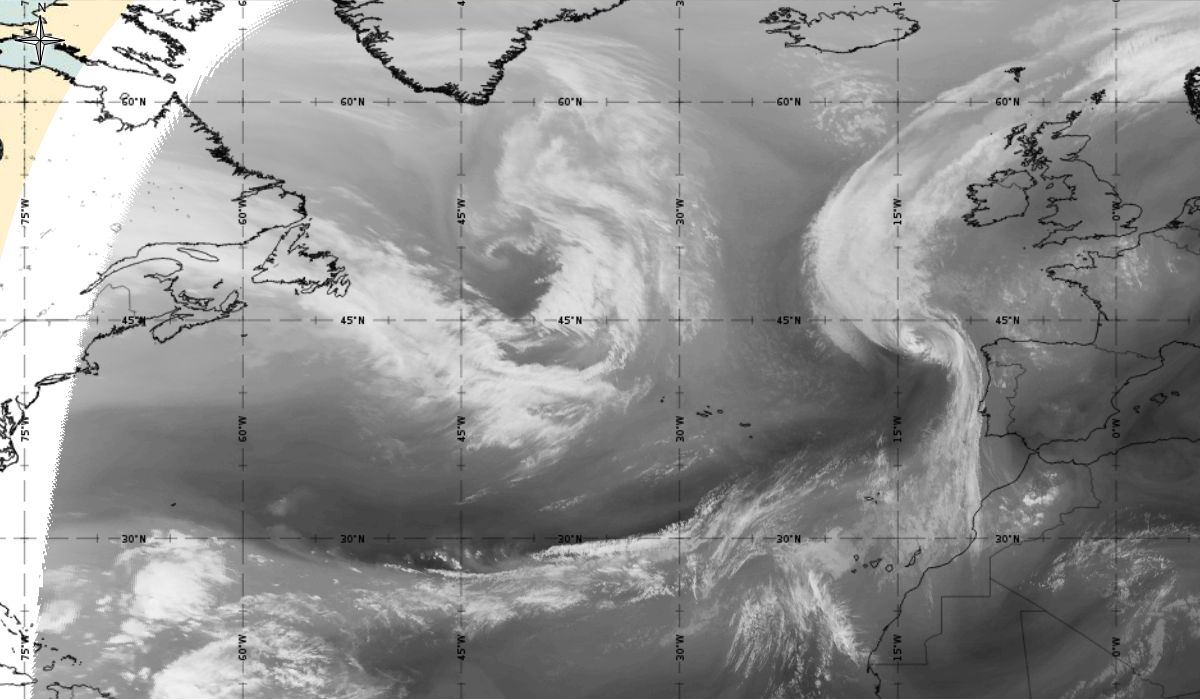
Extratropical cyclone Ophelia approached Ireland, traveling ahead in a strong, south-westerly flow at the front side of the upper level trough, it merged with the cold front. It made landfall along the southwestern coast of Ireland at around 11:00 UTC on 16th October 2017 (Figure 23.1 and 23.2).
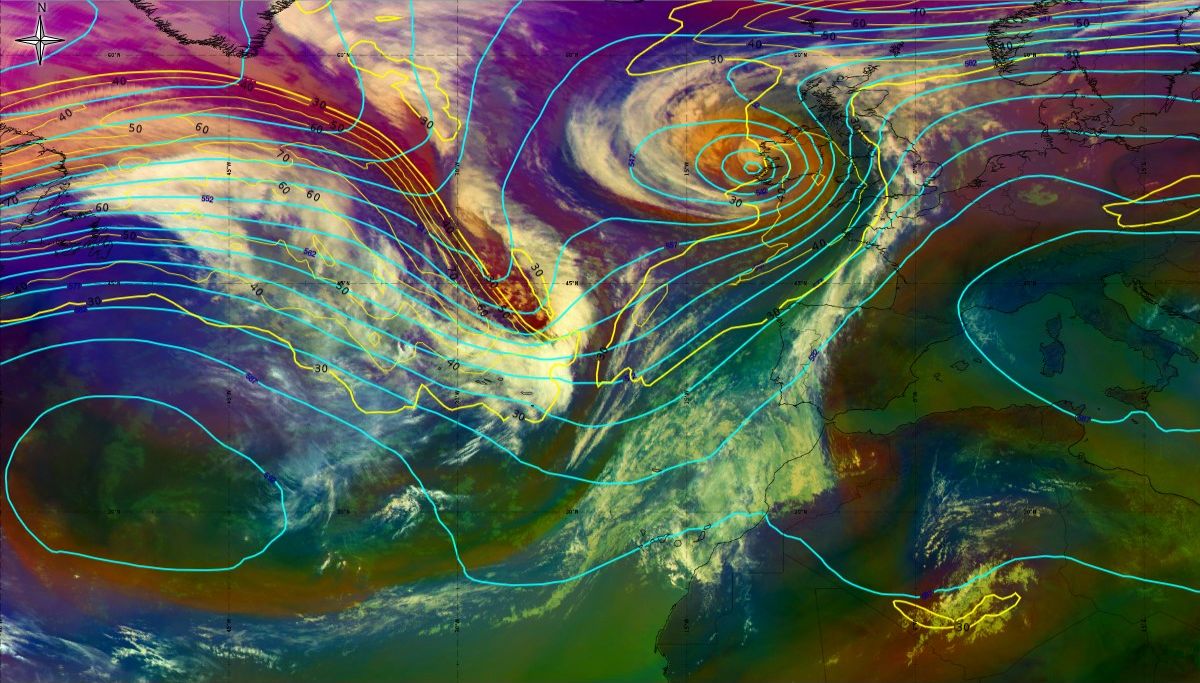
Figure 23-1: 16th October 2017 12:00 UTC - MSG Airmass RGB, geopotential height at 500 hPa (blue line), isotach at 300 hPa (yellow line - both ECMWF), source: EUMeTrain, ePort.
Figure 23-2: 16th October 2017 12:00 UTC surface analyse, source DWD
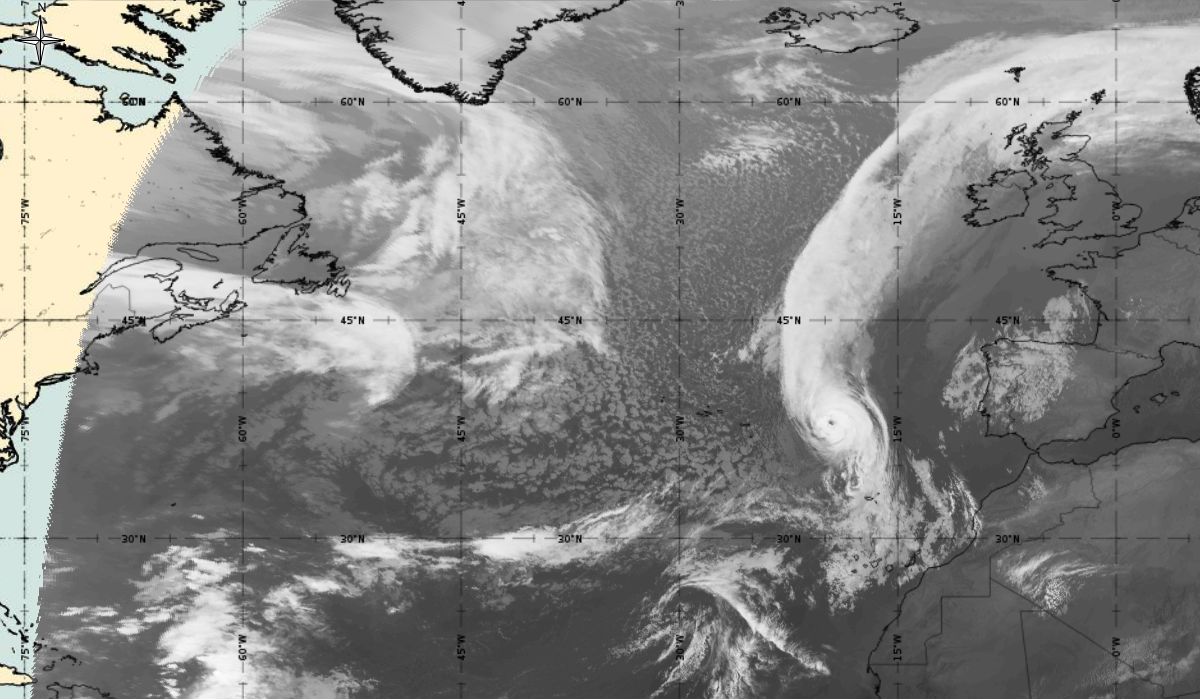
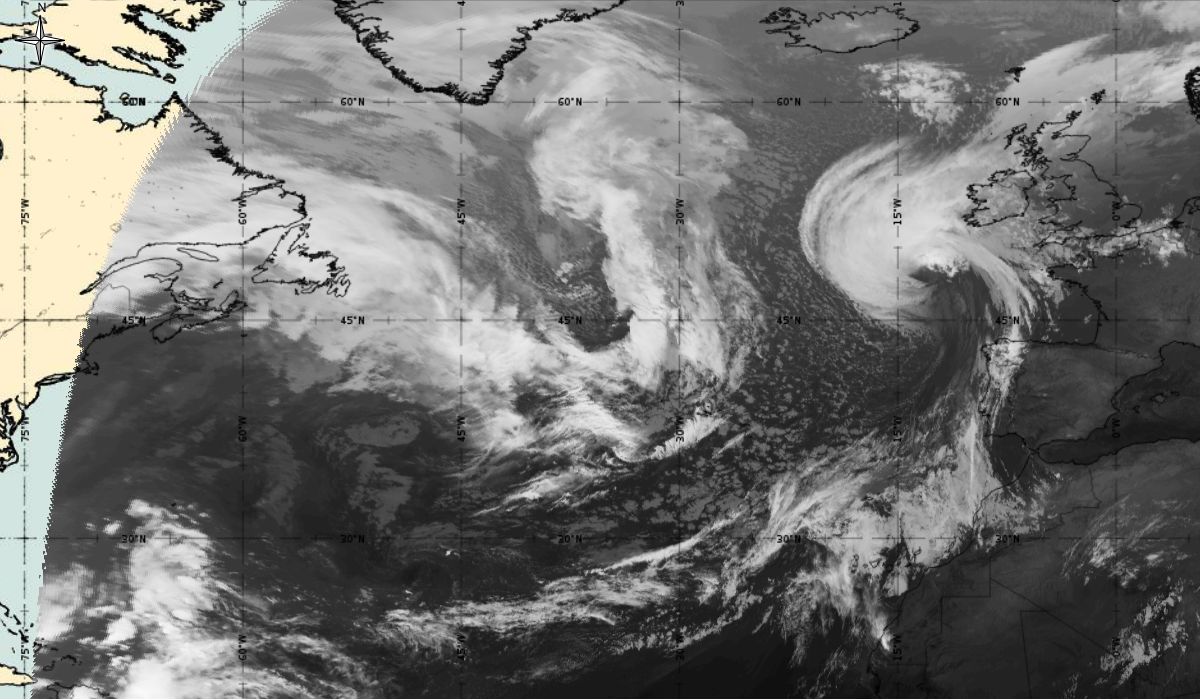
In the enhanced infrared satellite image (Figure 24) we can see that in the comma head, convective cloud intensifies with cloud top temperature around or even lower than -60°C. The comma tail still consists of lower cloud tops but shows some enlargement of the cloud band.
On the 24-hour Microphysics RGB, the comma cloud head consists of thick, high, and cold ice clouds; presented in a dark red colour. Thick, mid-level water cloud appears in a yellow/orange colour.
|
|
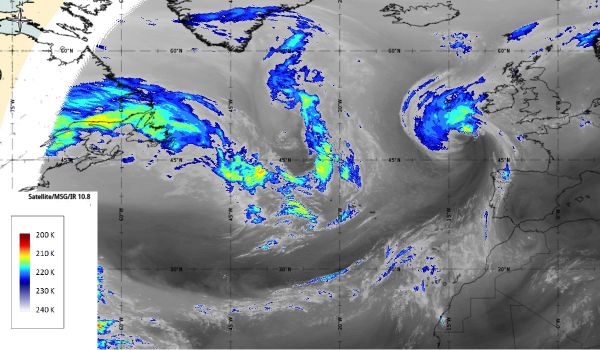
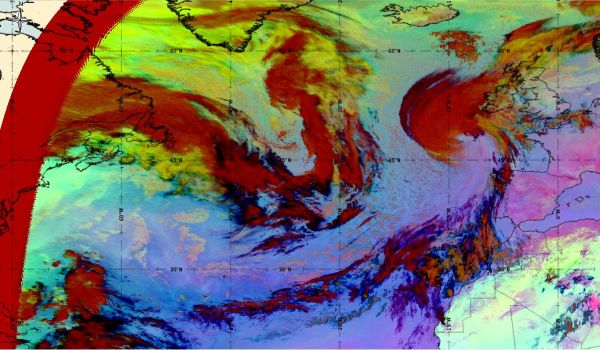
Figure 24: Meteosat 10 Enhanced IR10.8/24-hour Microphysics RGB, 16th October 2017, 00:00 UTC (source: EUMeTrain, ePort)
Extratropical cyclone Ophelia continued its north-eastward path across Ireland, north Scotland, and Norway, steadily weakened before dissipating by 18th October 00:00 UTC.
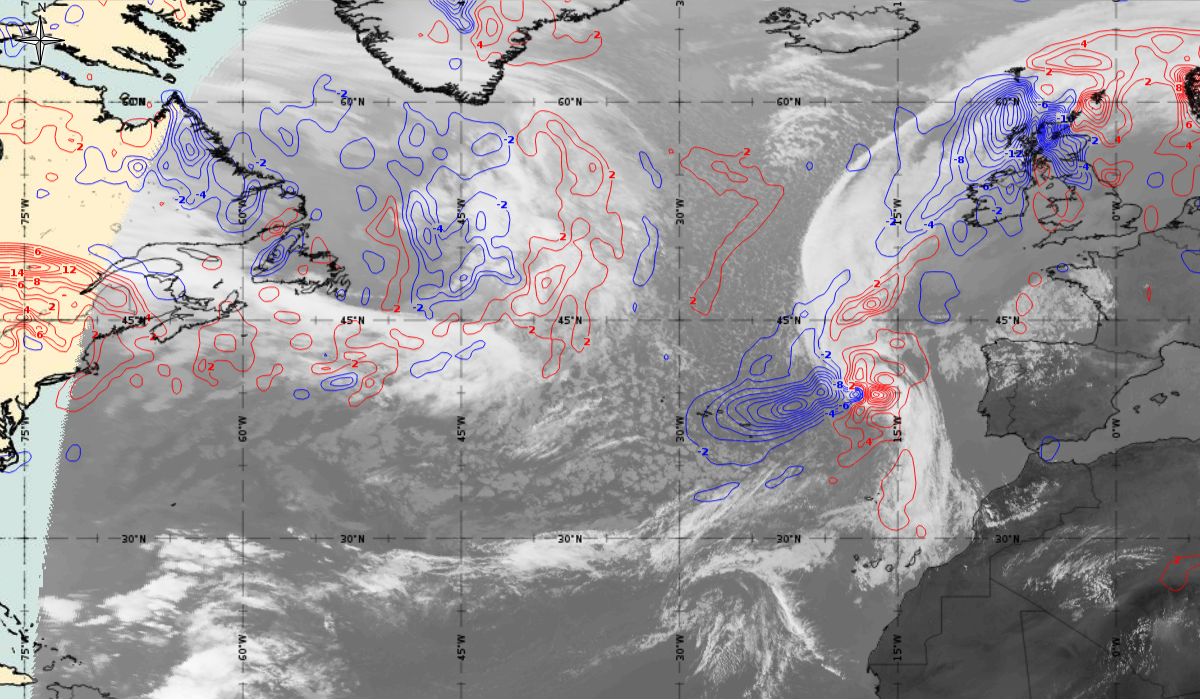
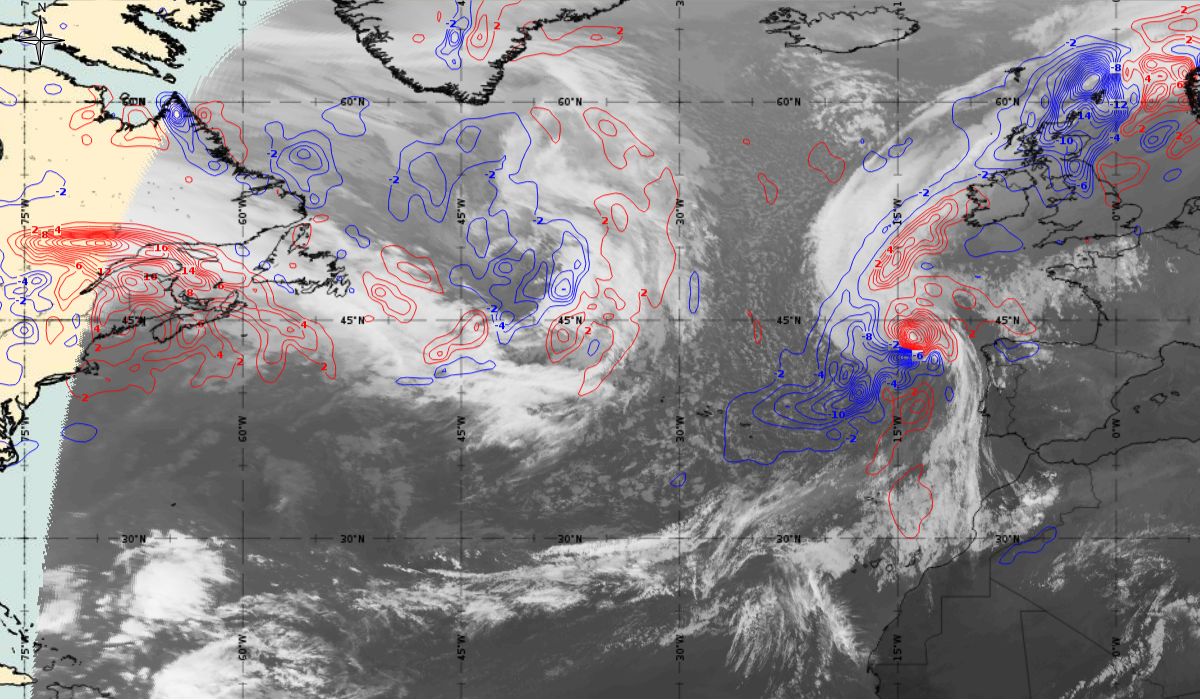
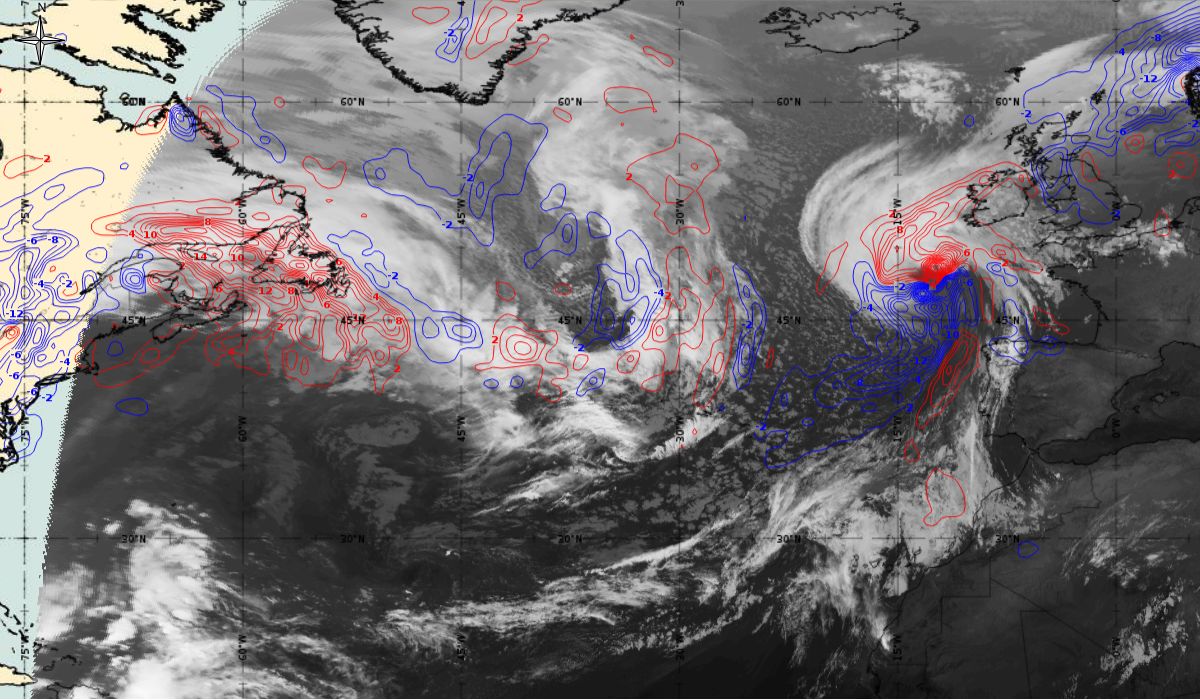
Temperature advection at 700 hPa (IR images)
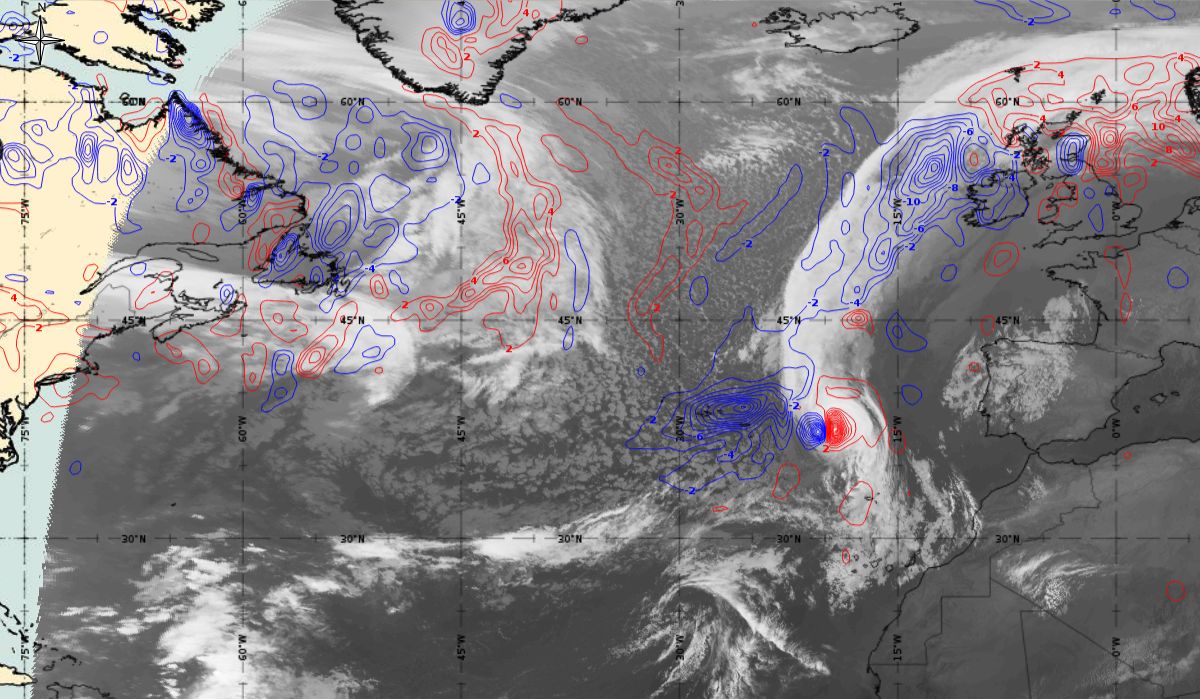
The hurricane becomes extratropical (Figure 25) with strong cold advection behind the comma cloud and warm advection over cloud head. For extratropical lows, we can say that they are former warm-core lows that have transitioned into a cold-core low.
Cold core storms derive their energy from baroclinic sources, i.e., they derive their energy from the difference of temperature in air masses.
Figure 25: Temperature advection at 700 hPa (blue lines - cold advection, red lines - warm advection), Meteosat 10 IR 10.8 from 15th October 2017, 06:00 UTC to 16th October 2017, 06:00 UTC (source: EUMeTrain, ePort)
Note: Click on the image to go through the gallery
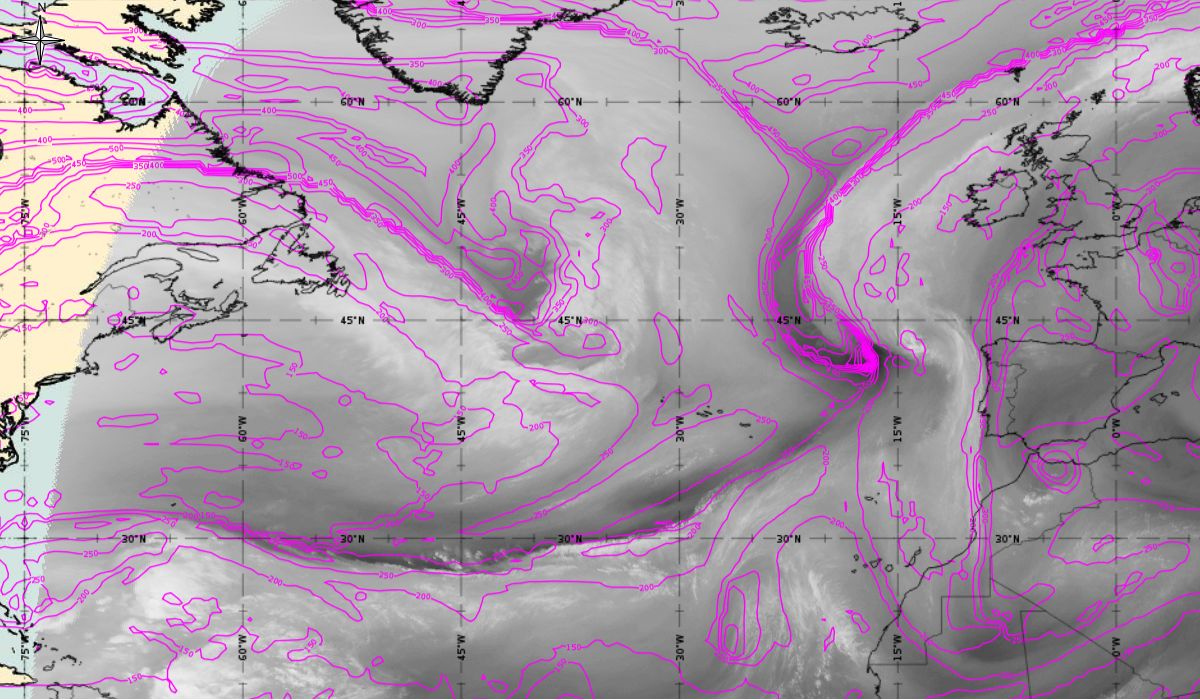
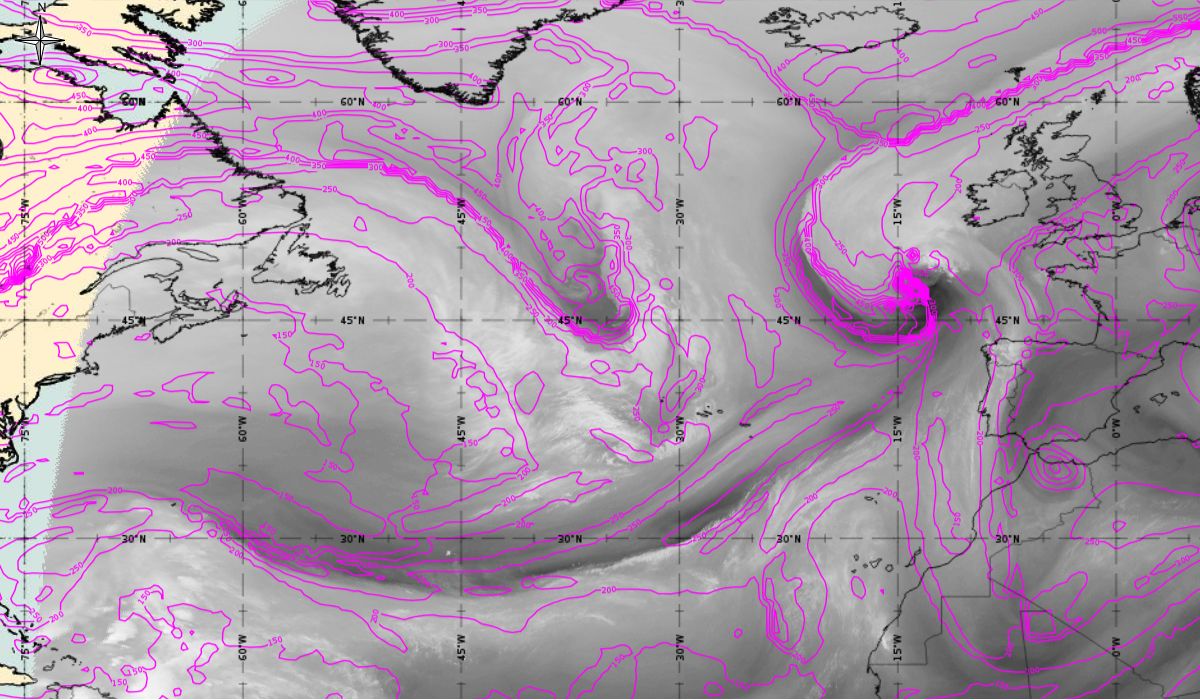
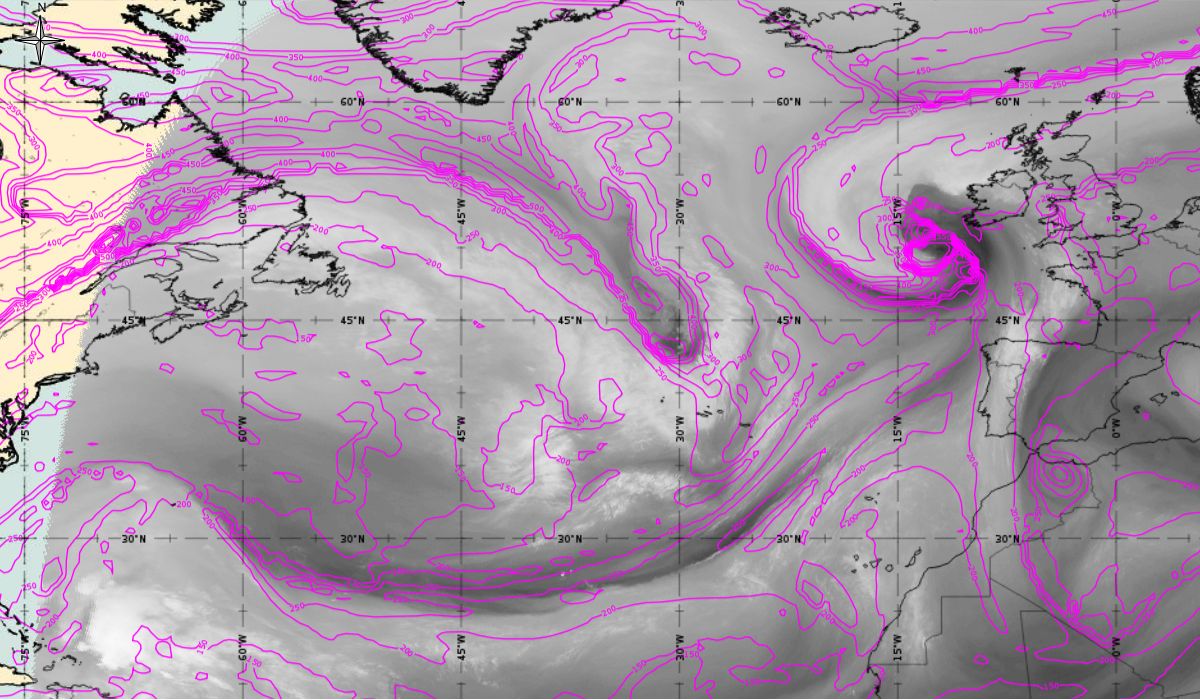
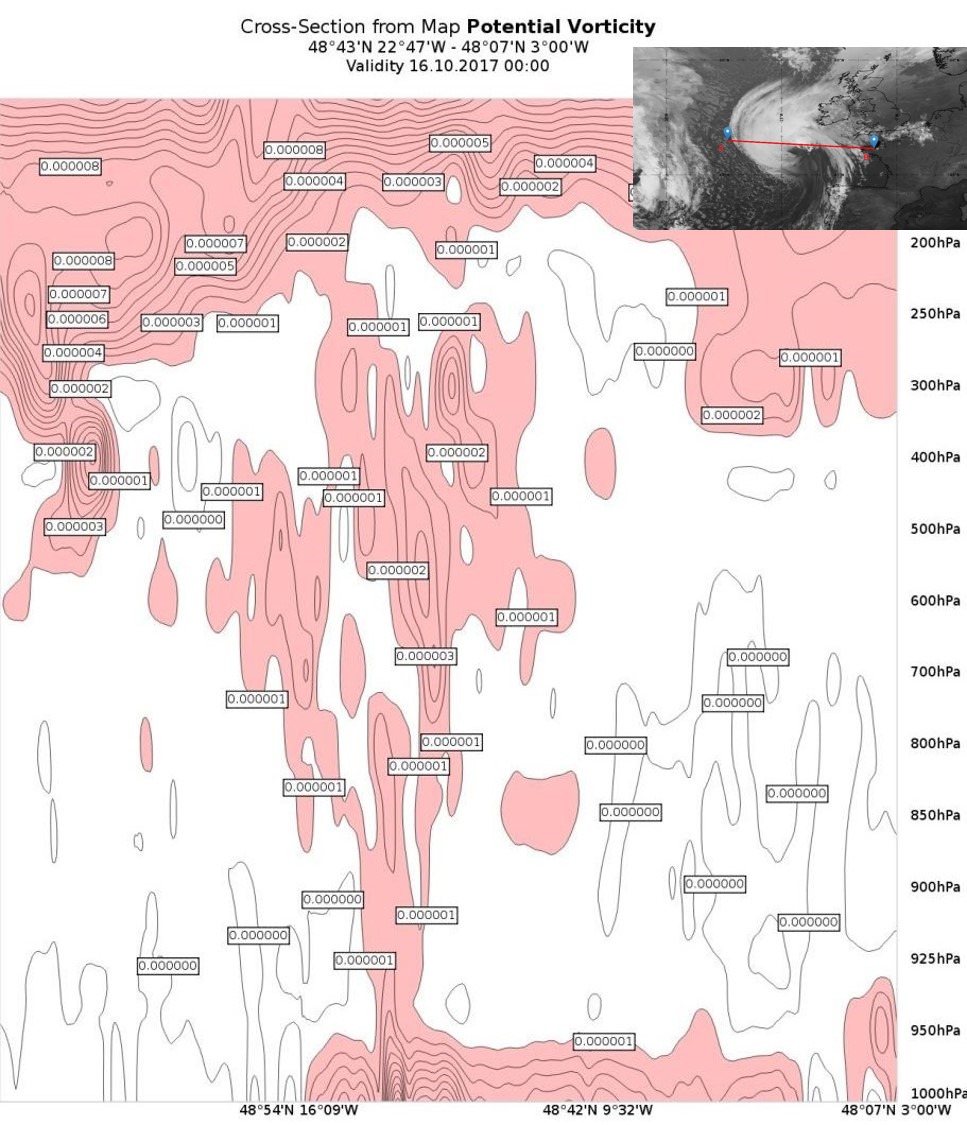
Height of PV=1,5; WV images
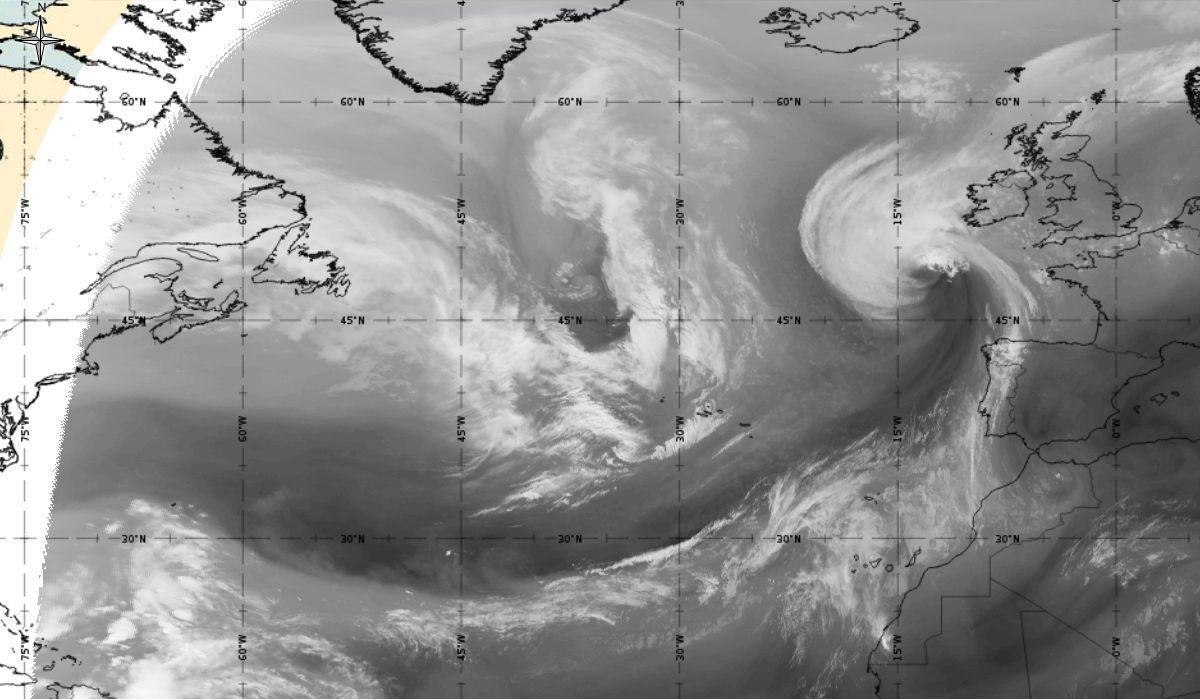
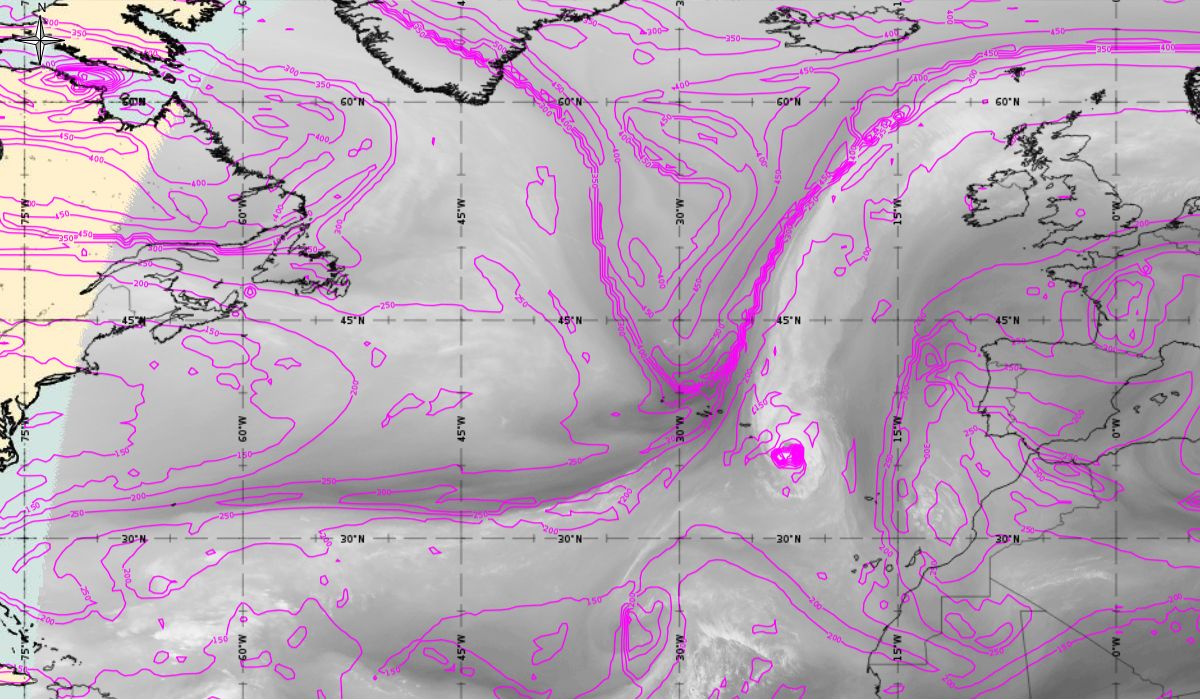
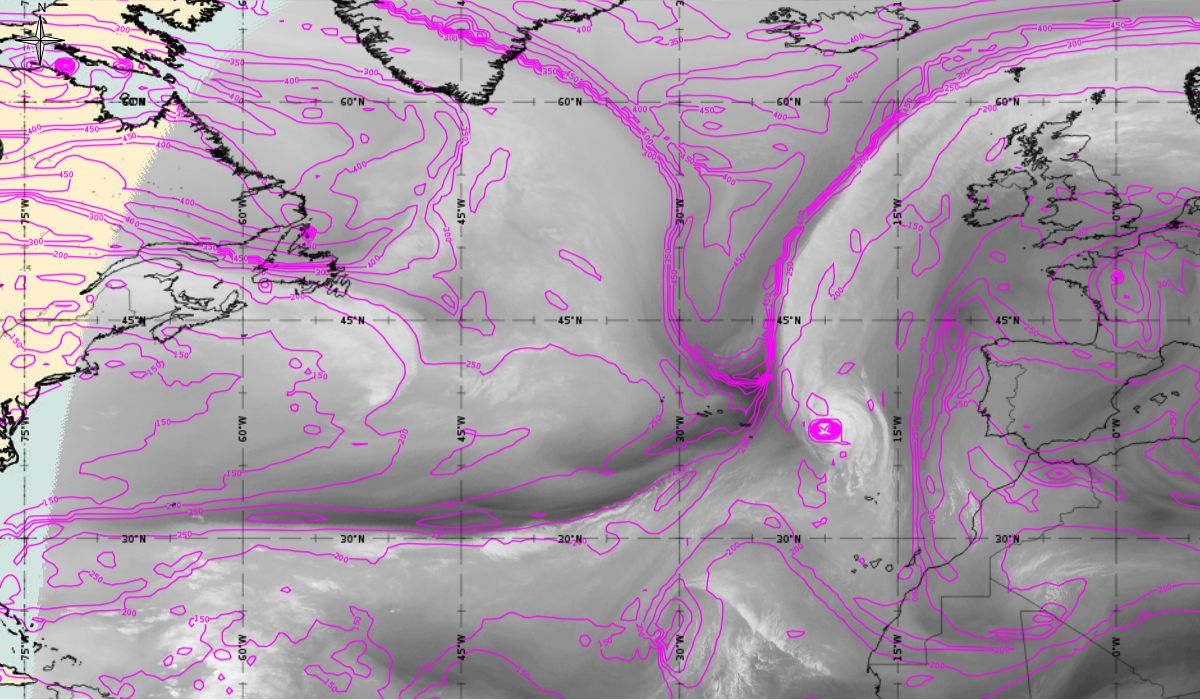
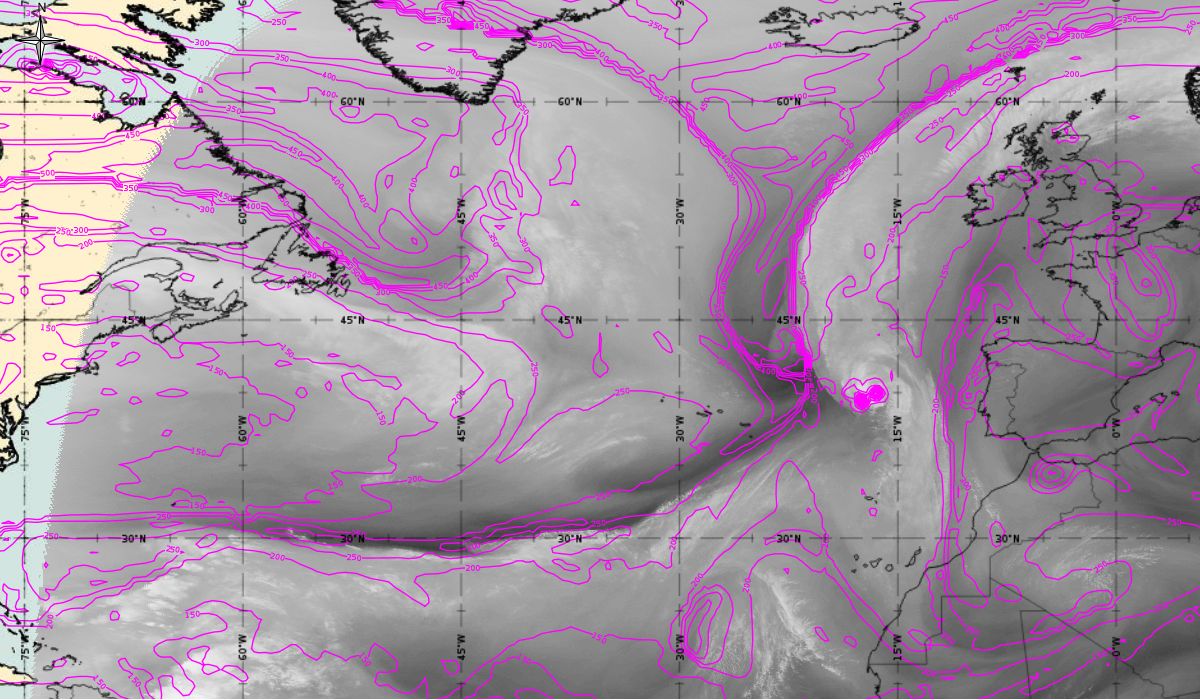
During the lifetime of the storm Ophelia and hurricane Ophelia, we notice the existence of a maximum of PV anomaly over it, but the dark stripe is not so pronounced. It starts to get more pronounced when Ophelia is embedded with the frontal system from the north on 15th October (Figure 26). The lines of PV = 1.5 reaches down to 500 hPa and show a strong gradient in the height of the tropopause. A dry slot in WV imagery (16th October 00:00 UTC) appears as a part of the descending air entering to the southwest of the surface low.
Loop 10: Height of PV=1.5 PVU (magenta), Meteosat 10 WV 6.2 from 15th October 2017, 00:00 UTC to 16th October 2017, 06:00 UTC (source: EUMeTrain, ePort)
Note: To go through individual images, click Loop 10
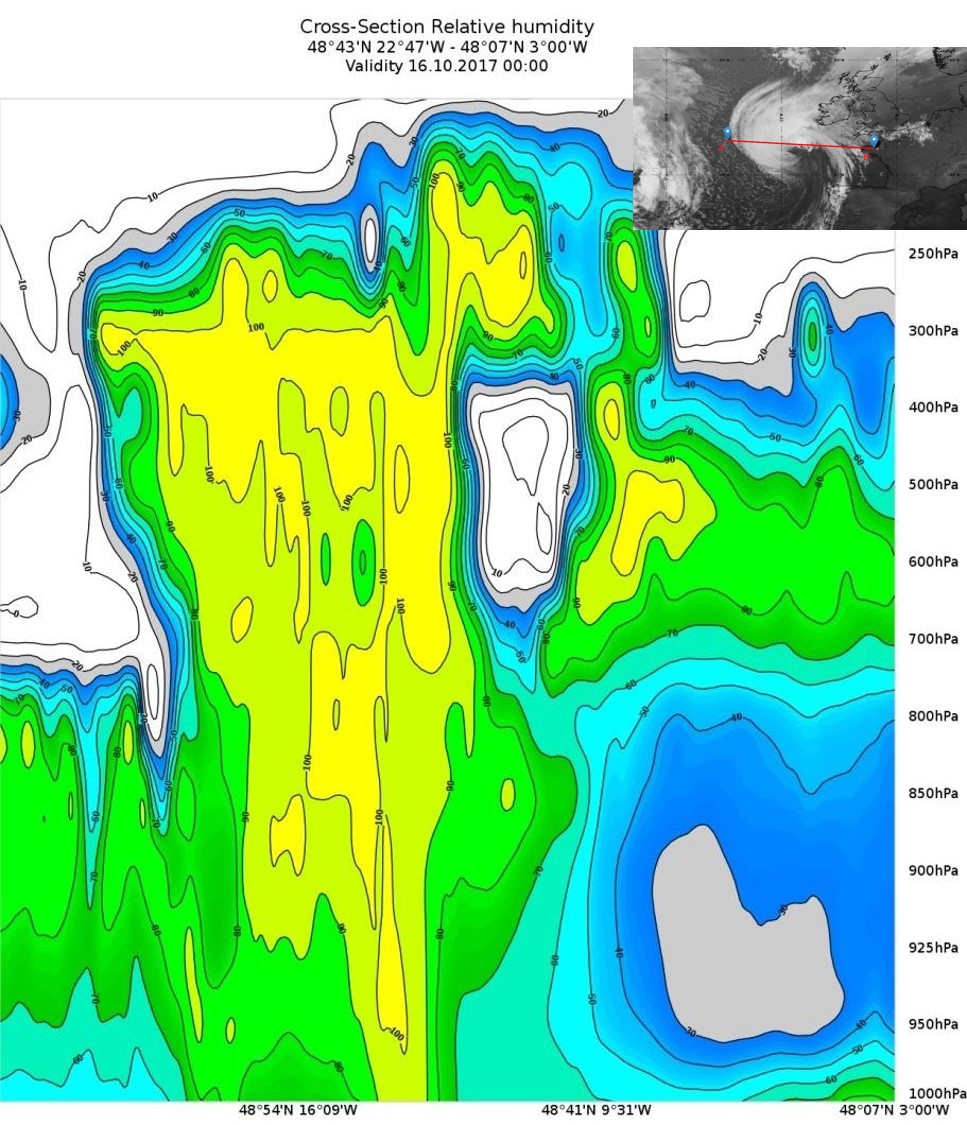
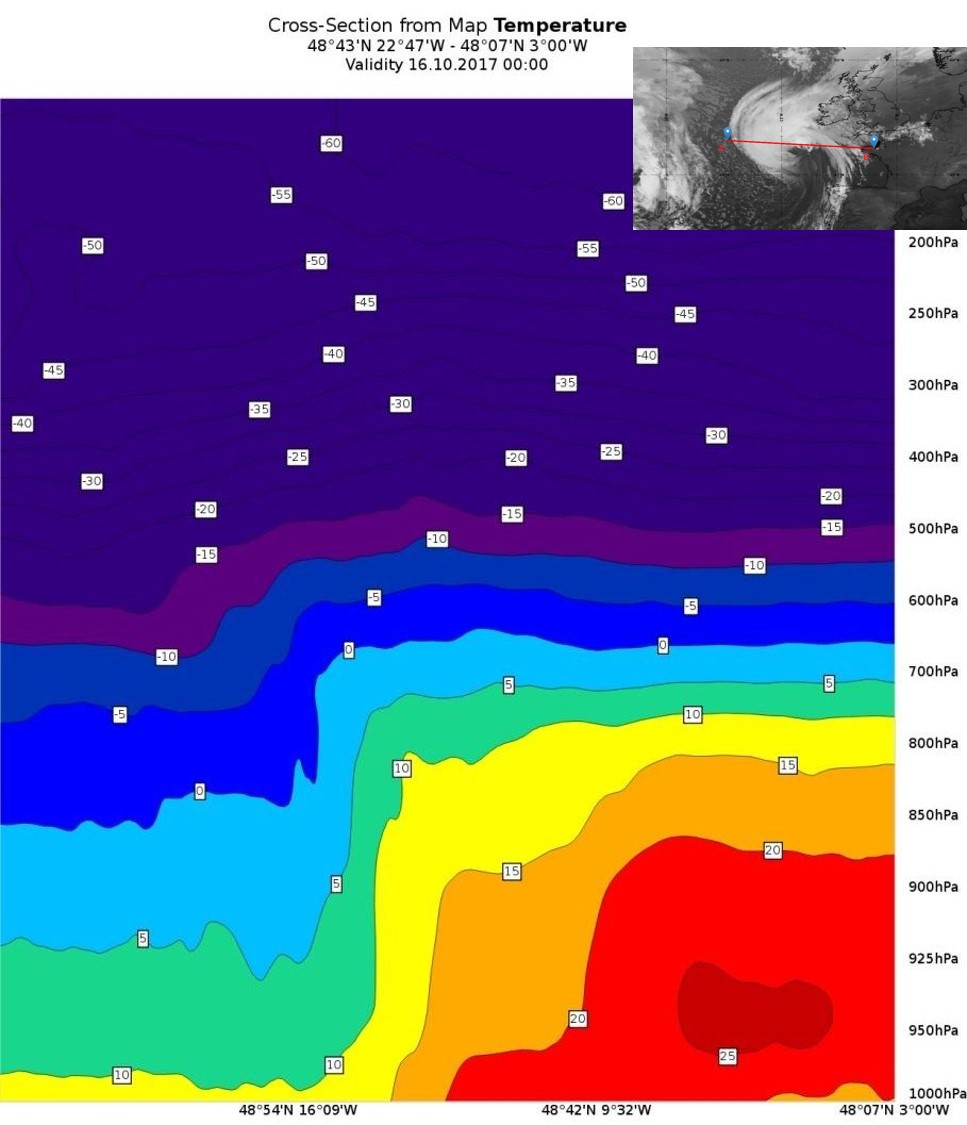
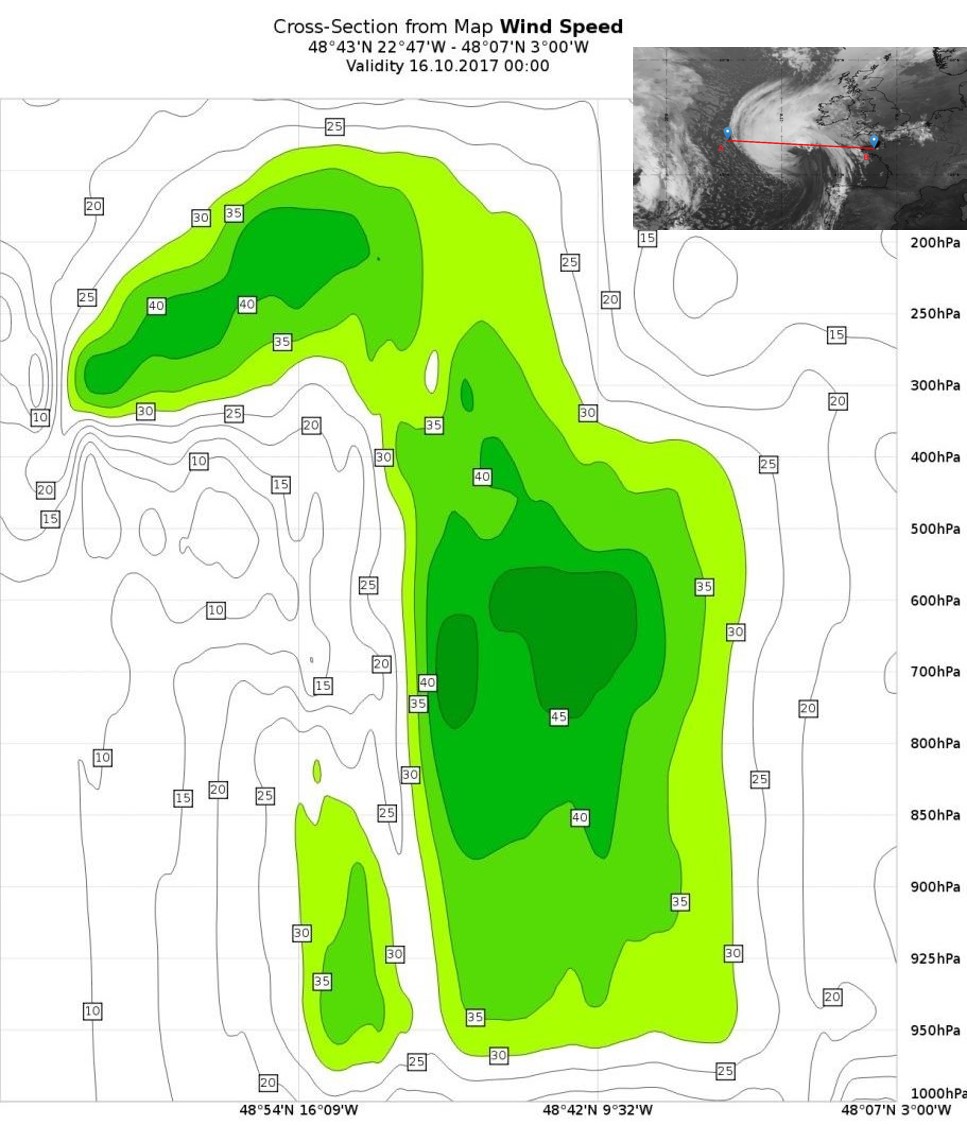
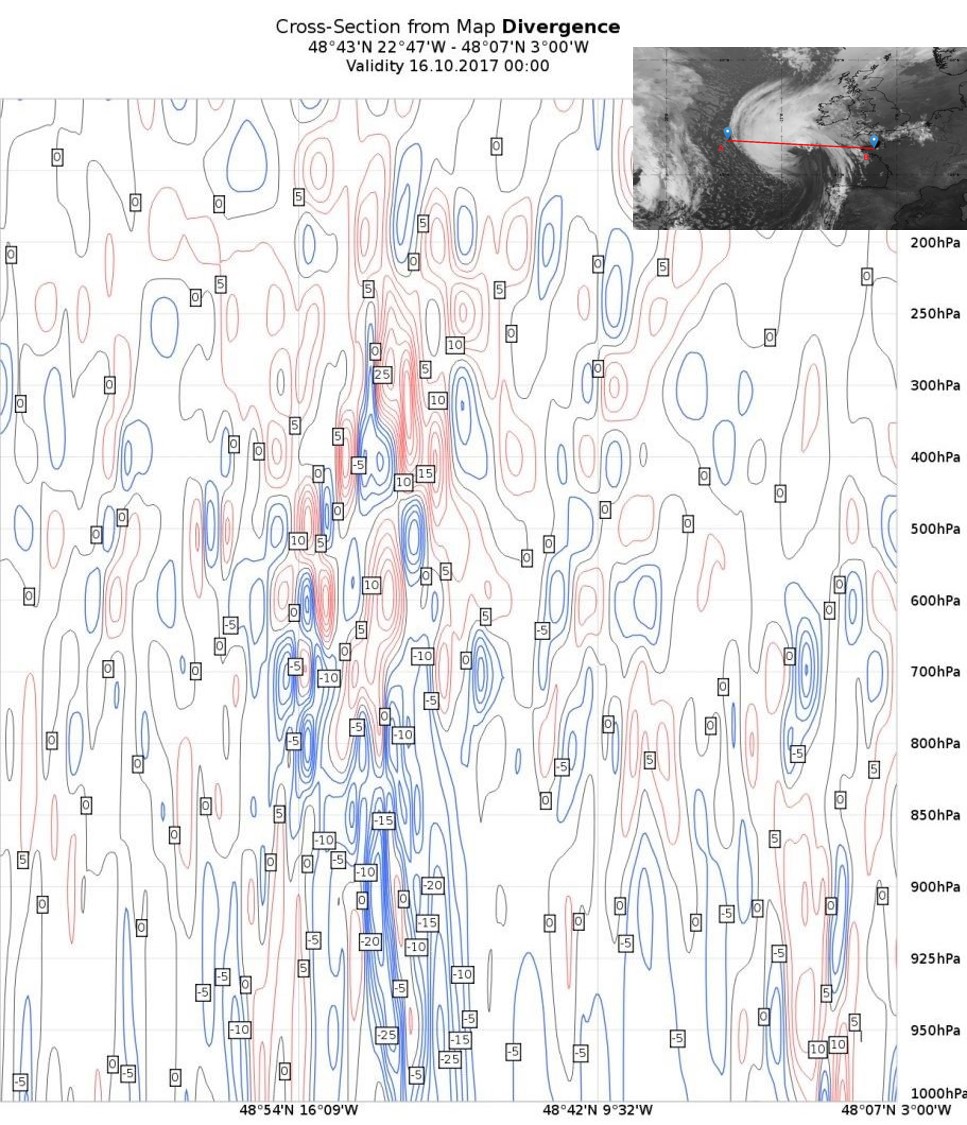
Vertical cross section
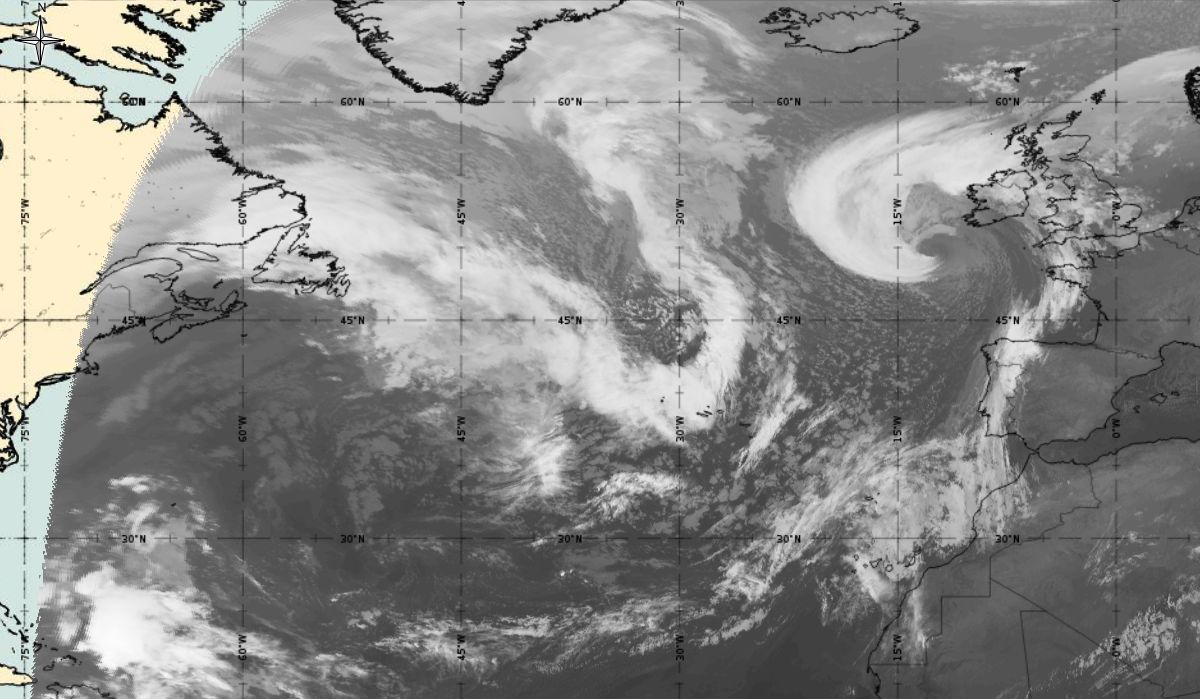
On 16th October, Ophelia was demoted from hurricane to an extratropical storm. A vertical cross section (Figure 27) will help us understand the three-dimensional dynamics of the extratropical cyclone.
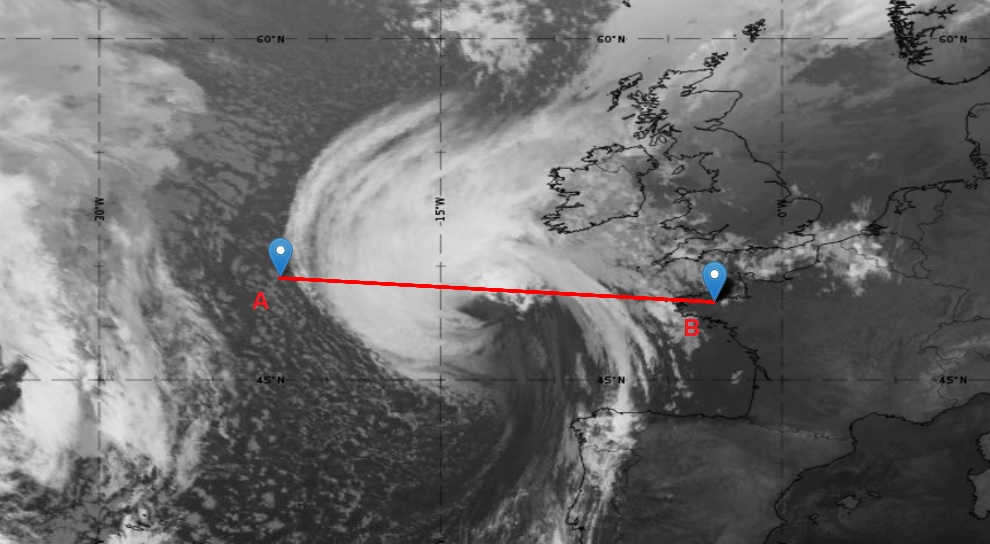
Figure 27: Meteosat 10 IR 10.8 at 16th October 2017, 00:00 UTC; position of vertical cross section indicated (source: EUMeTrain, ePort)