Hurricane phase
Hurricane Ophelia - development from category 1 to category 3 on Saffir Simpson scale
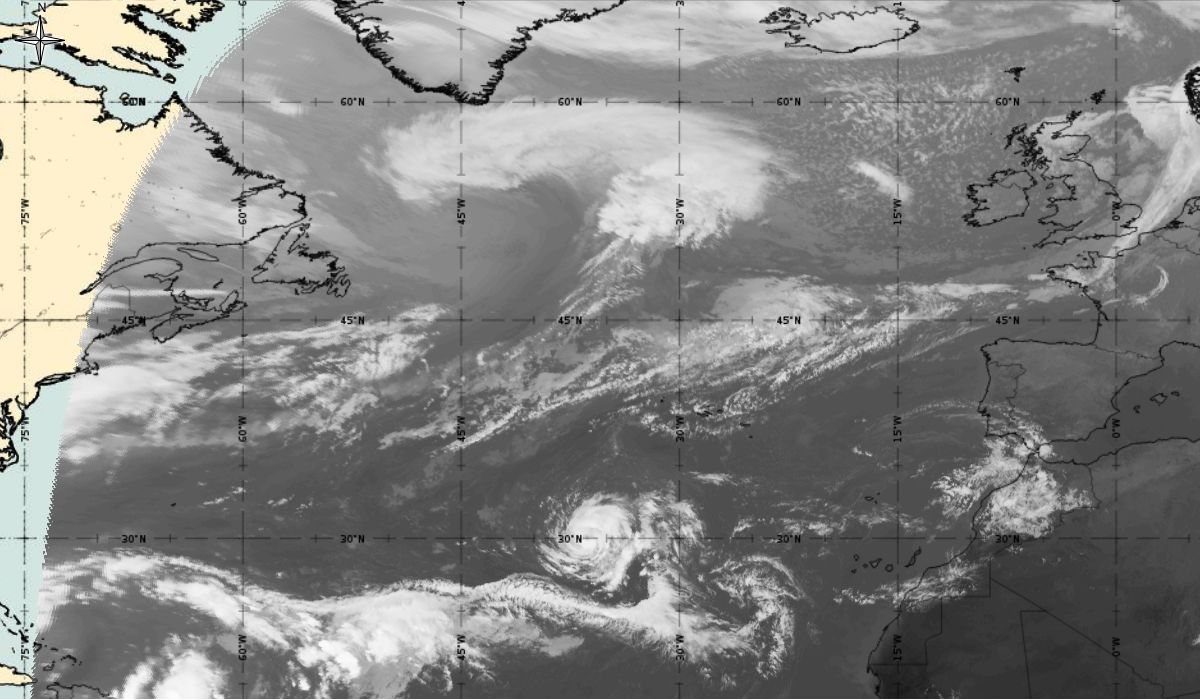
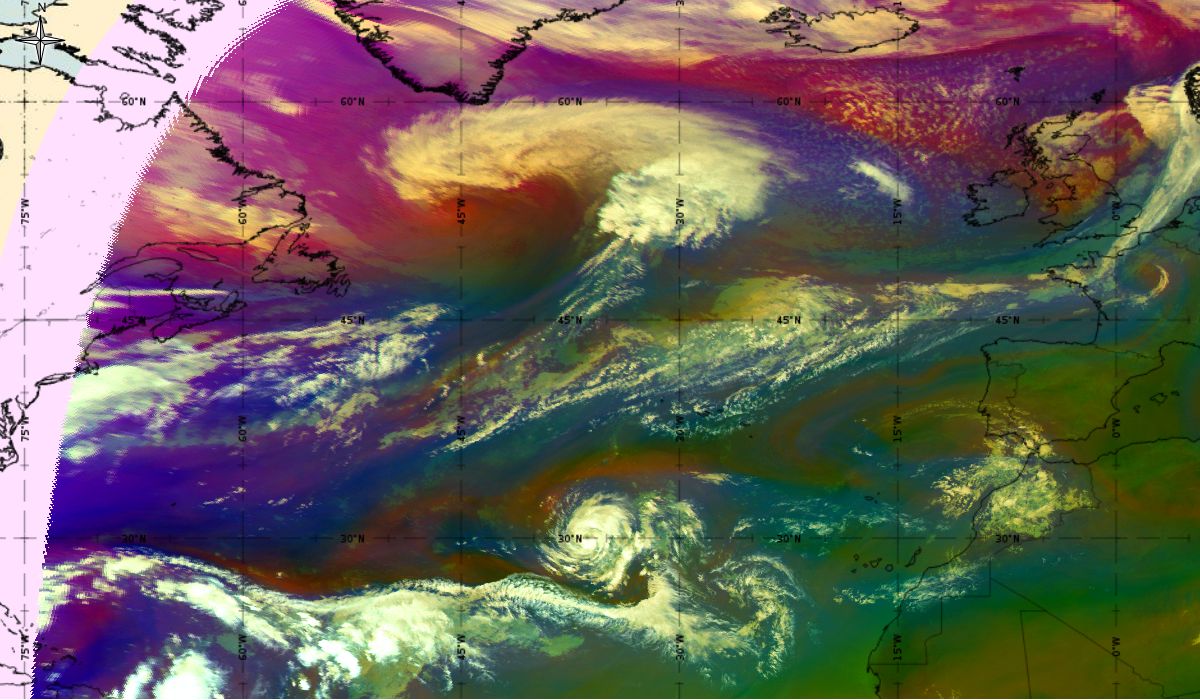
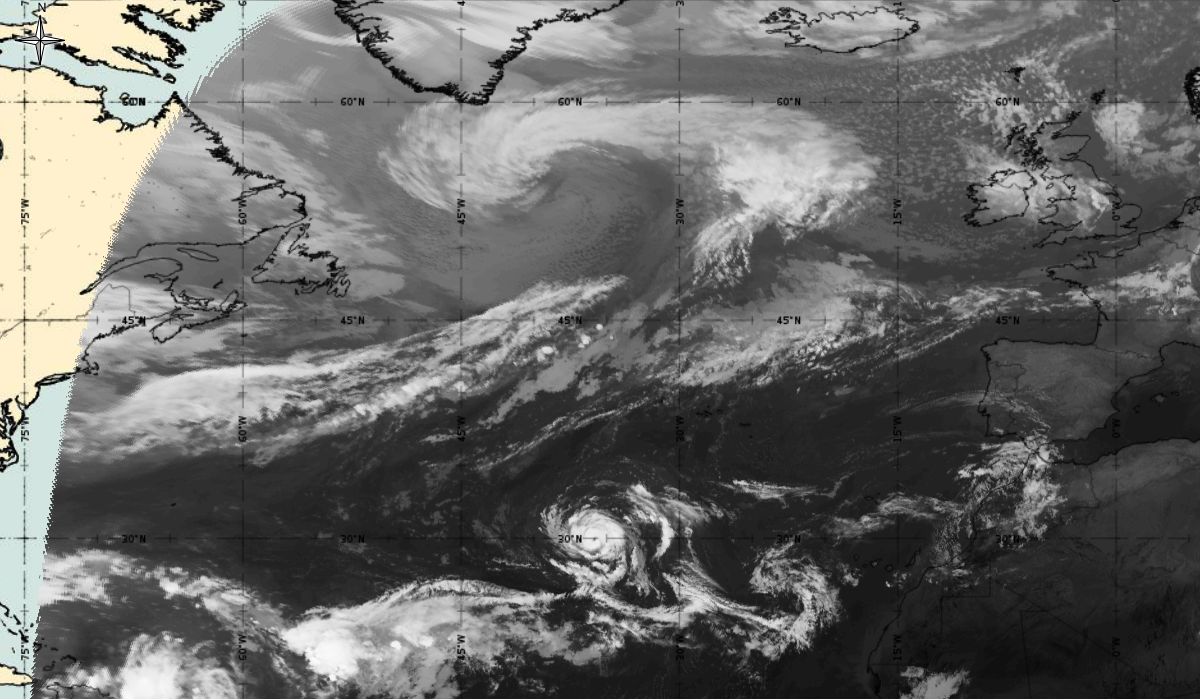
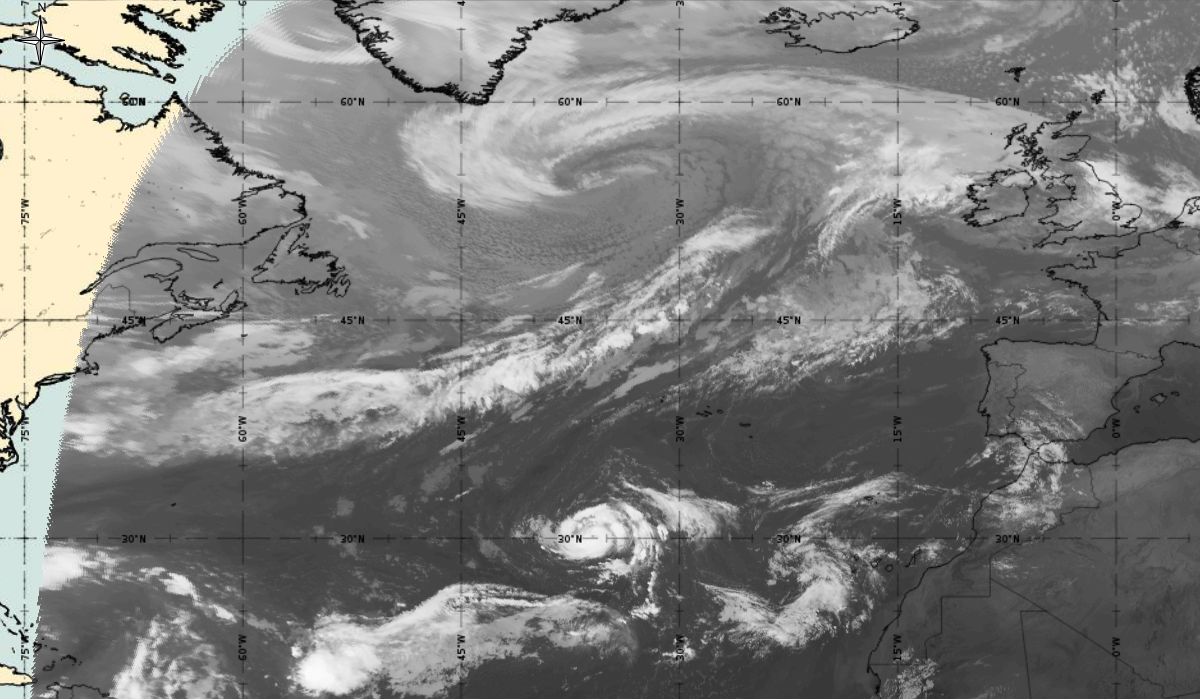
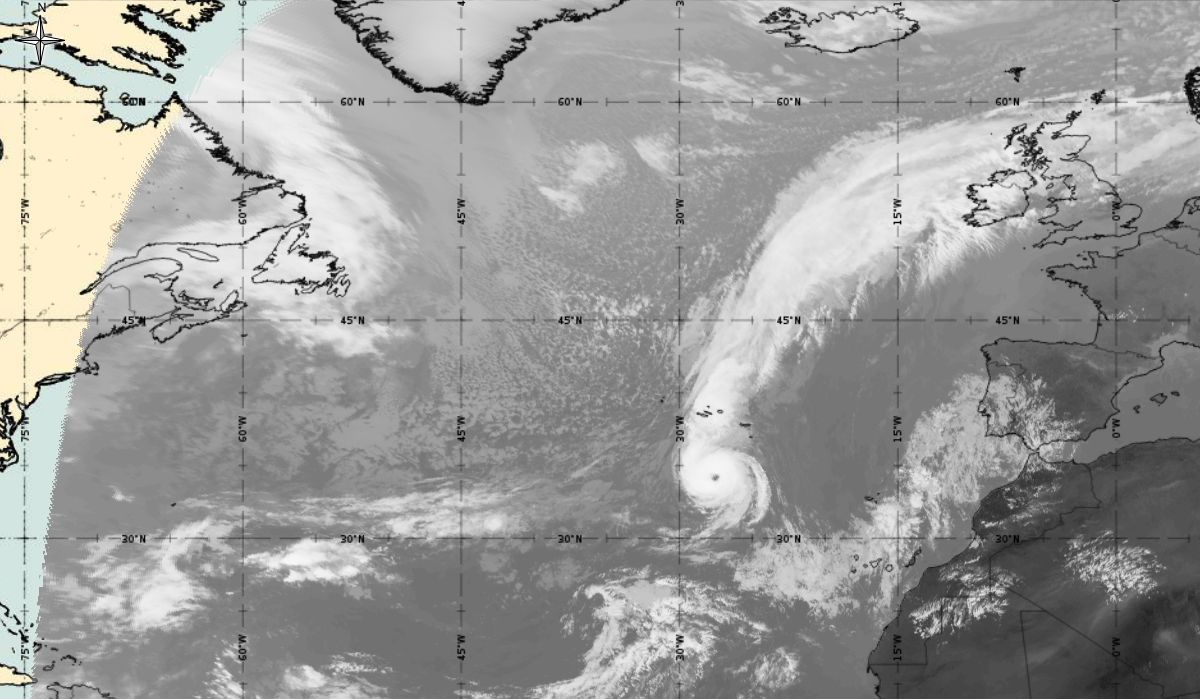
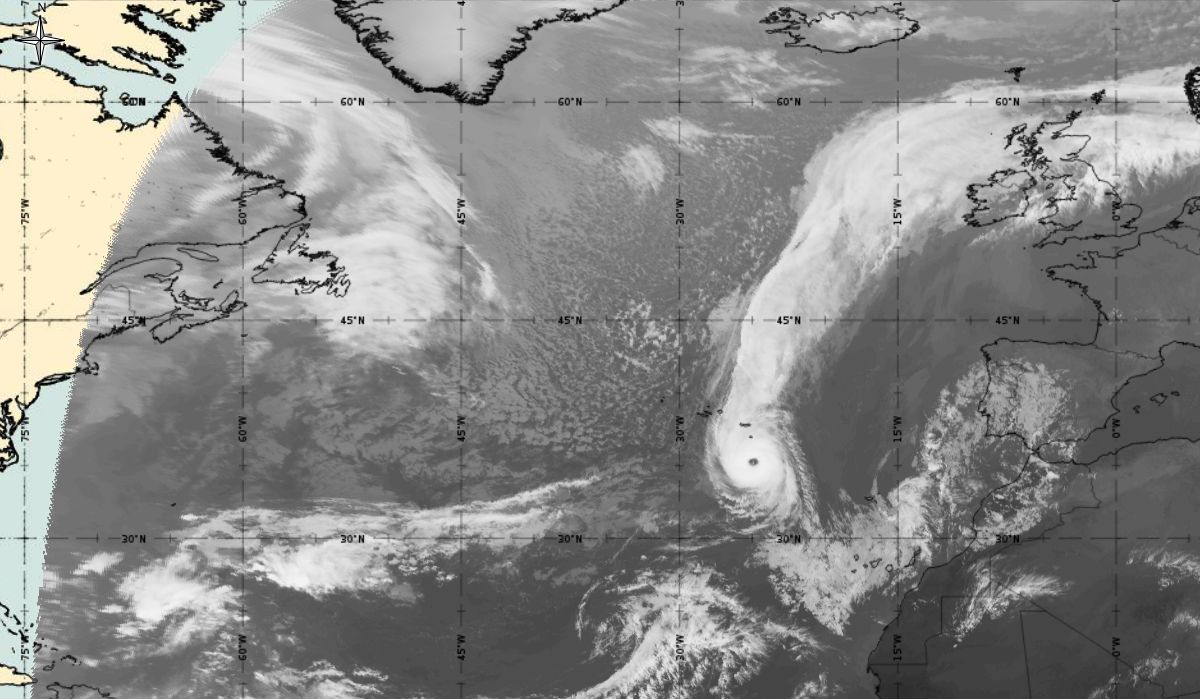
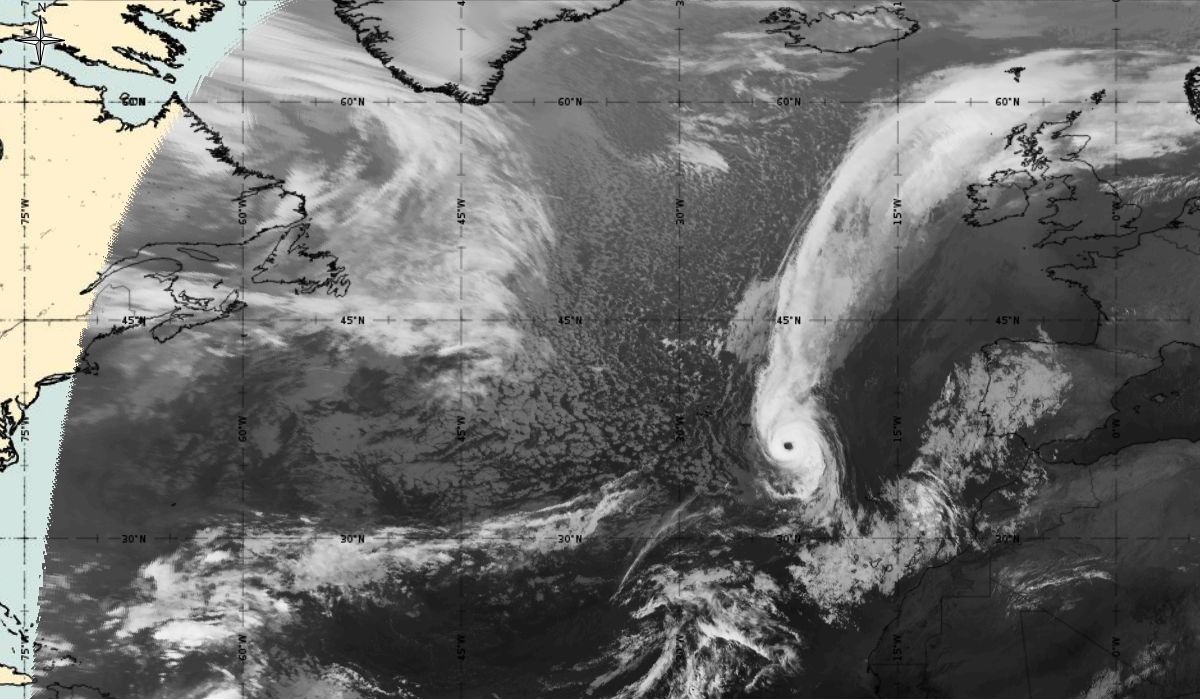
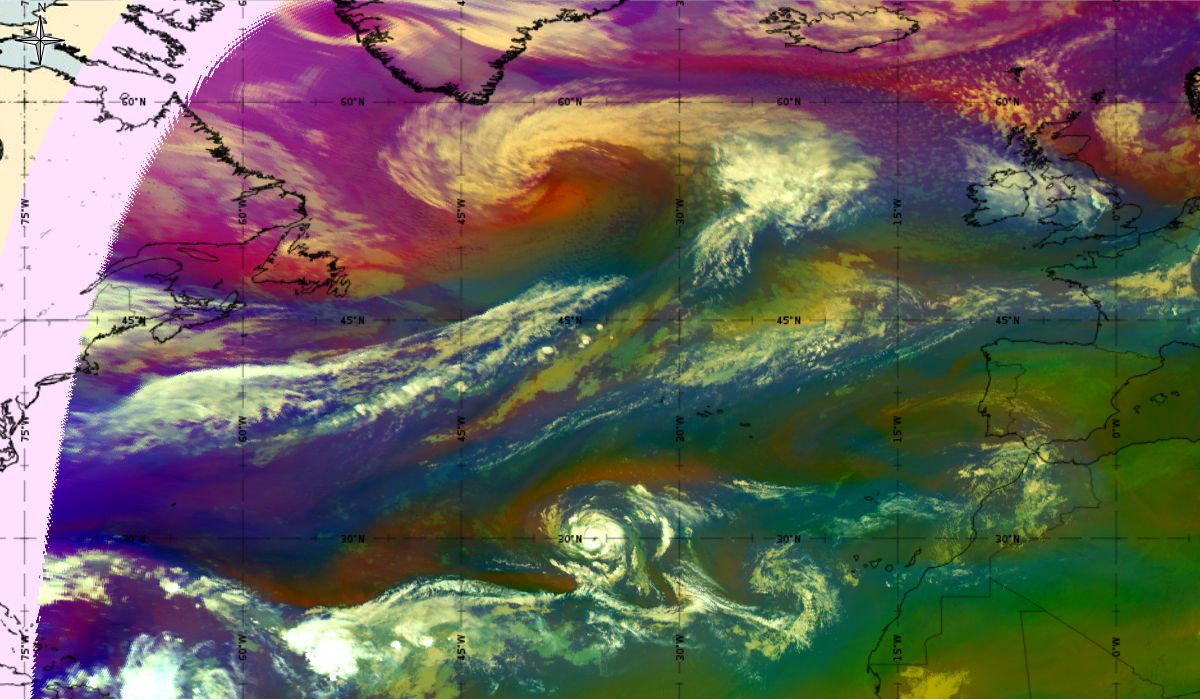
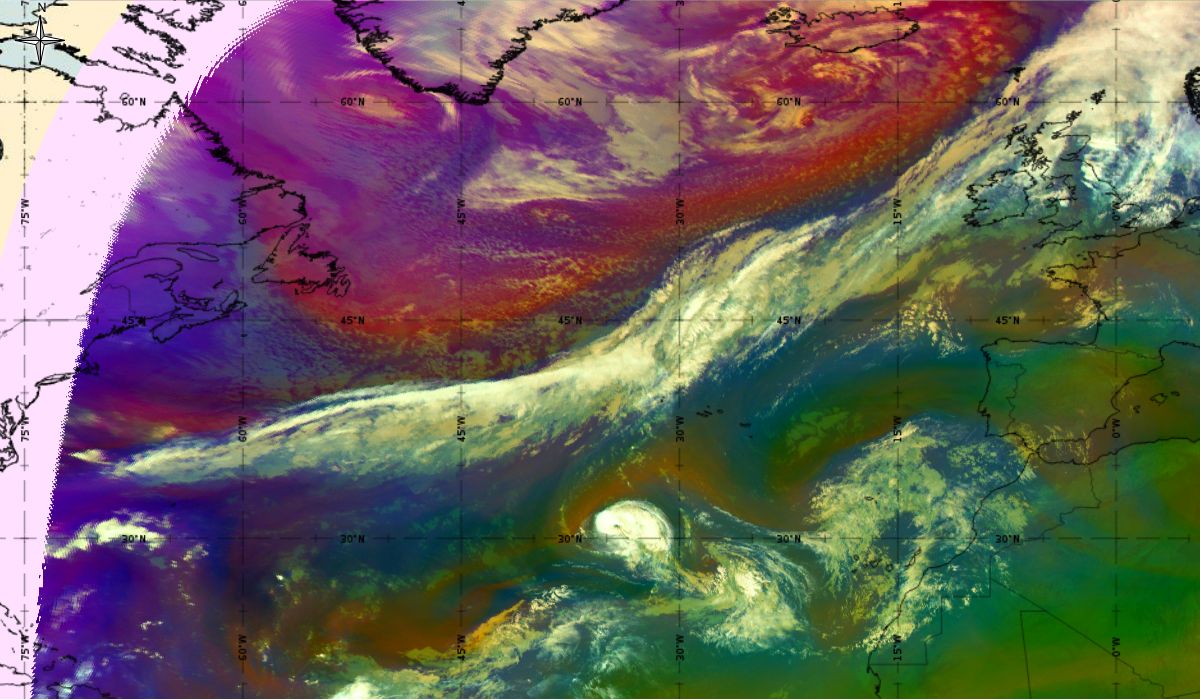
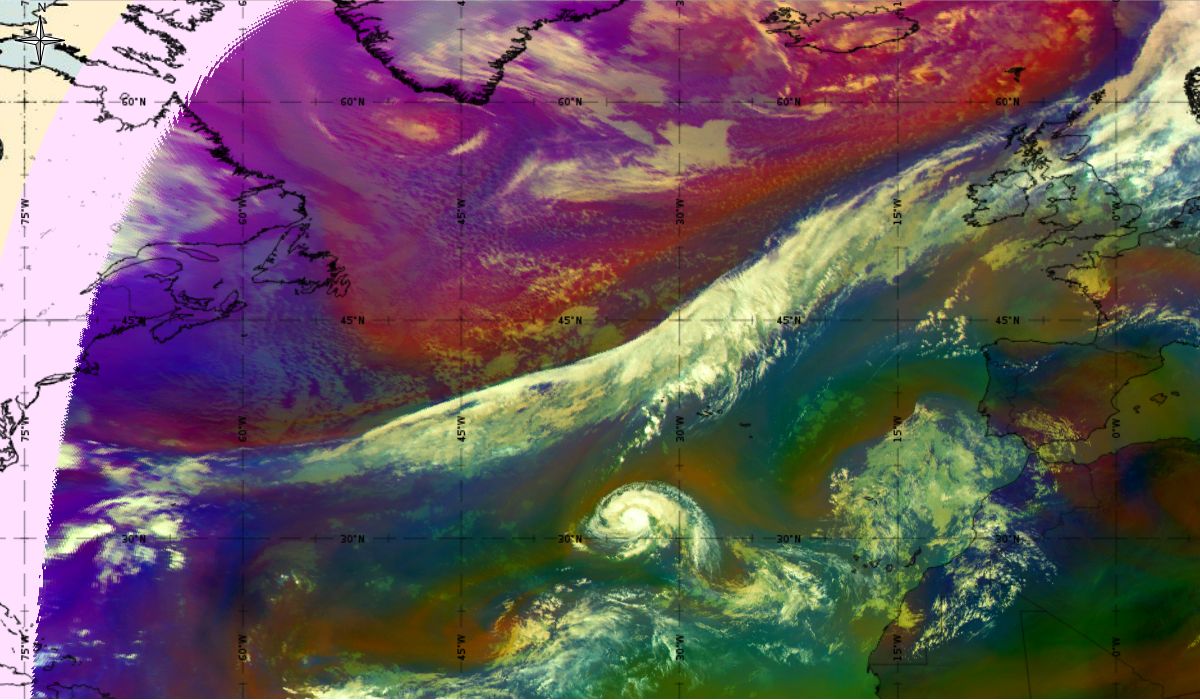
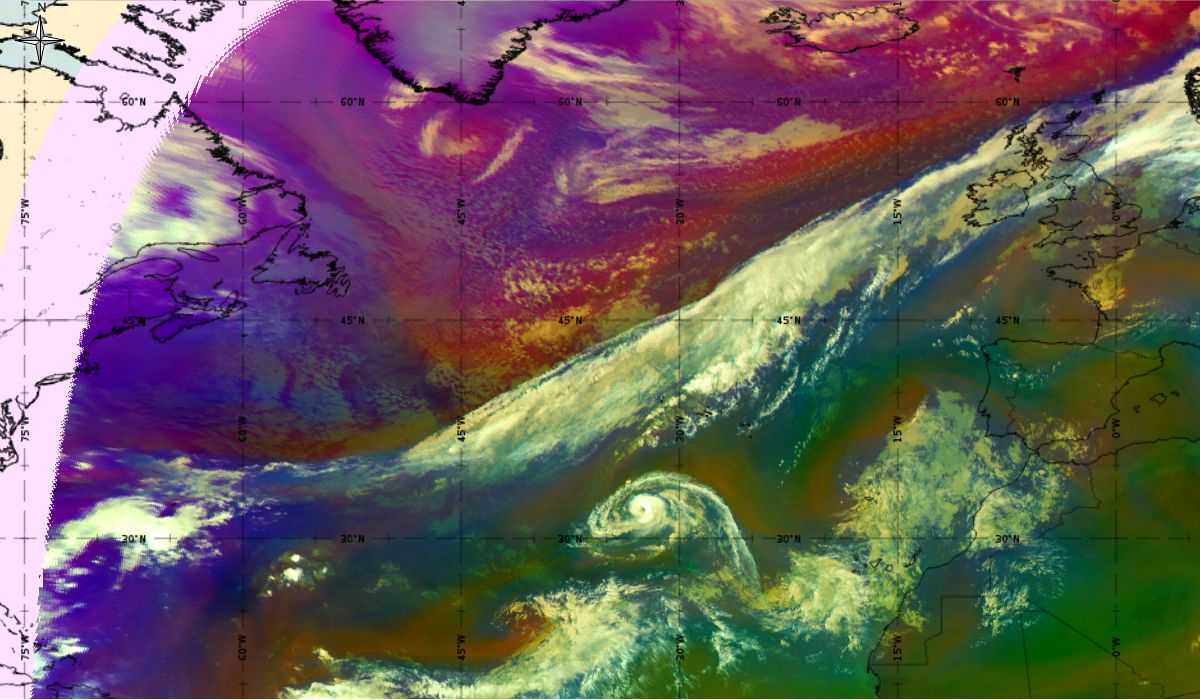
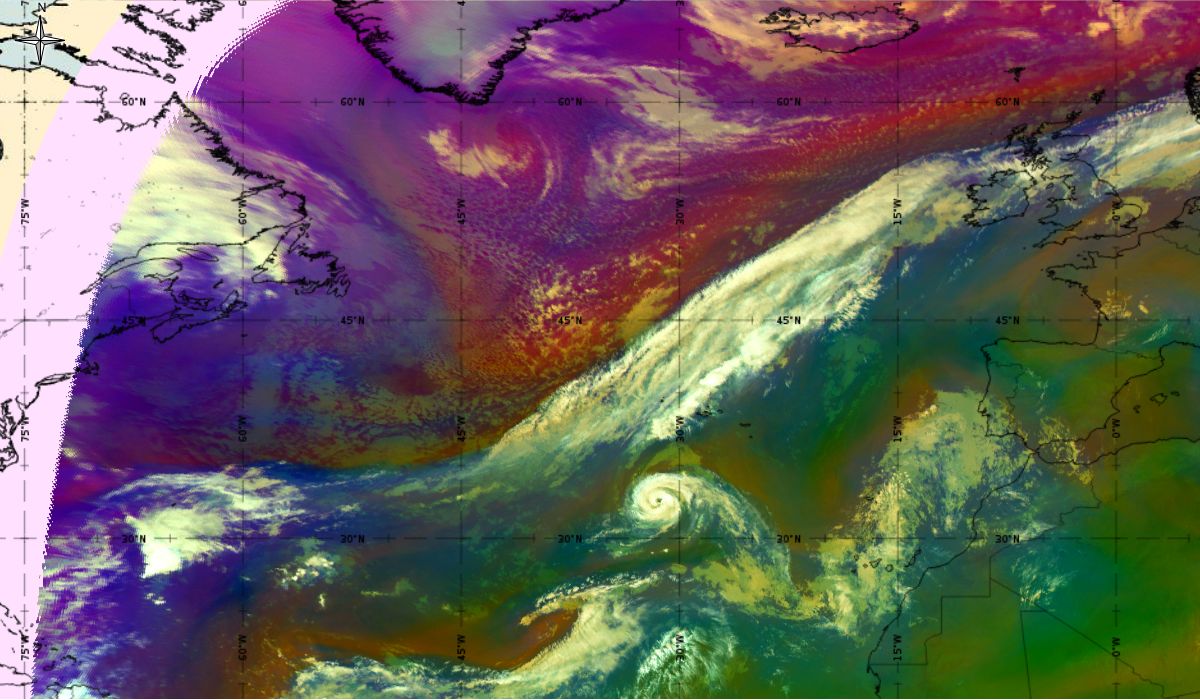
Loop 4 and 5: Meteosat 10 IR 10.8 and Airmass RGB animation from 11th October 2017, 18:00 UTC to 15th October 2017, 00:00 UTC (source: EUMeTrain, ePort)
Note: To go through individual images, click Loop 4 or
Loop 5
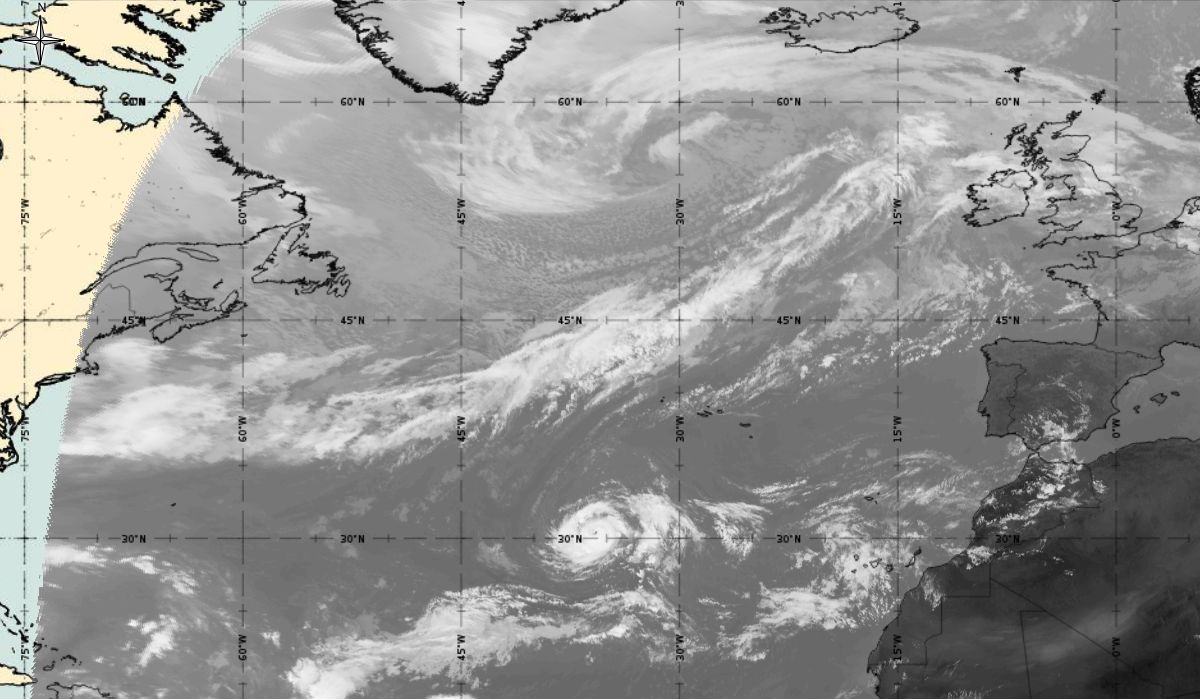
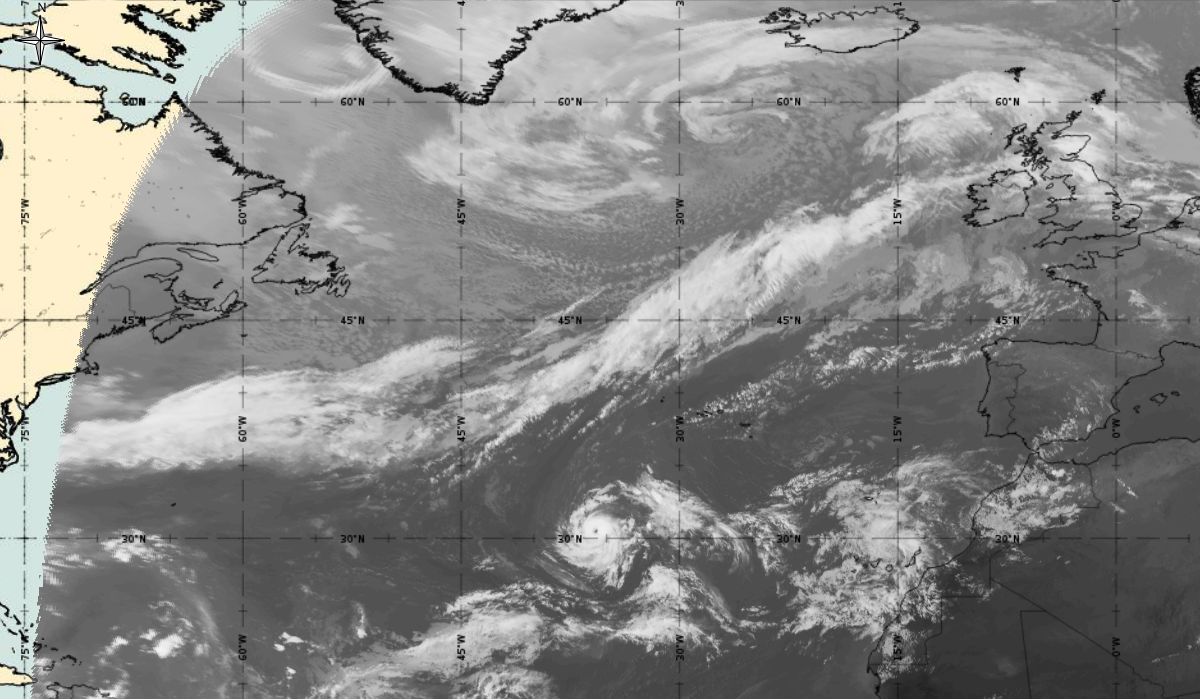
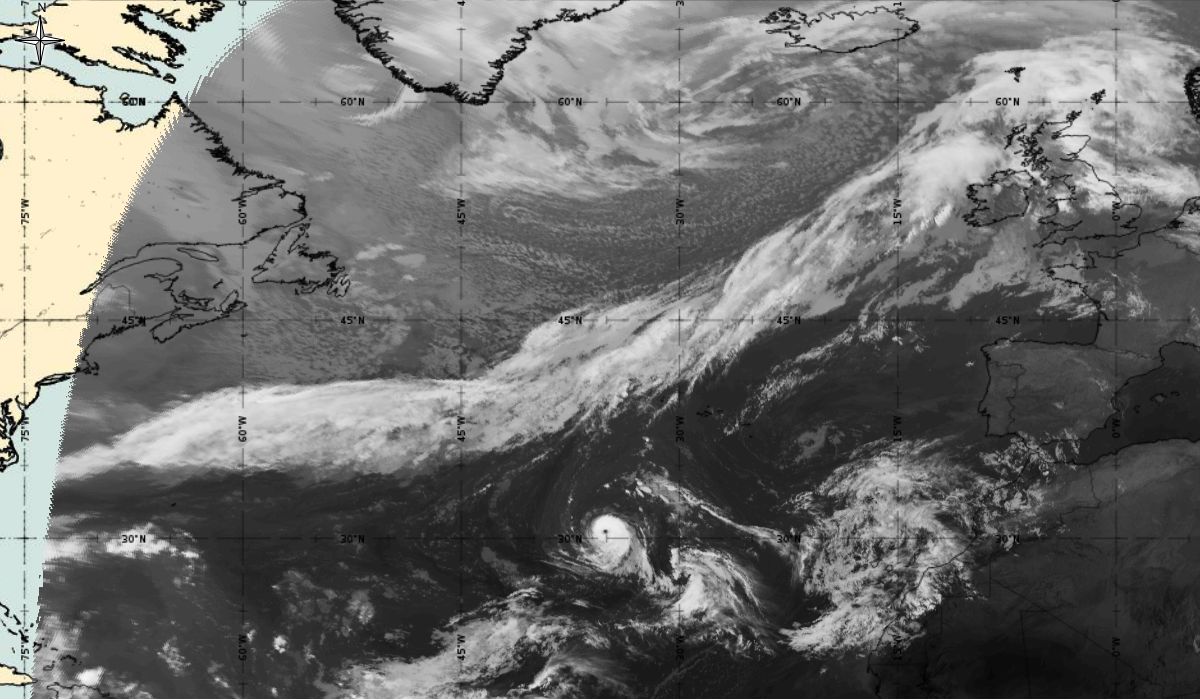
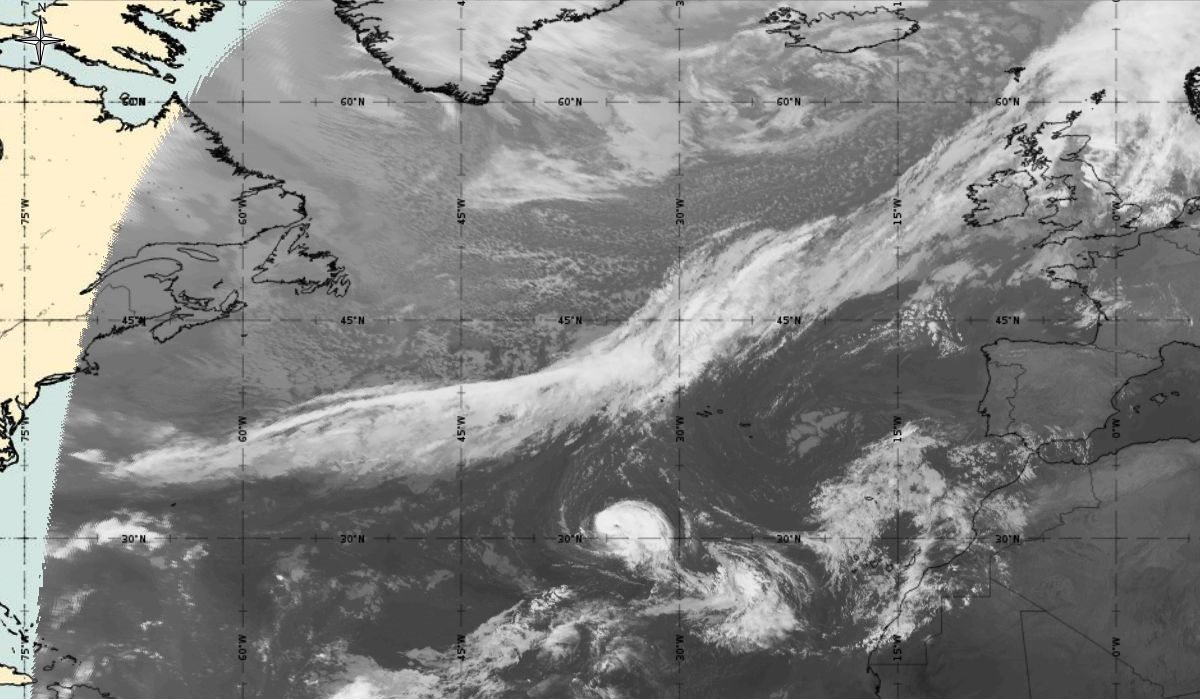
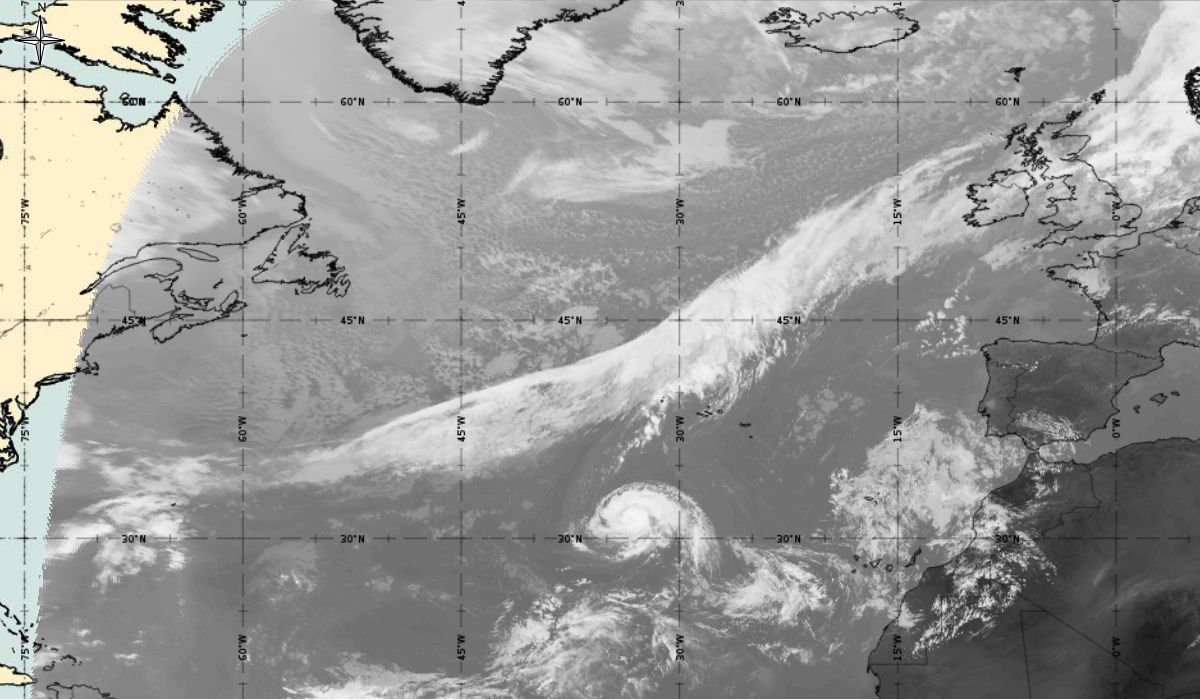
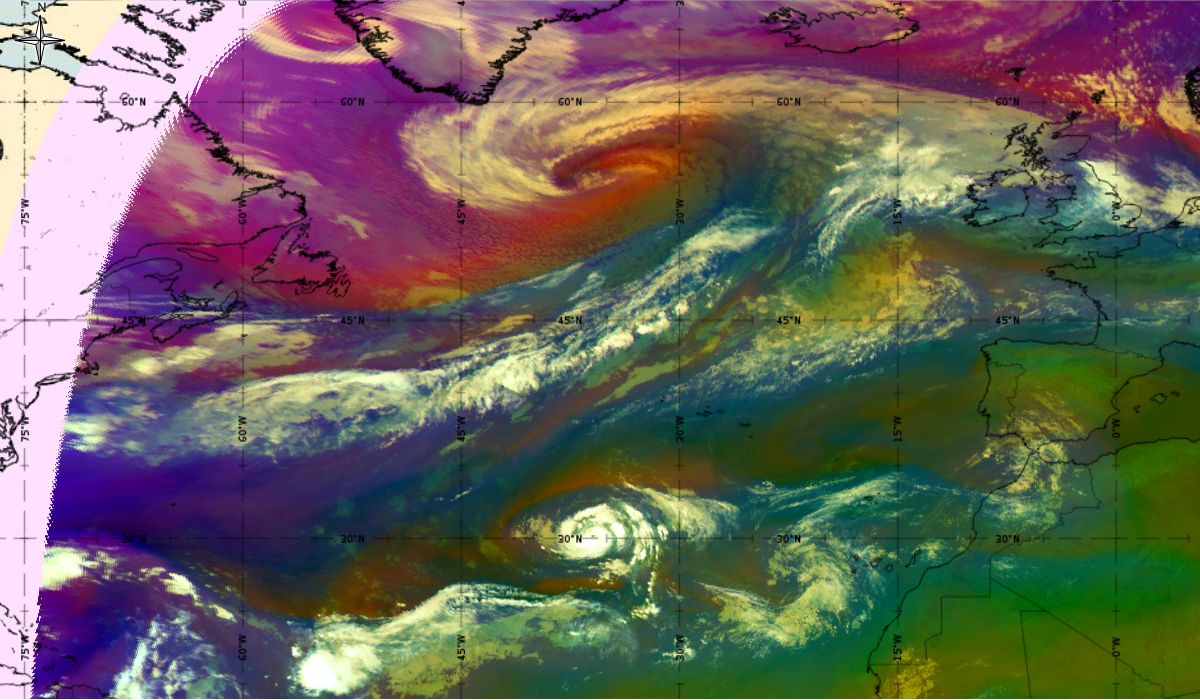
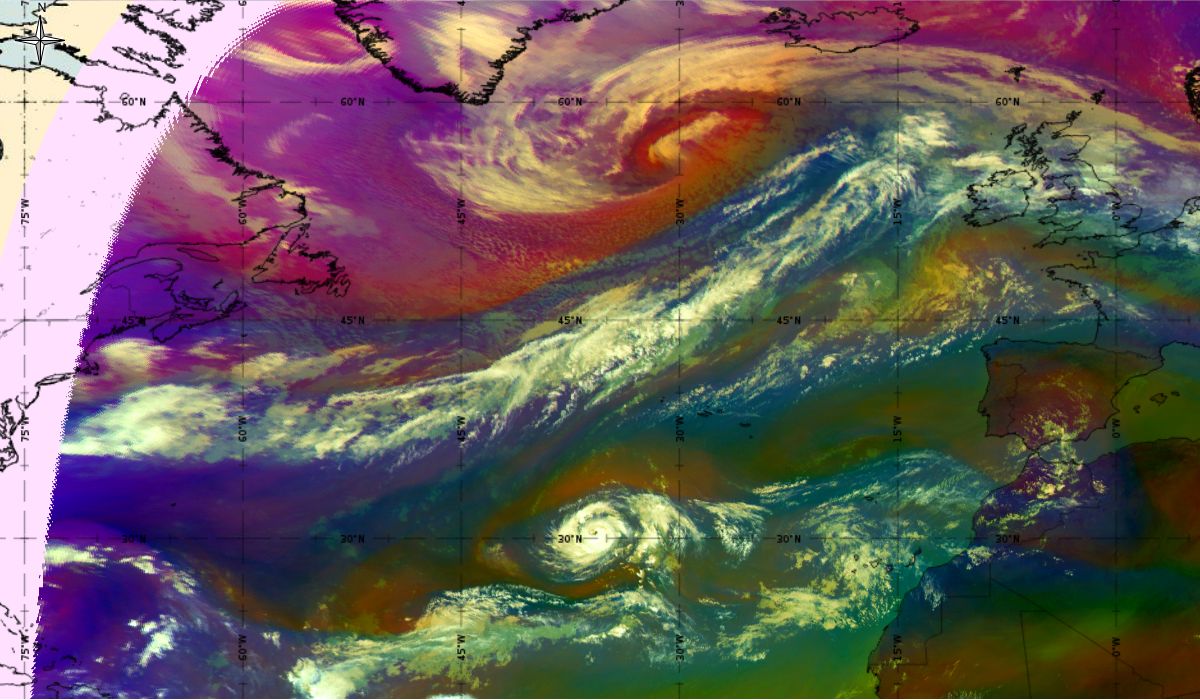
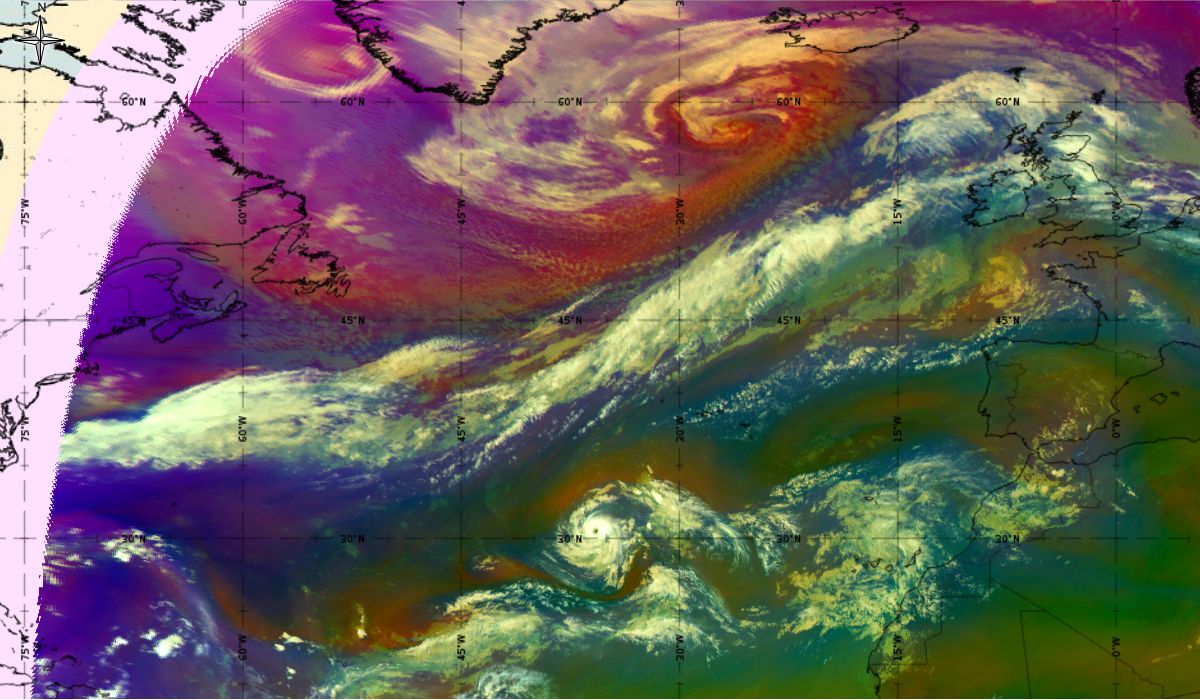
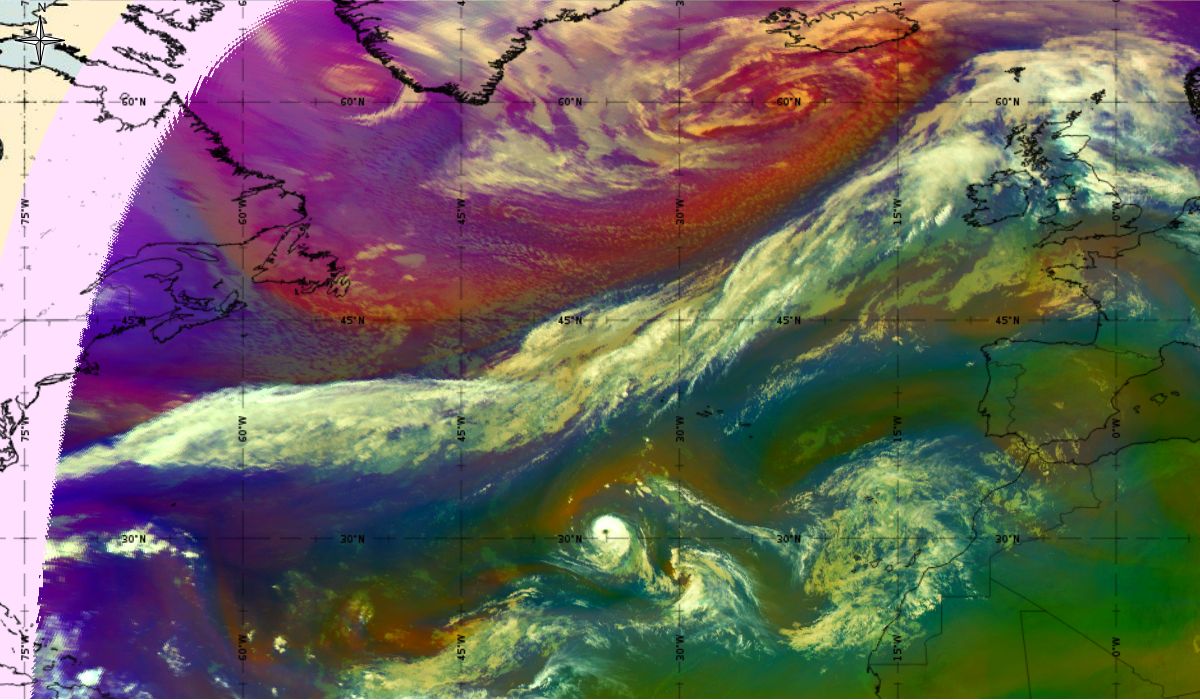
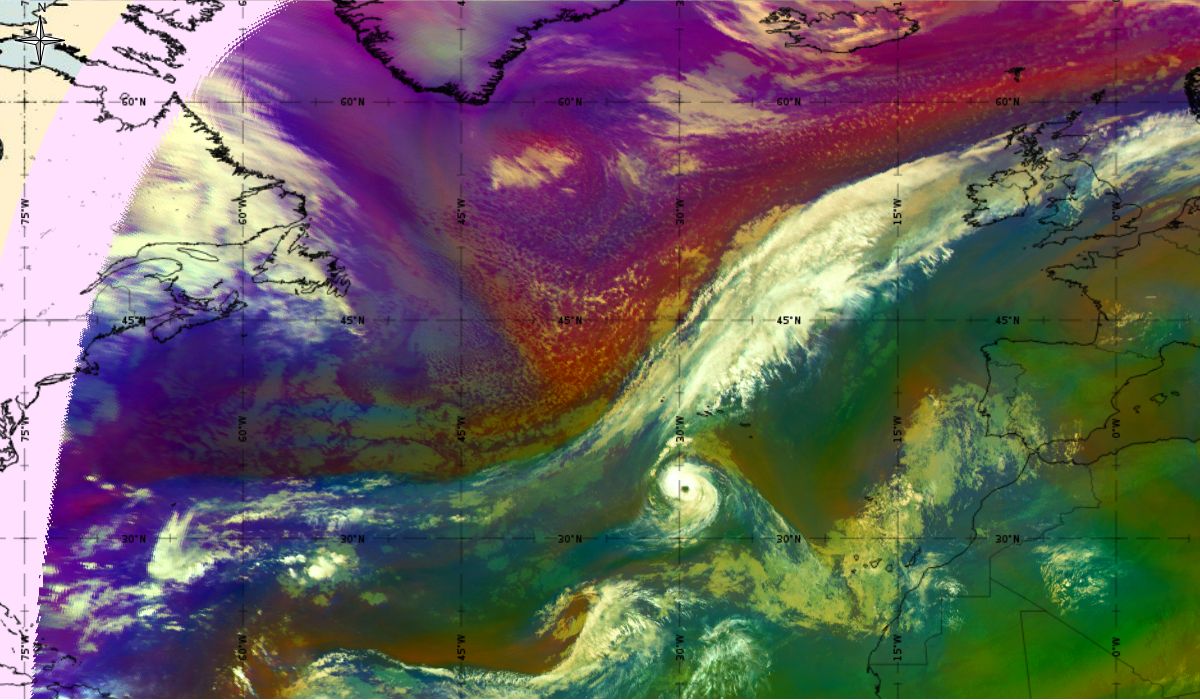
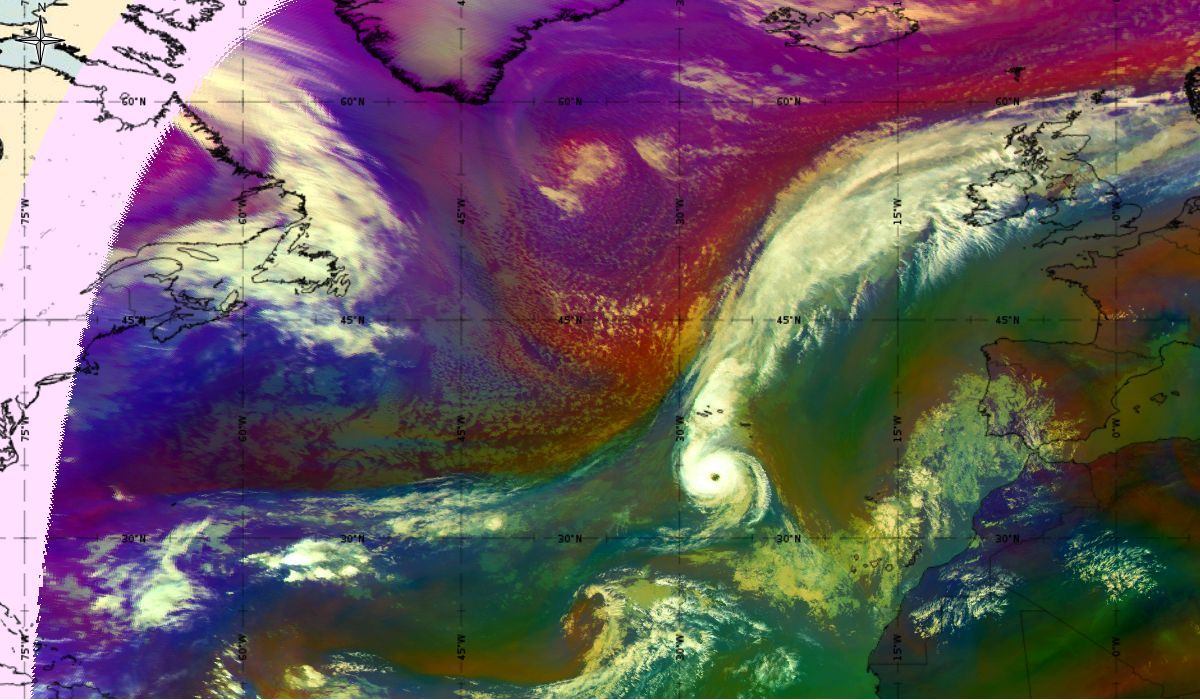
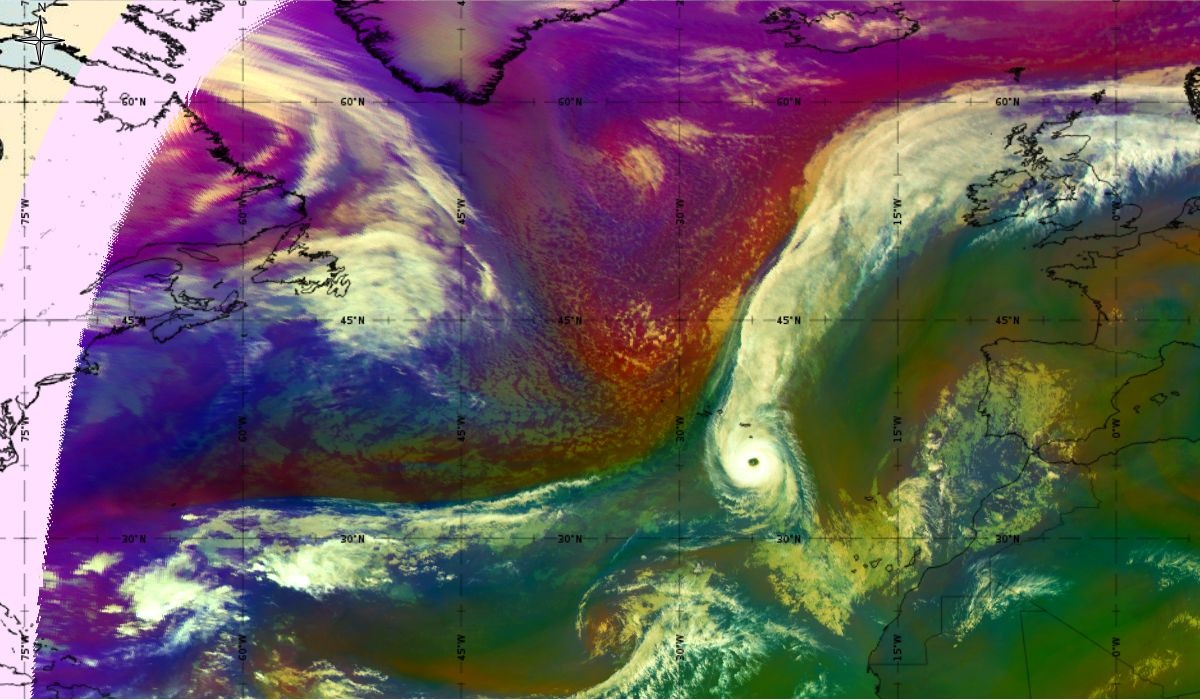
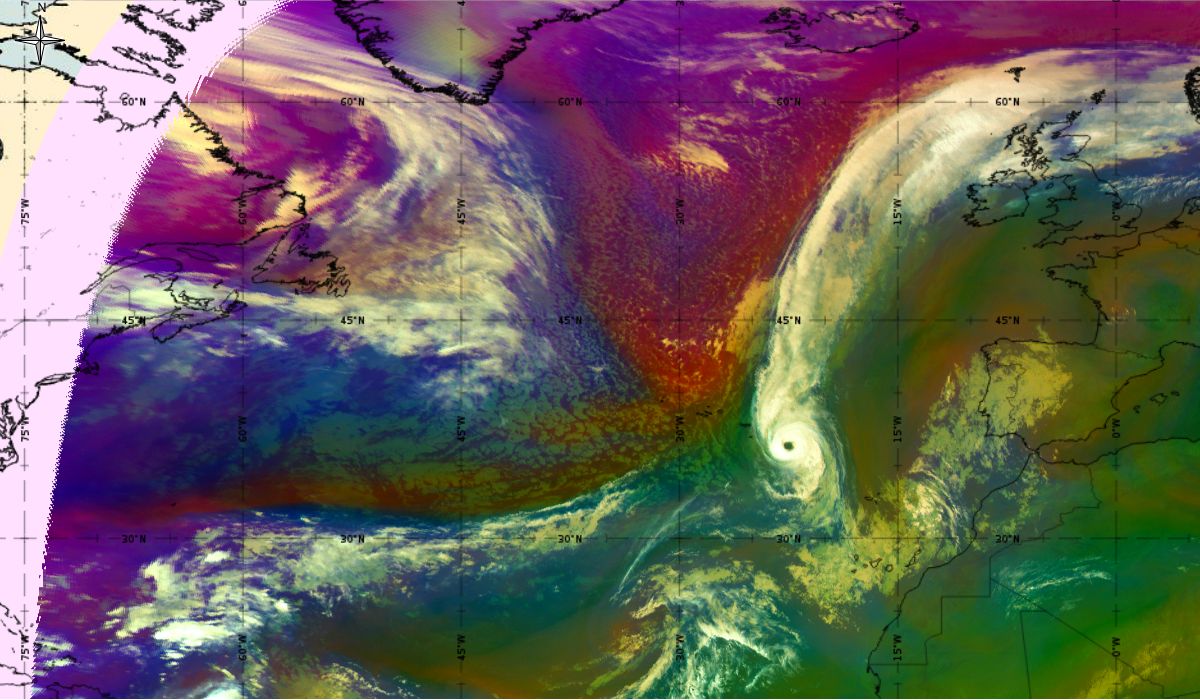
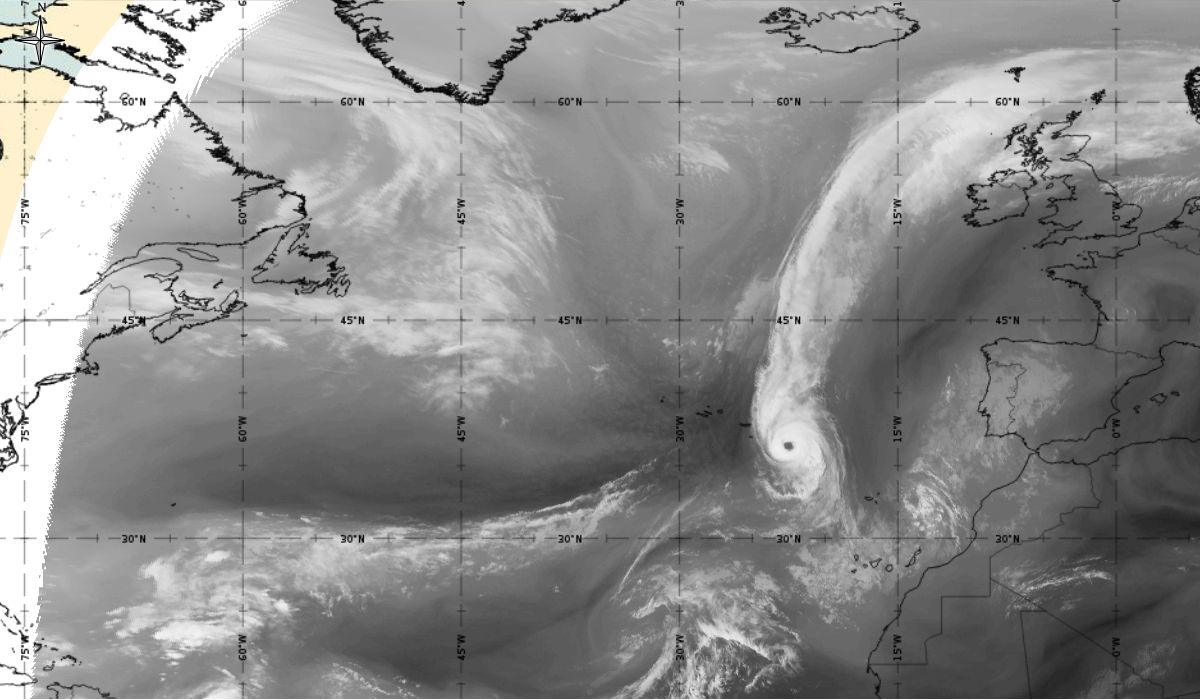
The path and evolution of hurricane Ophelia and a well-defined eye can be followed through Airmass RGB satellite images. The development occurred in the warm air masses (greenish colour) but attention should be focused on the colder air masses north of the pronounced cloud band and the jet (in the area of transition from blue to red colours at the rear side of the cloud band). After Ophelia reached its maximum strength (14th October 12:00 UTC), an interaction with a strong upper level trough (trough visible in red colour) and jet stream flow caused a gradual weakening of the hurricane.
Loop 6: Meteosat 10 WV 7.3 animation from 11th October 2017, 18:00 UTC to 15th October 2017, 00:00 UTC (source: EUMeTrain, ePort)
Note: To go through individual images click Loop 6!
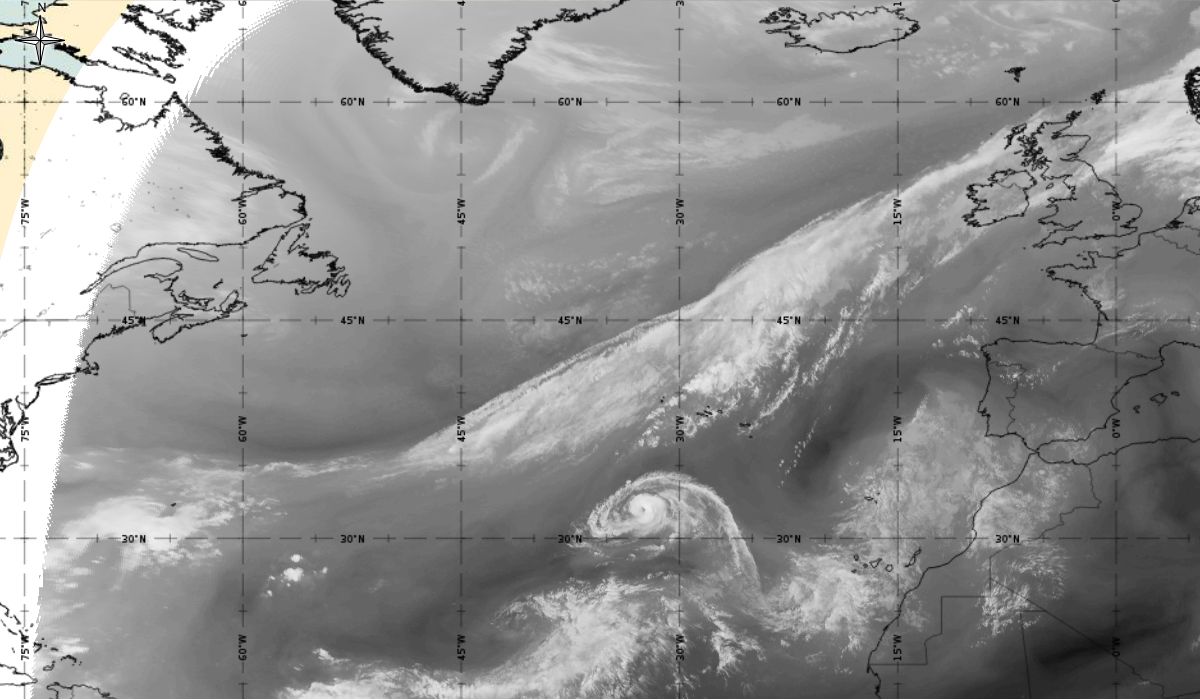
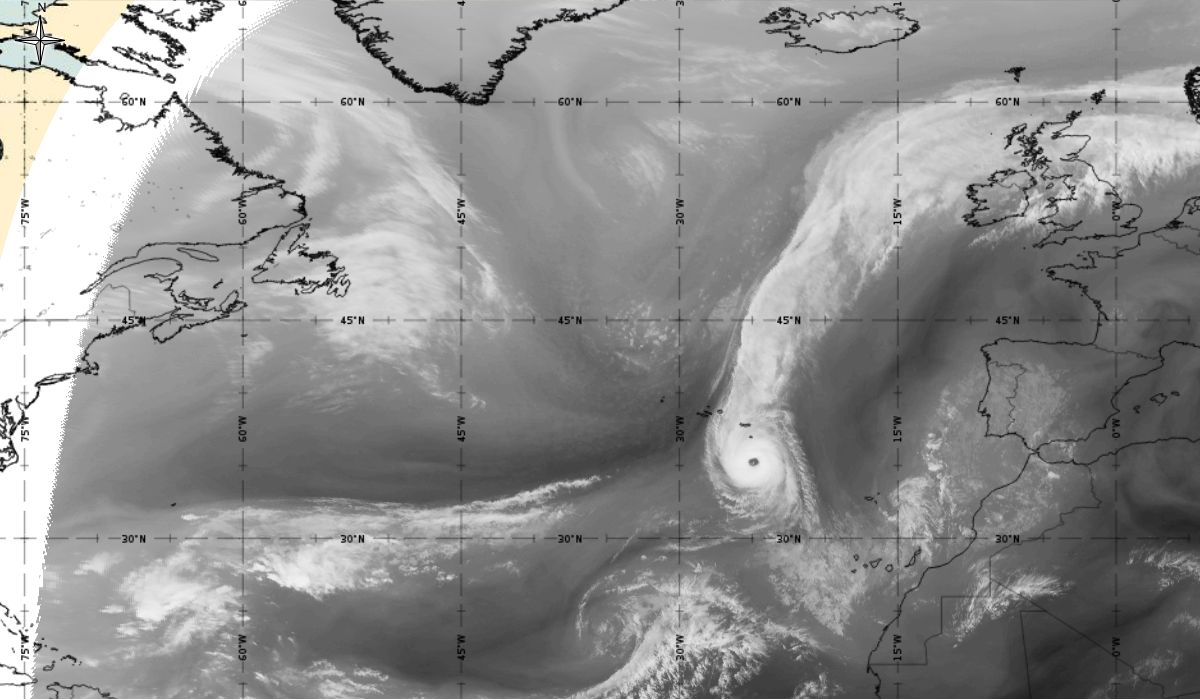
In the first 24 hours of the hurricane phase, the system is almost stationary but deepening. After that it was moving to the northeast with further development. The eye of the hurricane, a dark spot (dry area), can be followed in the cyclonic structure of thick, bright clouds (high water vapour content). The sharp, darker edge (especially notable when Ophelia reached its maximum on 14th October between 12:00 and 18:00 UTC) on the west side of the wide cloud system indicate a jet stream, which speeds up Ophelia to the northeast.
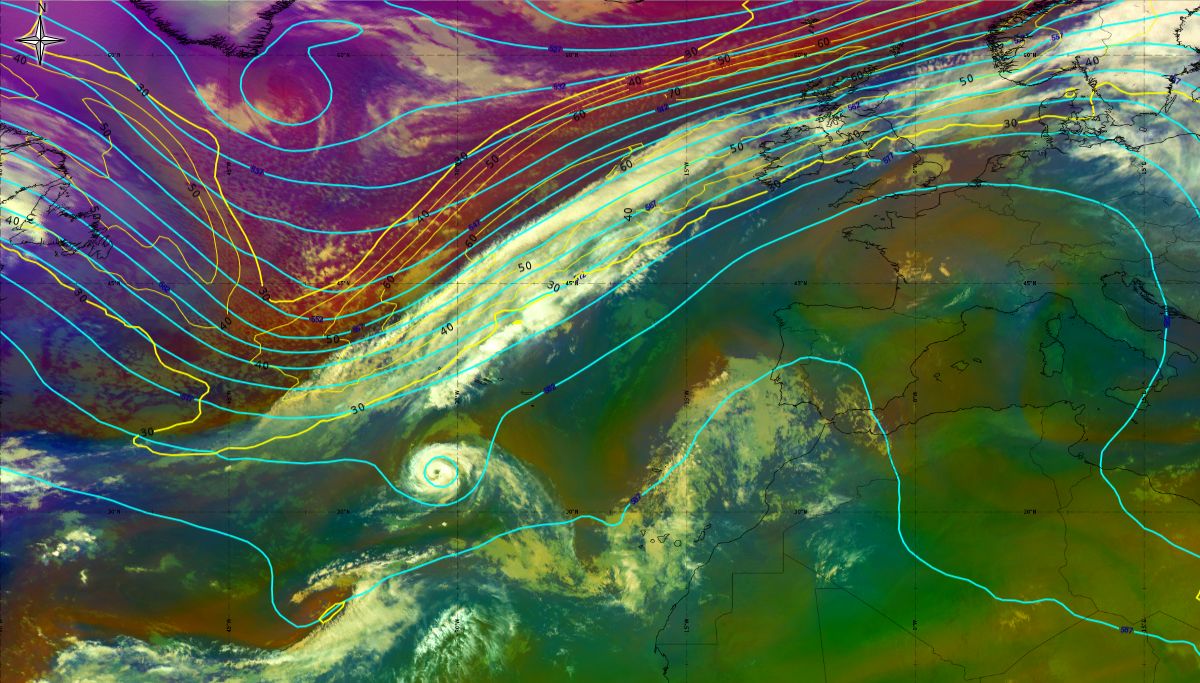
Tropical storm Ophelia was mostly stationary while steadily strengthening. It started to move slowly towards the southeast and became a Category 1 hurricane on the Saffir-Simpson scale after 18:00 UTC on 11th October 2017 (Figure 14.1 and 14.2). It was located 660 nautical miles (approx. 1200 km) southwest of the Azores (29.8 °N, 36.2 °W) with a wind speed of about 65 kt. The ASCAT data shows wind speed on the southwest part of the storm Figure 15.
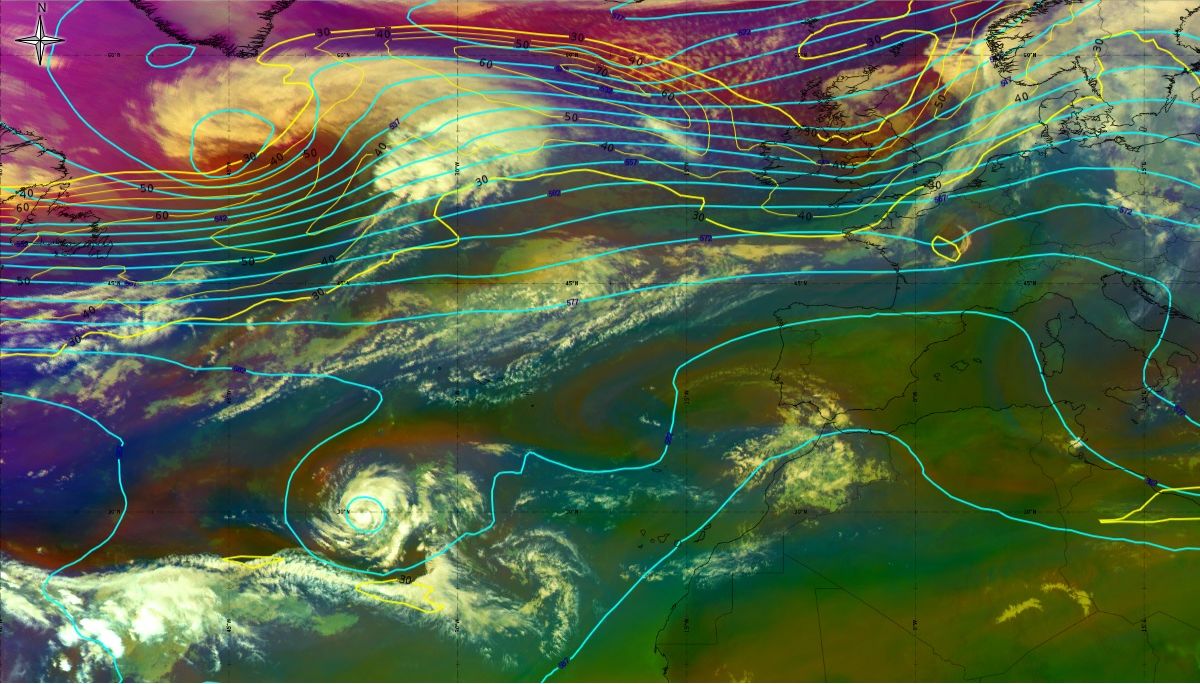
Figure 14-1: 11th October 2017 18:00 UTC - MSG Airmass RGB, geopotential height at 500 hPa (blue line), isotach at 300 hPa (yellow line - both ECMWF), source: EUMeTrain, ePort
Figure 14-2: 11th October 2017 18:00 UTC surface analyse, source DWD
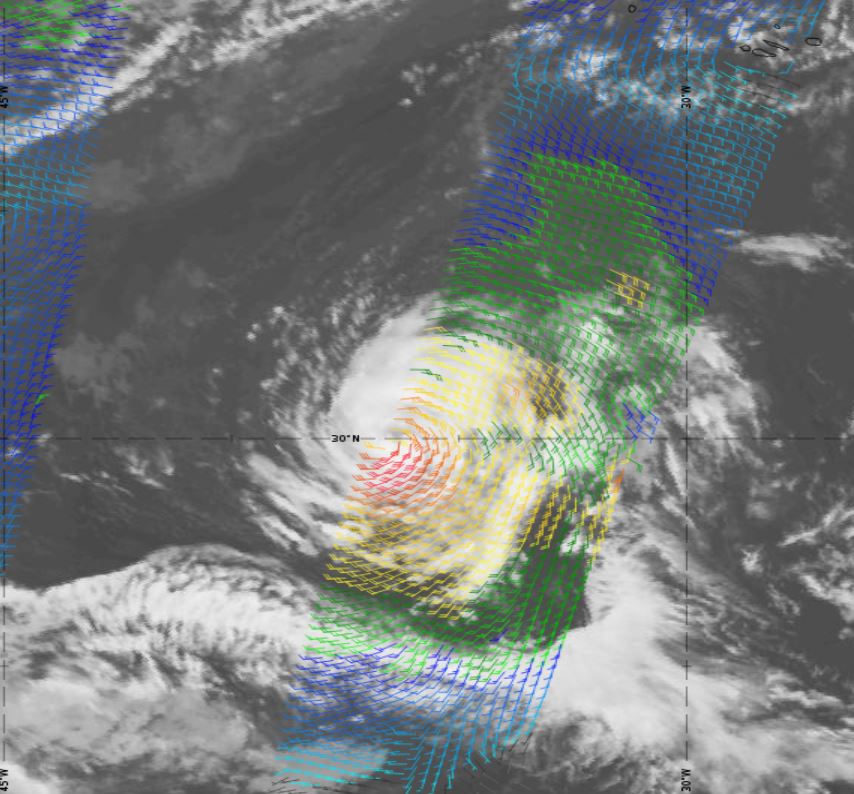
Figure 15: ASCAT wind (colour wind barbs) overlaid on Meteosat 10 IR 10.8 on 11th October 2017, 18:00 UTC (source: EUMeTrain, ePort) (click on the image to zoom in)
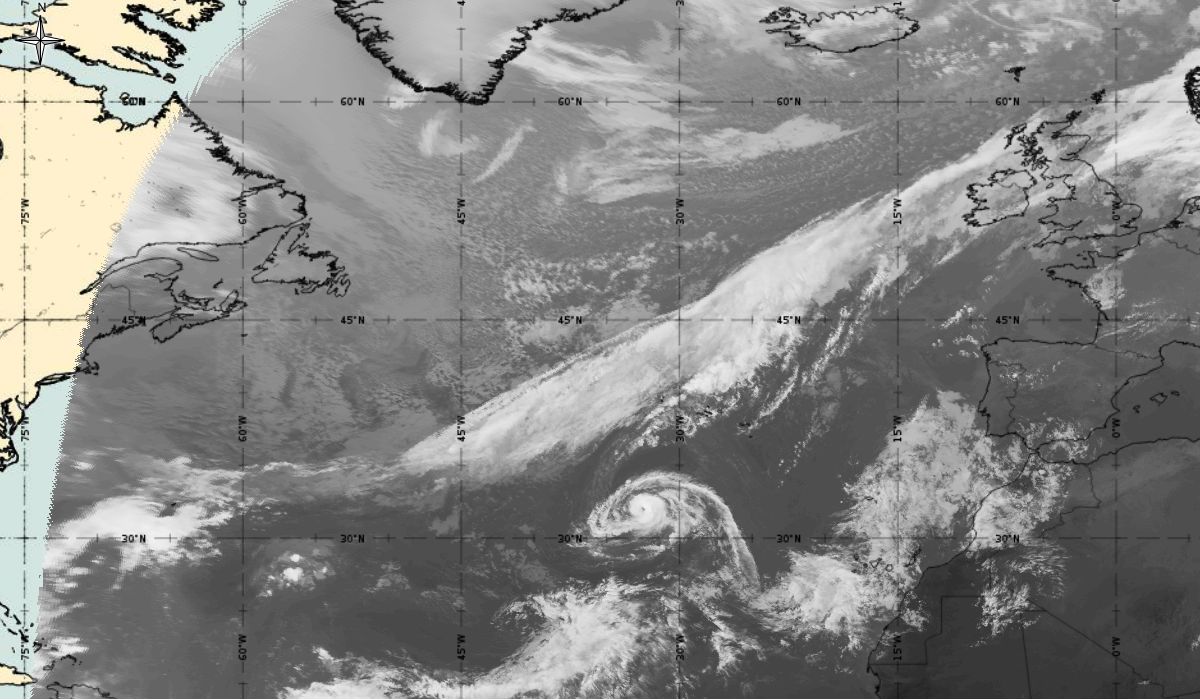
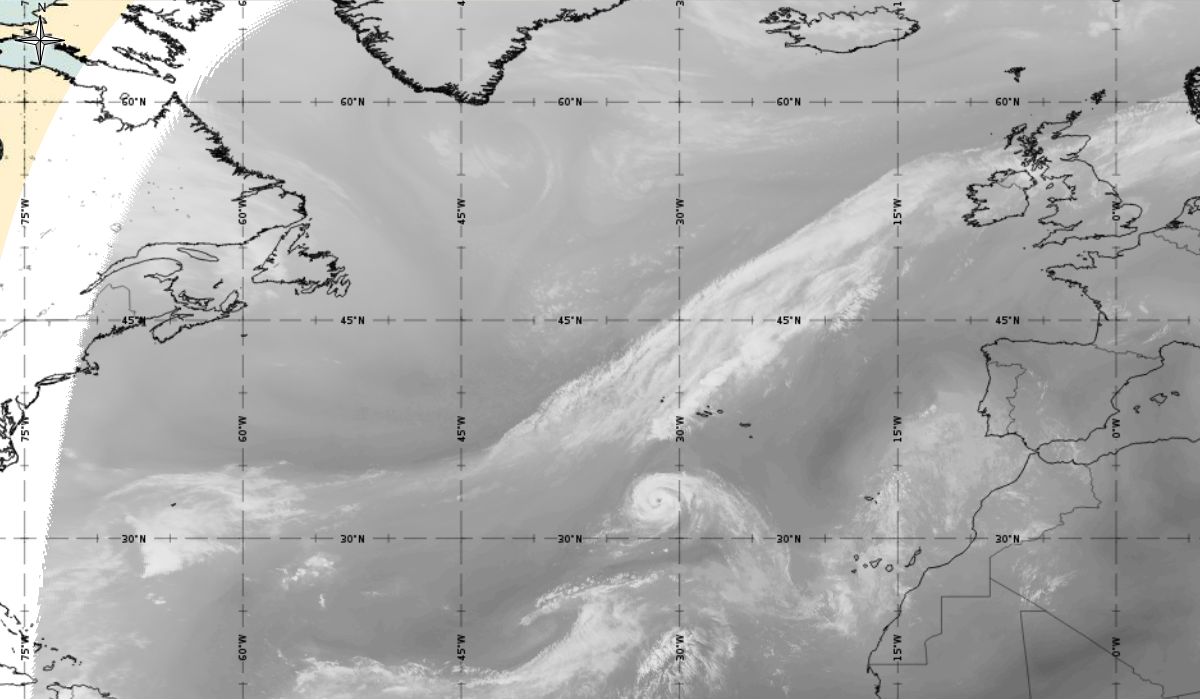
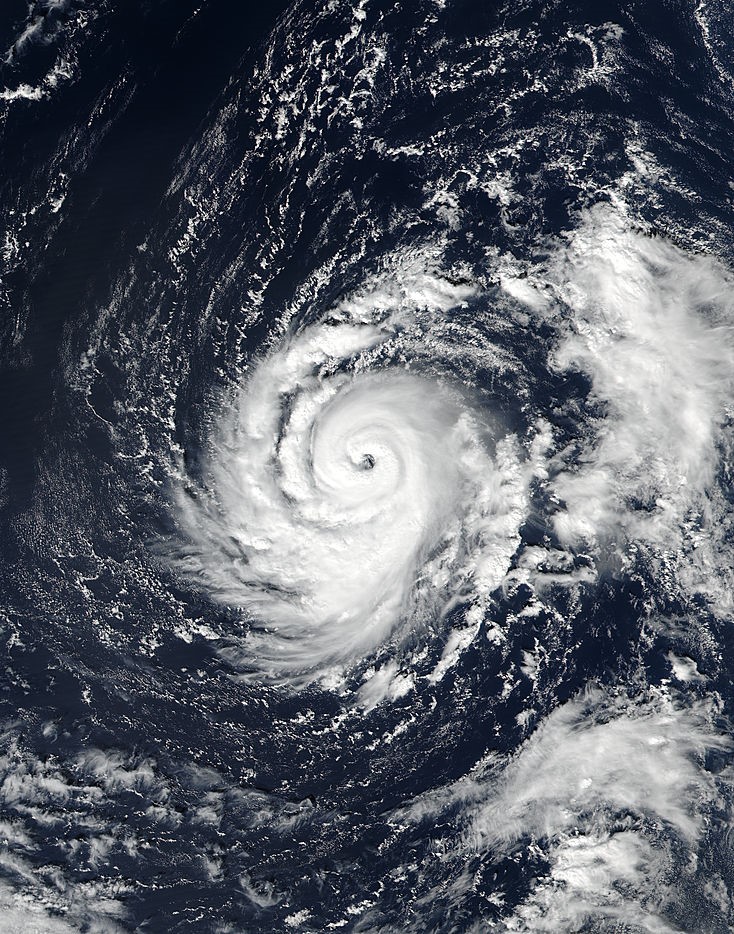
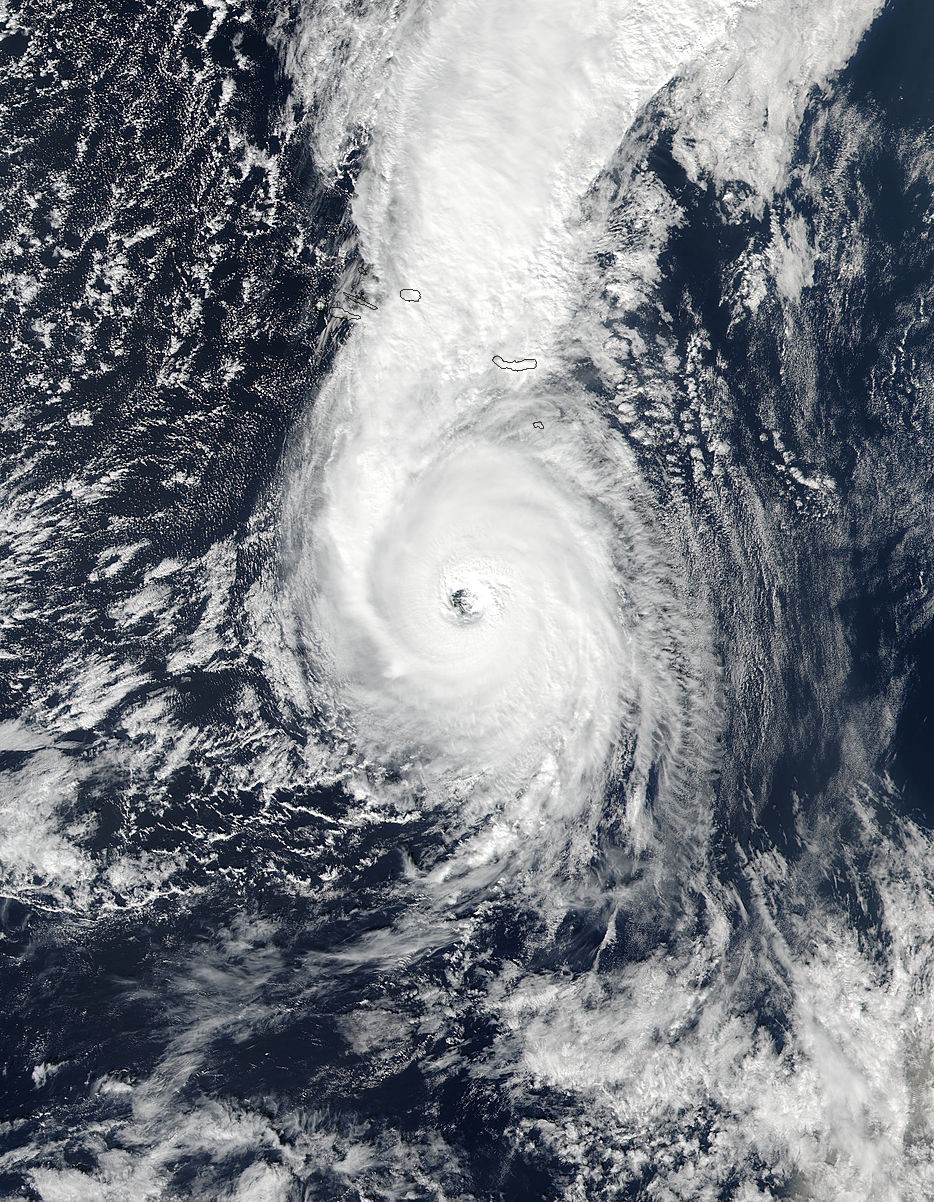
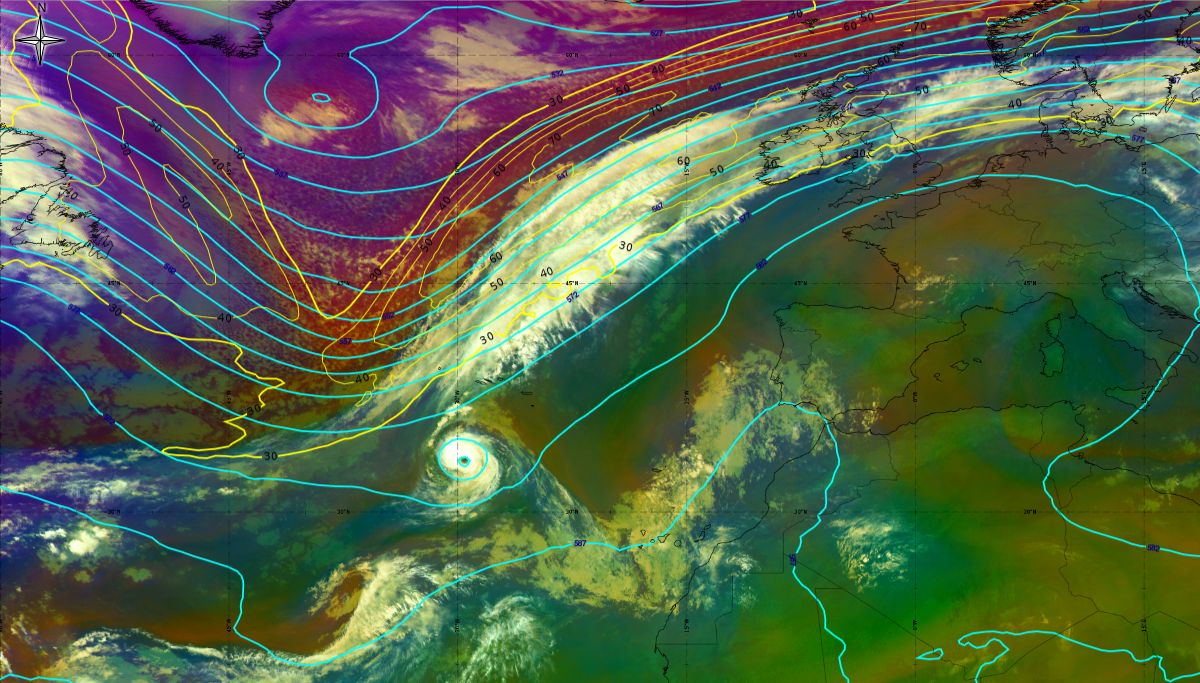
The favourable conditions for further development (SST, weak wind shear, conditional instability) were present, therefore, in the next 24 hours Ophelia strengthened to category 2 - MODIS satellite image. After another relatively stationary phase, Ophelia moved in a south-westerly flow, at the front of the trough approaching from the west (Figure 16.1 and 16.2). It was still moving through an area of low shear and this, combined with cooler than normal upper level temperatures, helped to maintain convection around the eye of the hurricane.
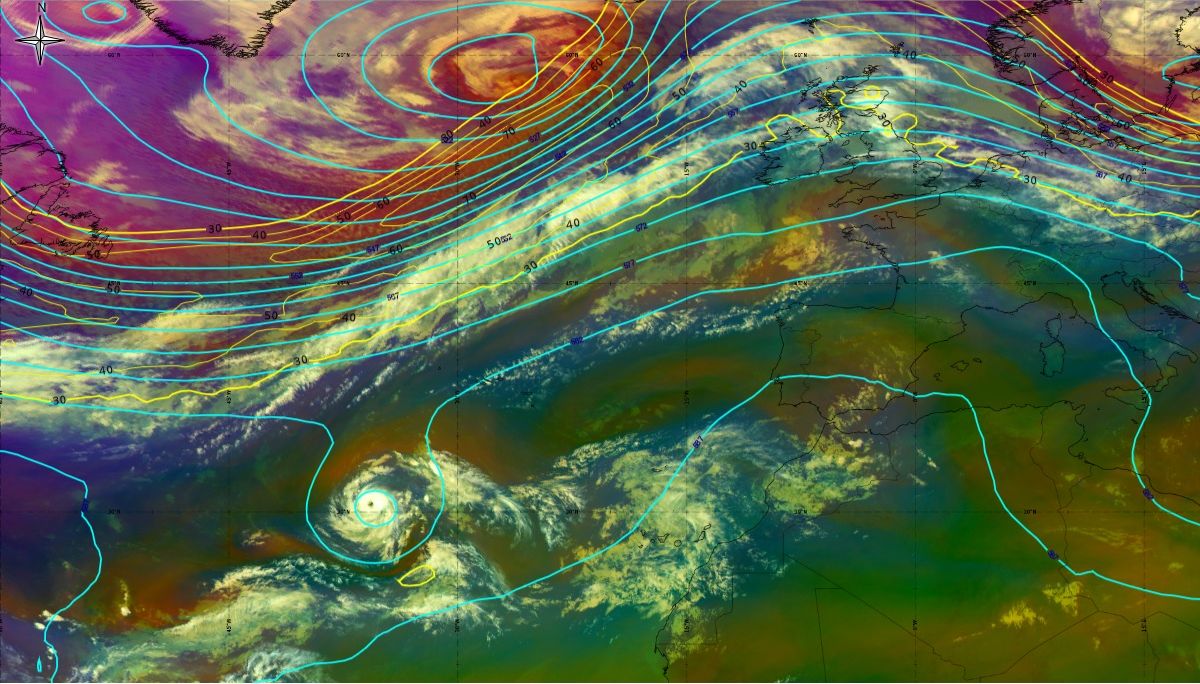
Figure 16-1: 12th October 2017 18:00 UTC - MSG Airmass RGB, geopotential height at 500 hPa (blue line), isotach at 300 hPa (yellow line - both ECMWF), source: EUMeTrain, ePort
Figure 16-2: 12th October 2017 18:00 UTC surface analyse, source DWD
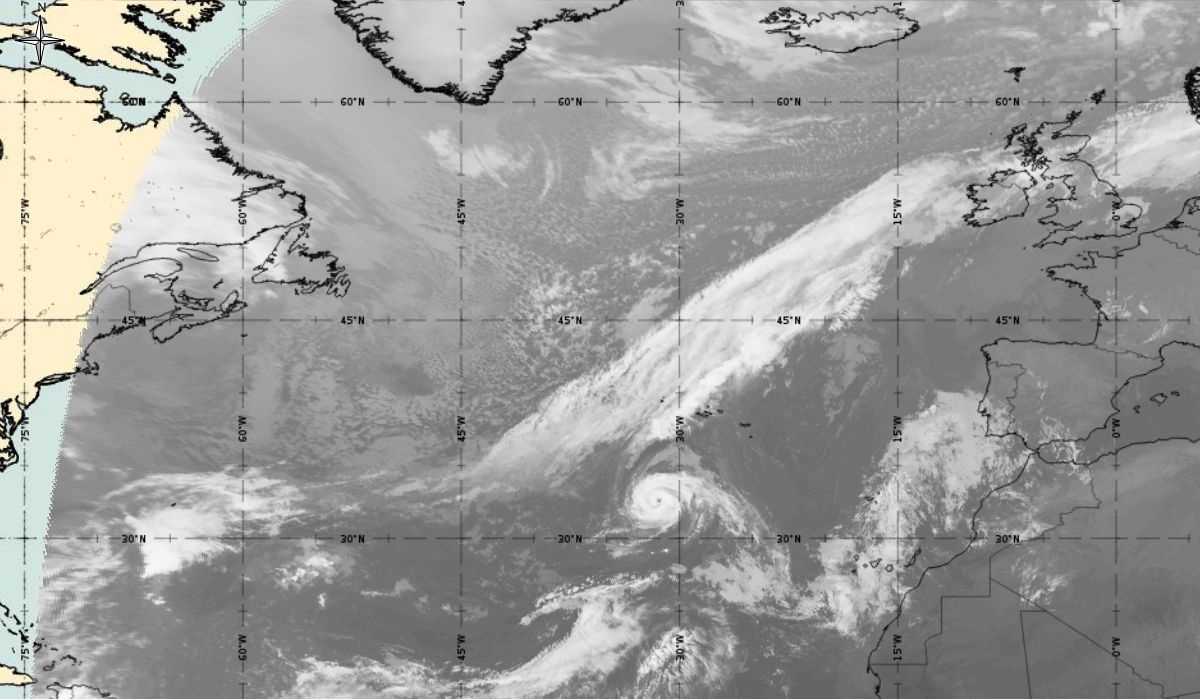
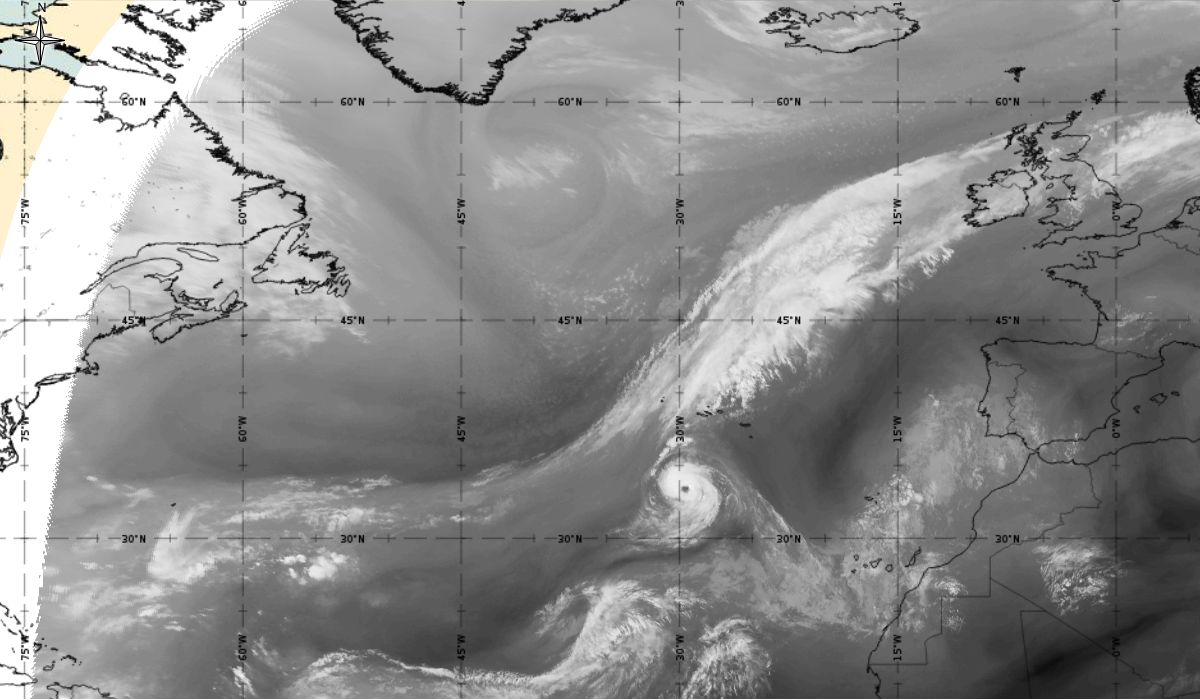
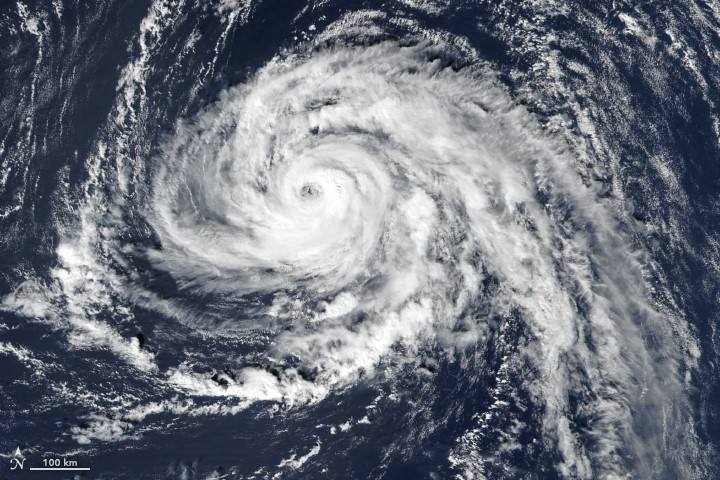
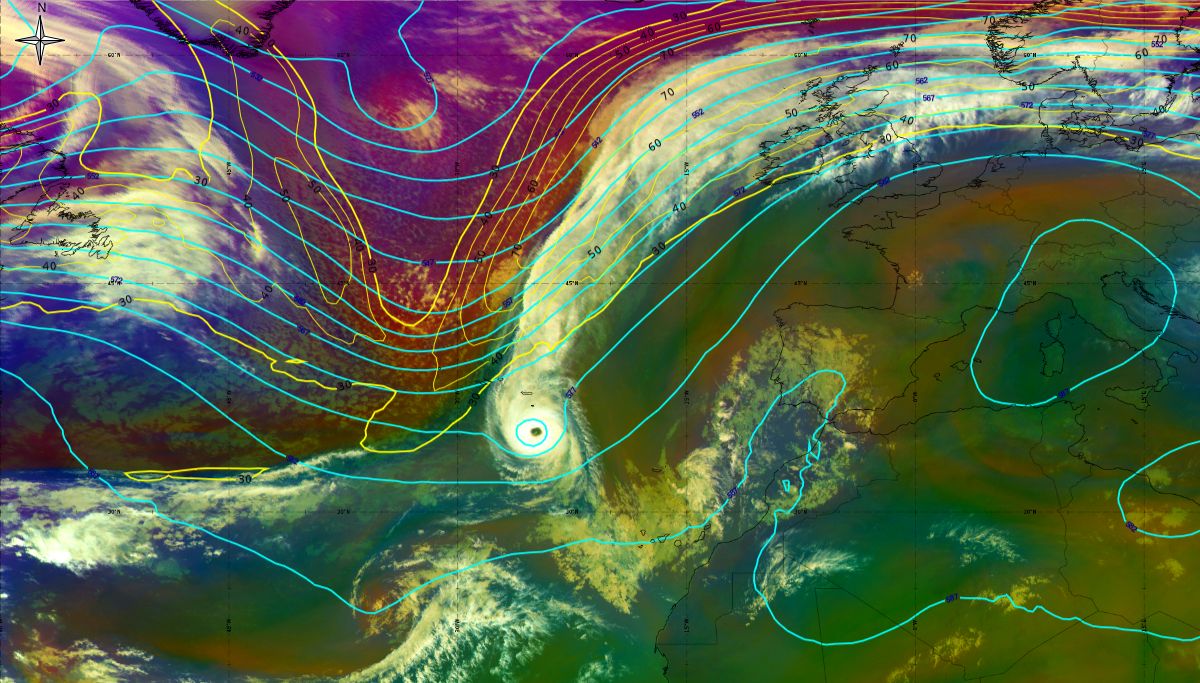
Ophelia moved slowly towards the northeast in the south-westerly flow. Due to another episode of decreasing of wind shear, and despite moving over relatively cooler sea surface temperatures (less than 26 °C), there was a new strengthening phase with Ophelia becoming a Category 3 hurricane on 14th October 12:00 UTC, when it was located 500 nautical miles (about 920 km) southwest of the Azores (Figure 17.1 and 17.2). Wind speed reached its highest peak intensity of 100 kt by the 15th October and lasted for 6 hours.
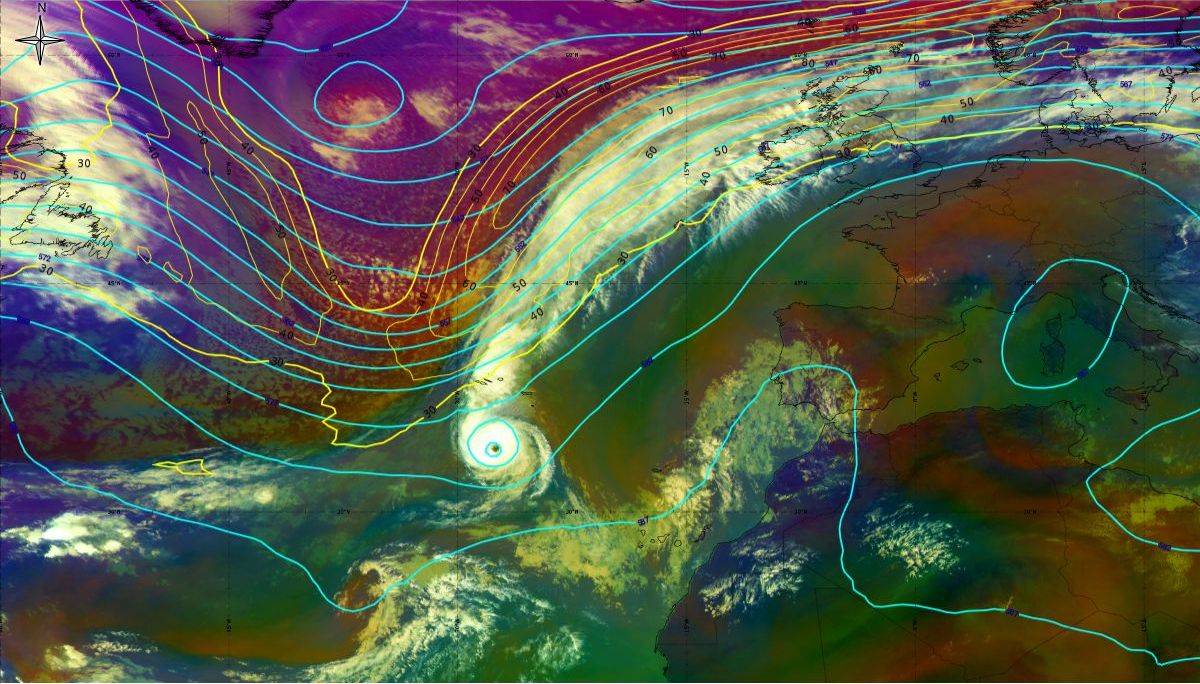
Figure 17-1: 14th October 2017 12:00 UTC - MSG Airmass RGB, geopotential height at 500 hPa (blue line), isotach at 300 hPa (yellow line - both ECMWF), source: EUMeTrain, ePort
Figure 17-2: 14th October 2017 12:00 UTC surface analyse, source DWD
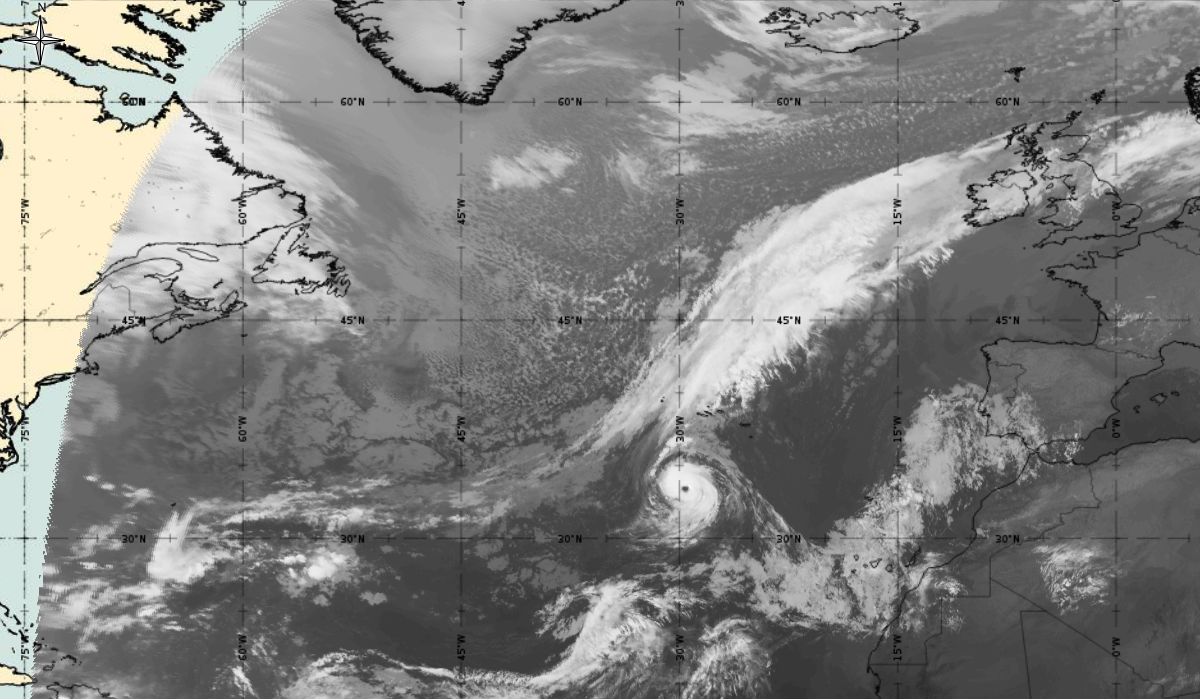
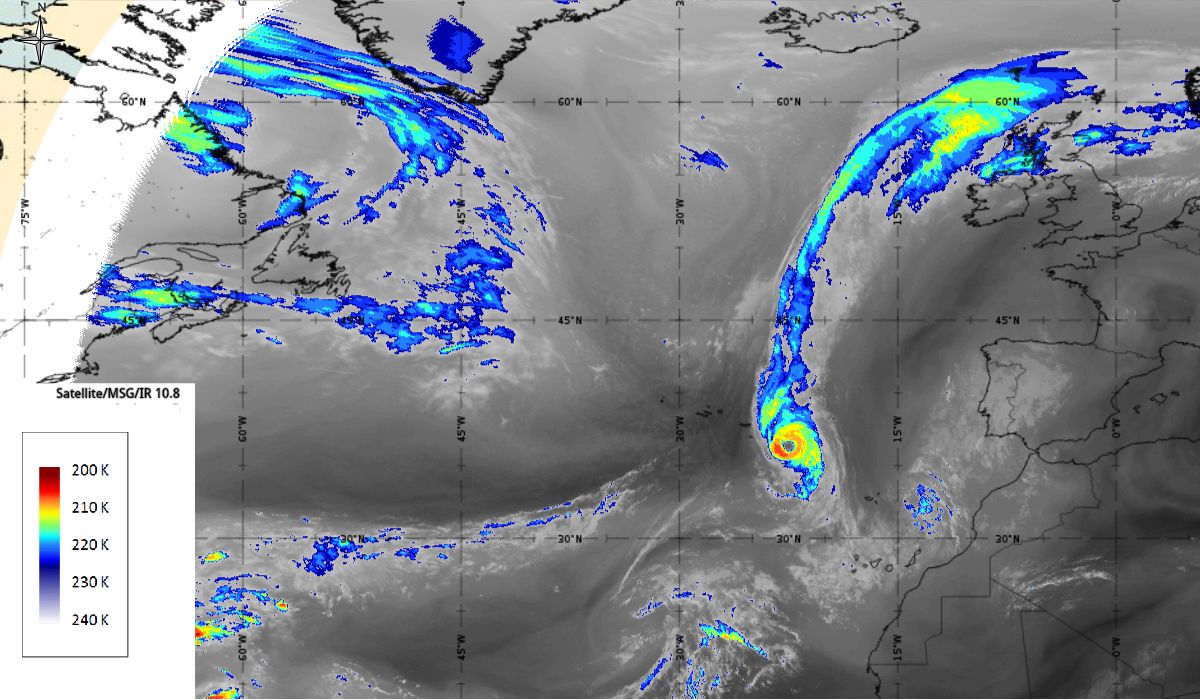
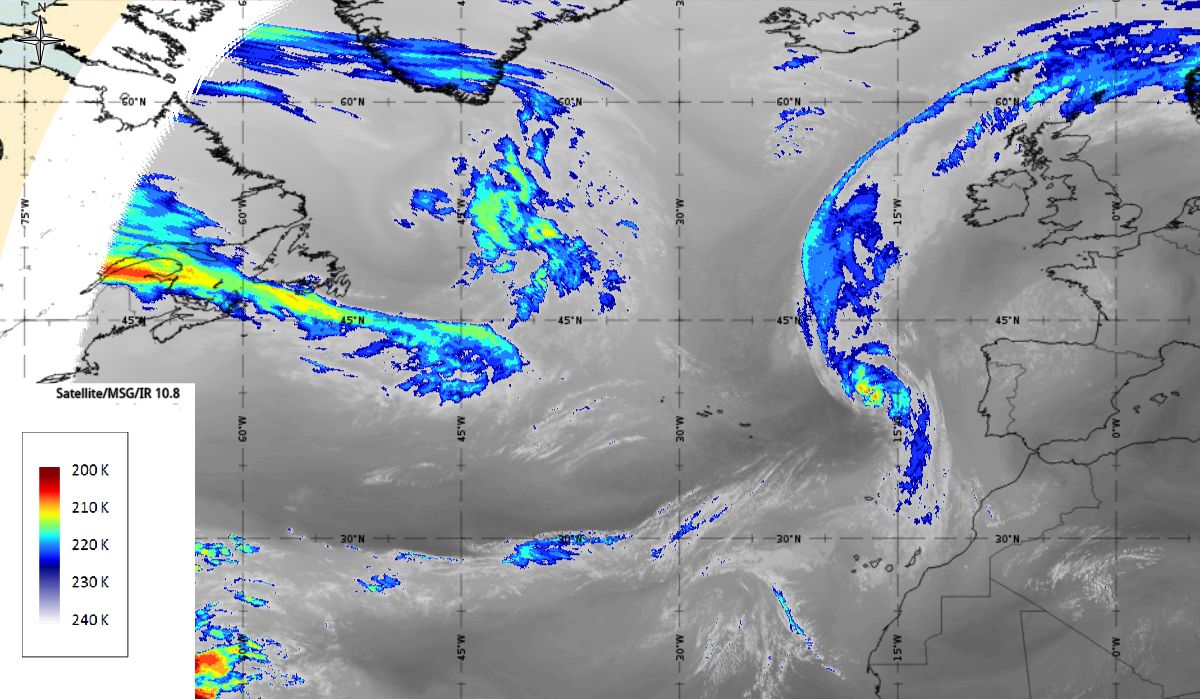
A well organised convection with cloud top temperature lower than -60°C around the eye of the hurricane is present. With a weakening of the hurricane, the temperature of the cloud tops increases, and convective development is less pronounced. (Figure 18)
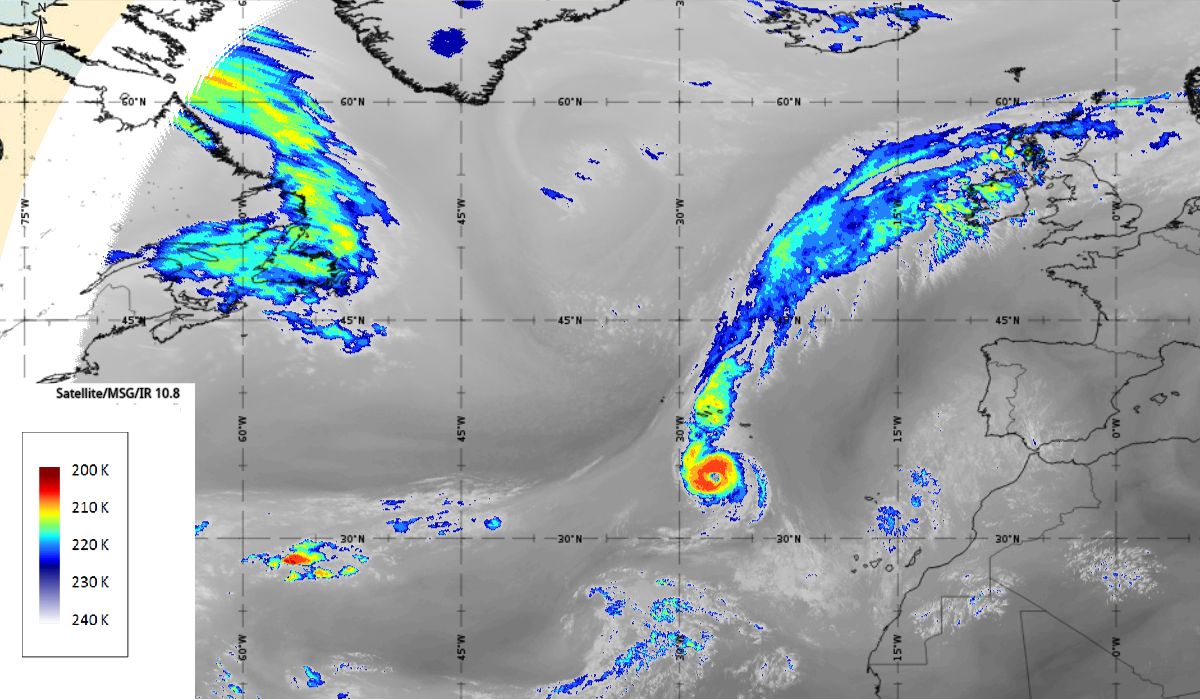
Figure 18: Meteosat 10 Enhanced IR10.8, 14th October 2017, 12:00 UTC/15th October 2017,00:00 UTC/15th October 2017,12UTC (source: EUMeTrain, ePort)
Note: Click on the image to go through the gallery
The yellow colour of clouds in Severe storm RGB (Figure 19) in the hurricane structure indicate thick ice cloud with small ice crystals on the top which is a sign of a strong updraft. Even stronger convection with cold cloud top can be noticed north of the centre of the hurricane as a part of the cold front stretching from northeast to the southwest. At the same time on the 24-hour microphysics RGB, dark red colour, represents thick, high, and cold ice clouds and black stripes on the outer sides of the hurricane representing cirrus clouds.
|
|
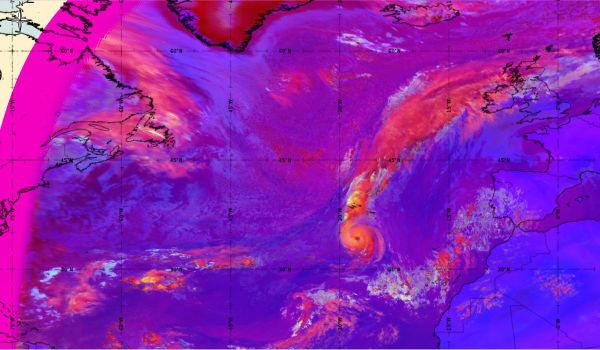
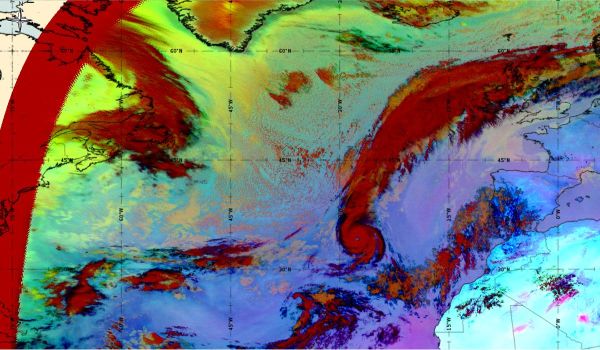
Figure 19: Severe storm RGB 14th October 2017, 12:00 UTC/24-hour Microphysics RGB (source: EUMeTrain, ePort)
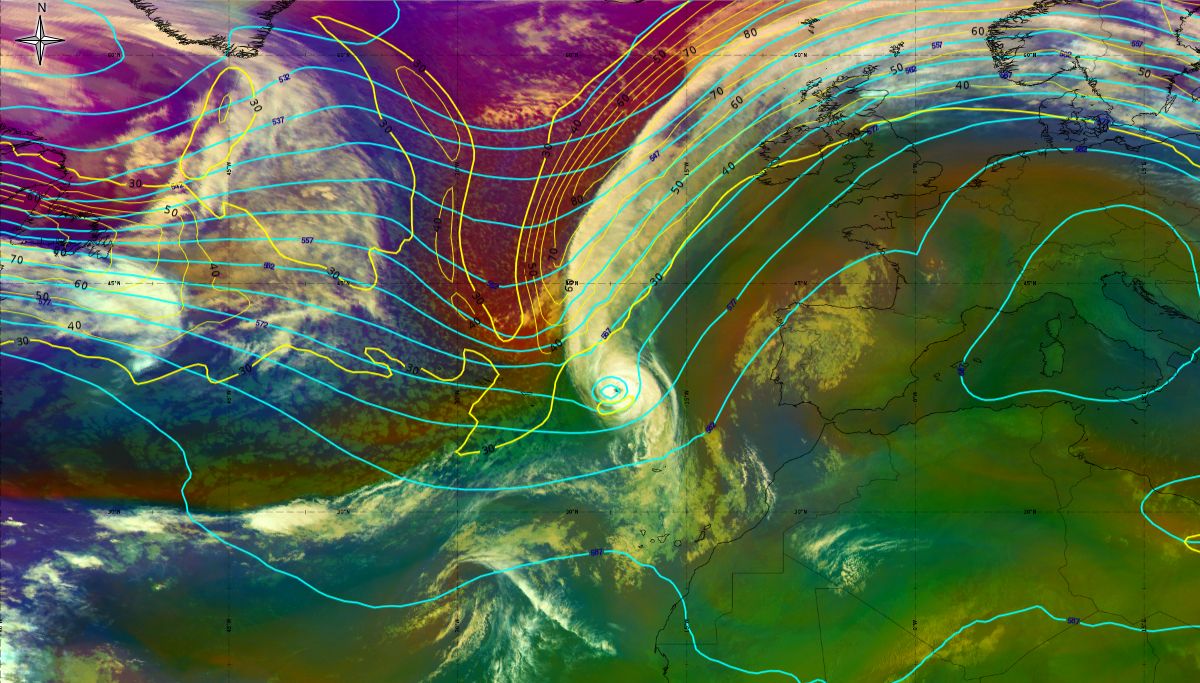
Geopotential height at 500 hPa and Jets at 300 hPa (Airmass RGB)
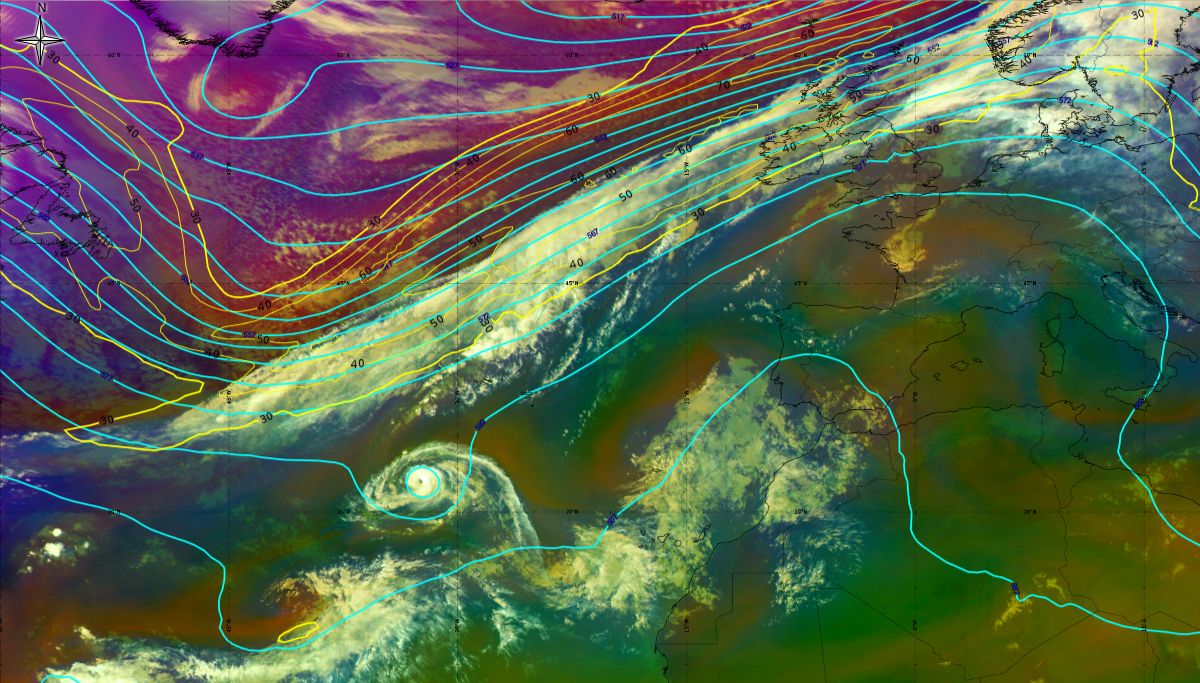
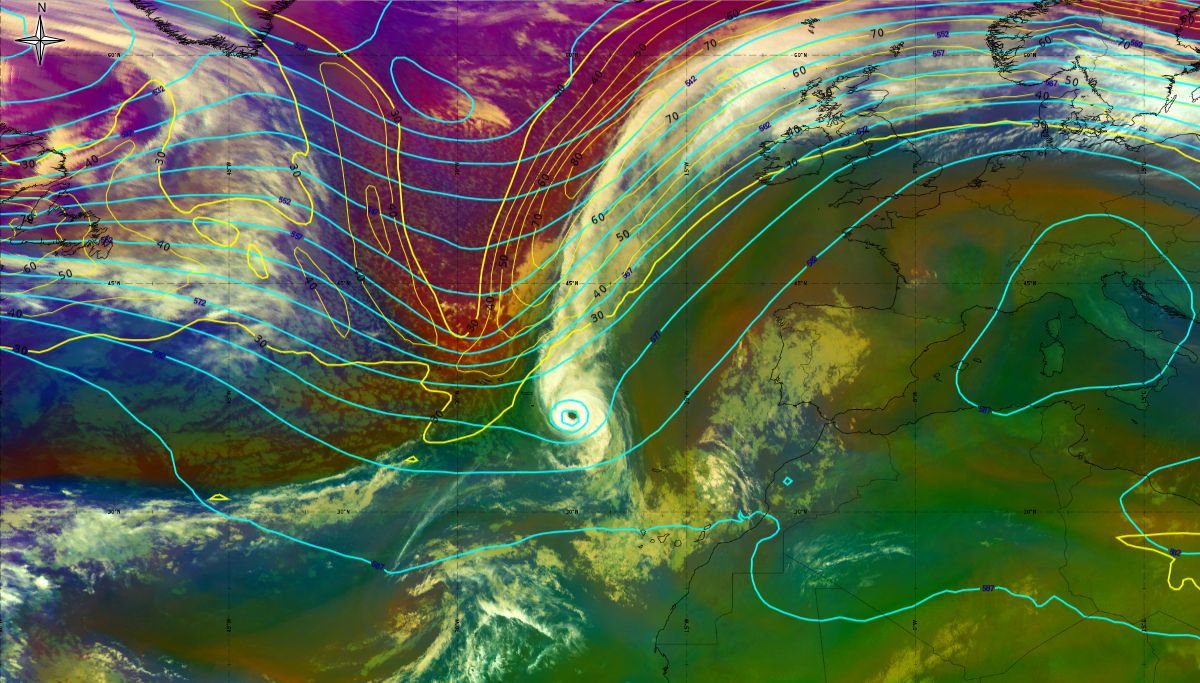
As we can see in this section, the jet stream plays a role in the second part of the lifetime of Ophelia (Figure 20). After Ophelia reached its maximum strength (14 October 12 UTC), the interaction with the strong upper level trough (visible in isolines of geopotential height at 500 hPa) and jet stream flow caused a gradual weakening of the hurricane. The jet stream is clearly visible in the satellite images, in transition from blue to red colours, like a pinstripe at the rear side of the cloud band. The jet (yellow lines - wind speed up to 70 m/s) is coming from behind/above cold front.
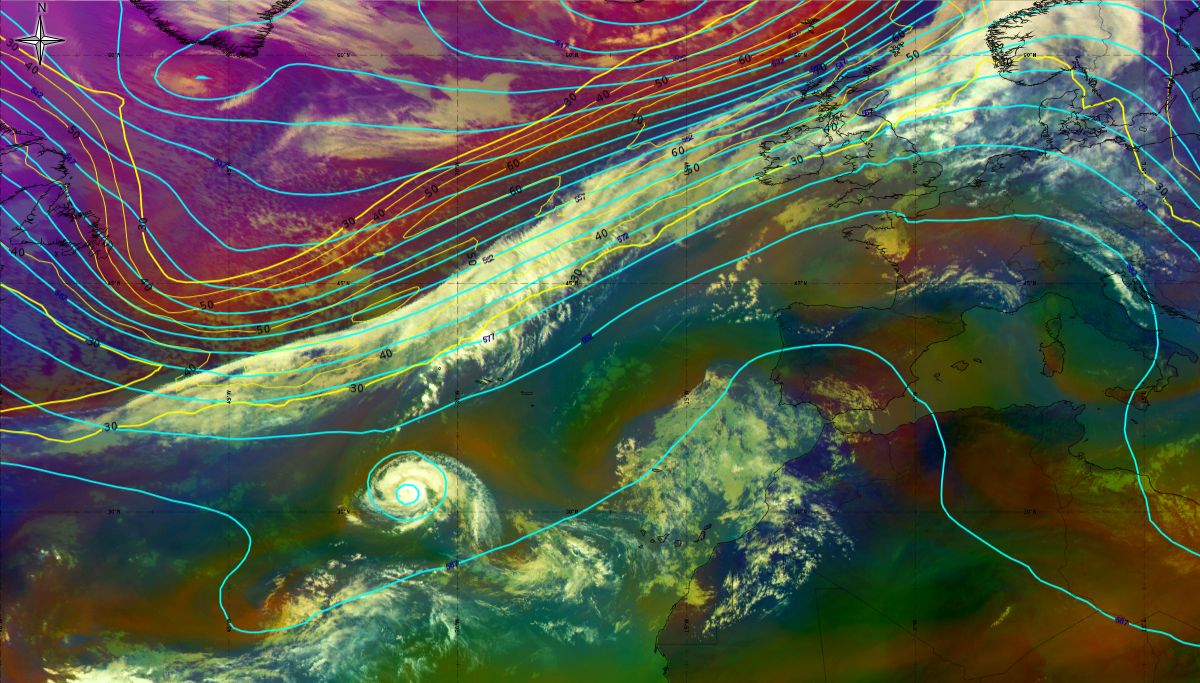
Figure 20: Geopotential height at 500 hPa (blue lines) and Jet at 300 hPa (yellow lines), Airmass RGB from 13th October 2017, 12:00 UTC to 15th October 2017, 06:00 UTC (source: EUMeTrain, ePort)
Note: Click on the image to go through the gallery
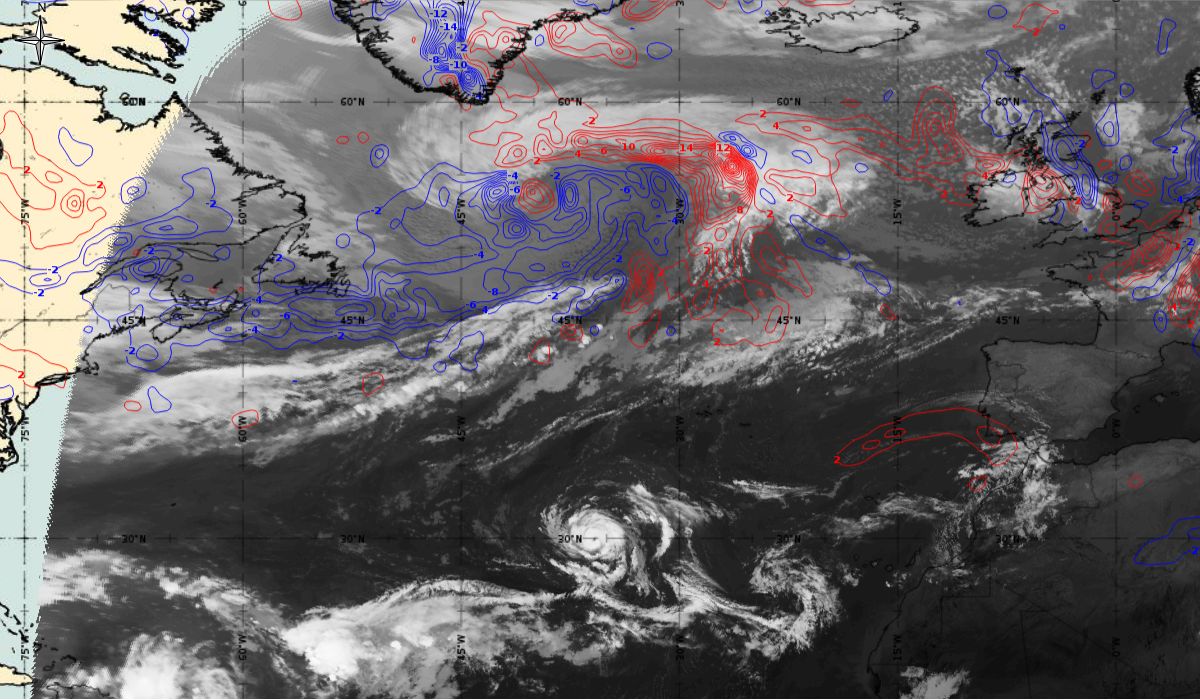
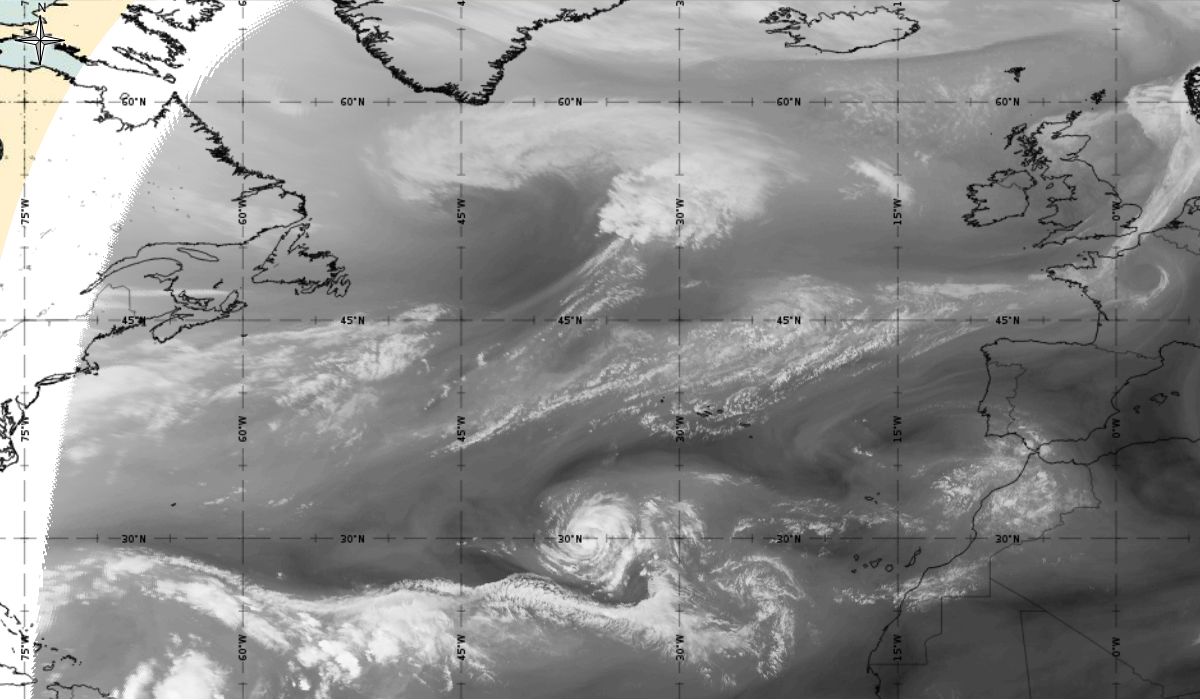
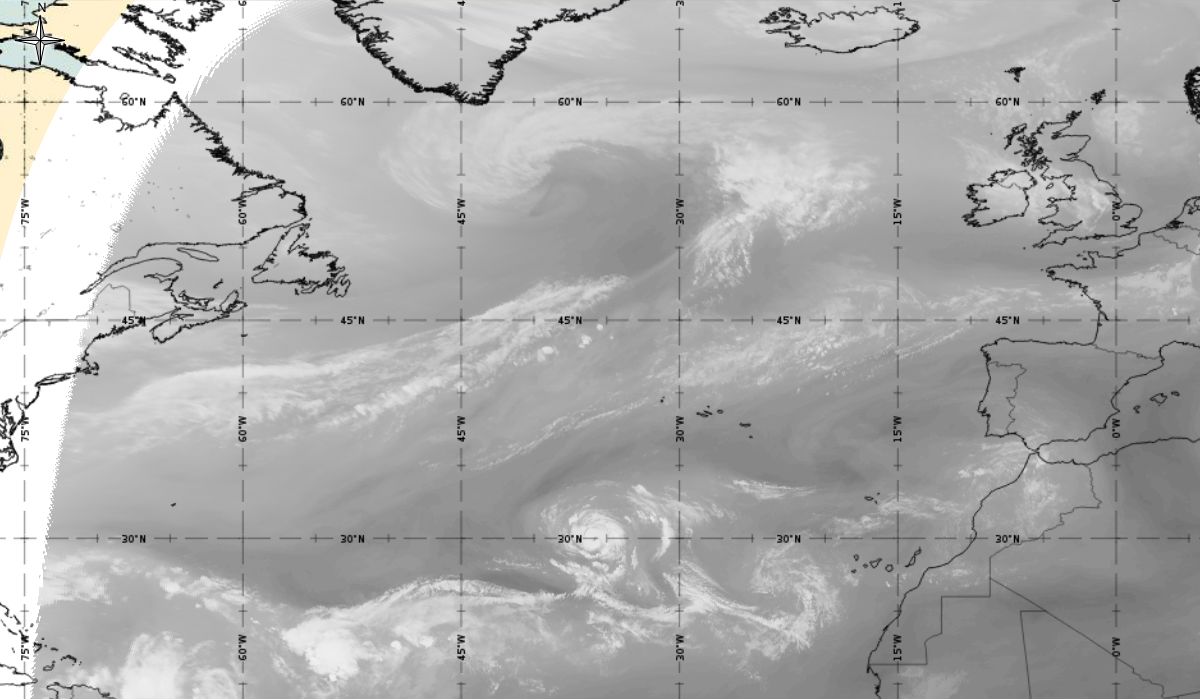
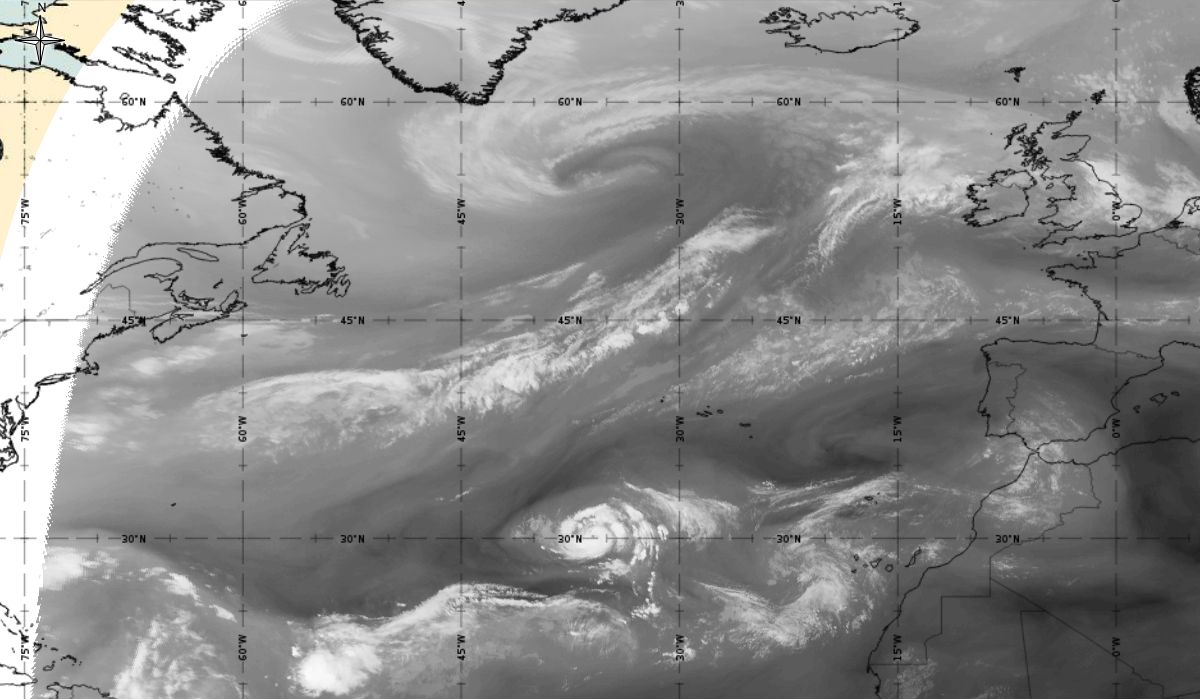
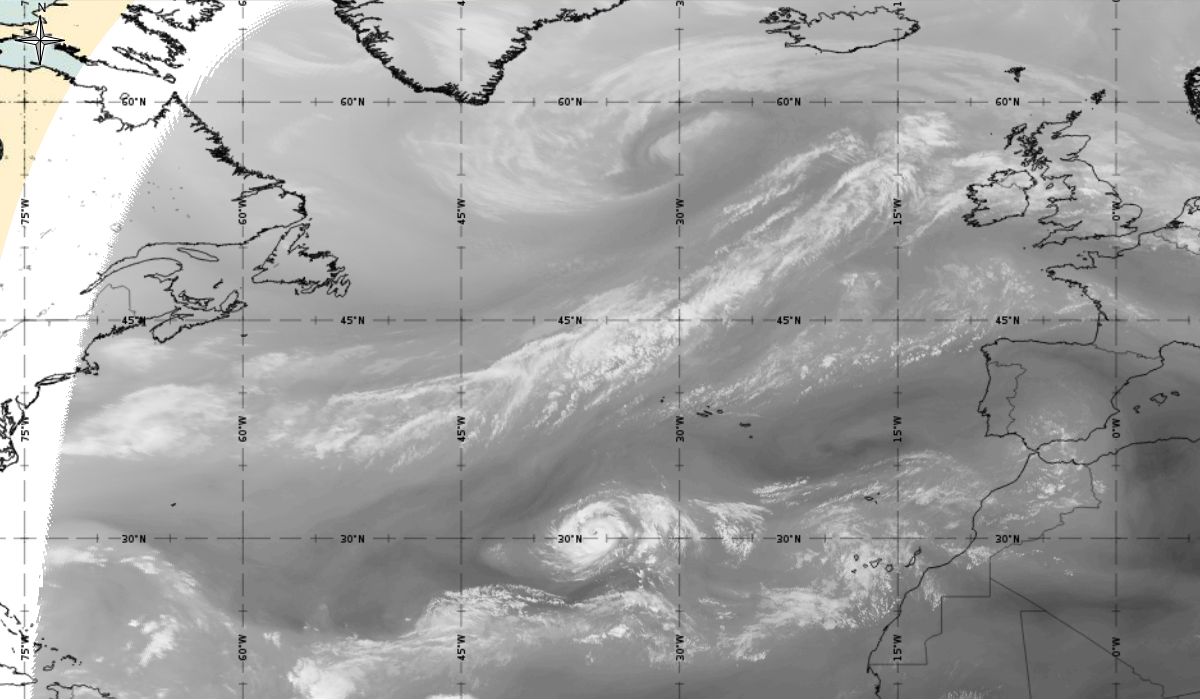
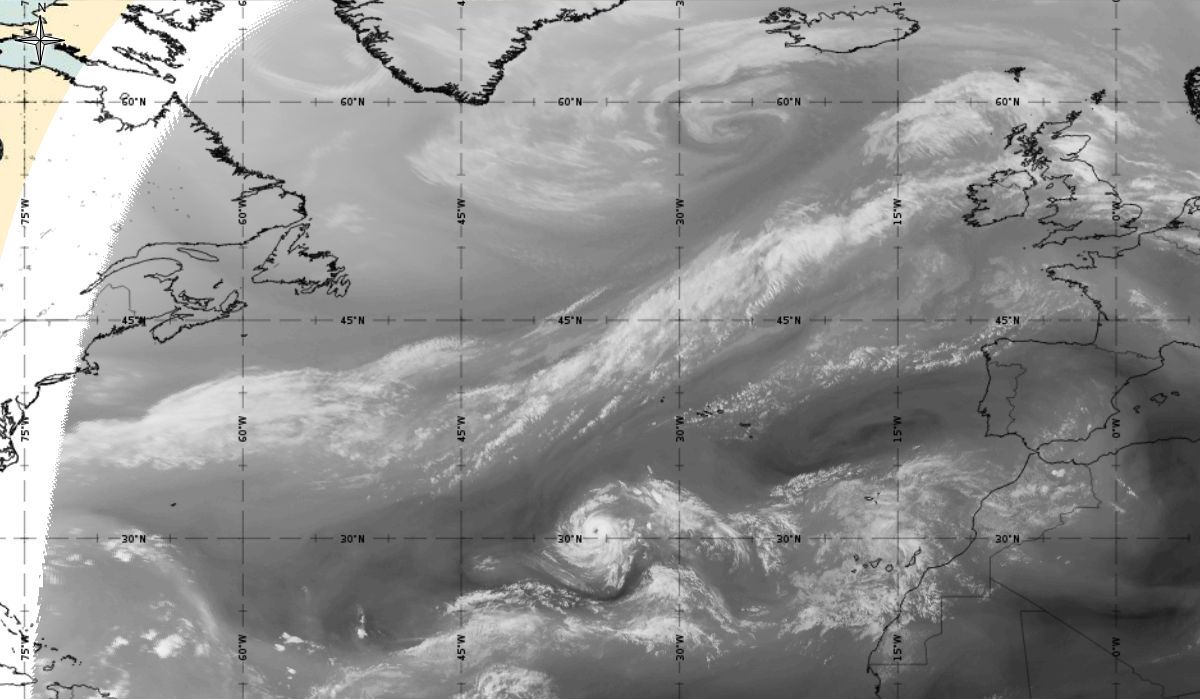
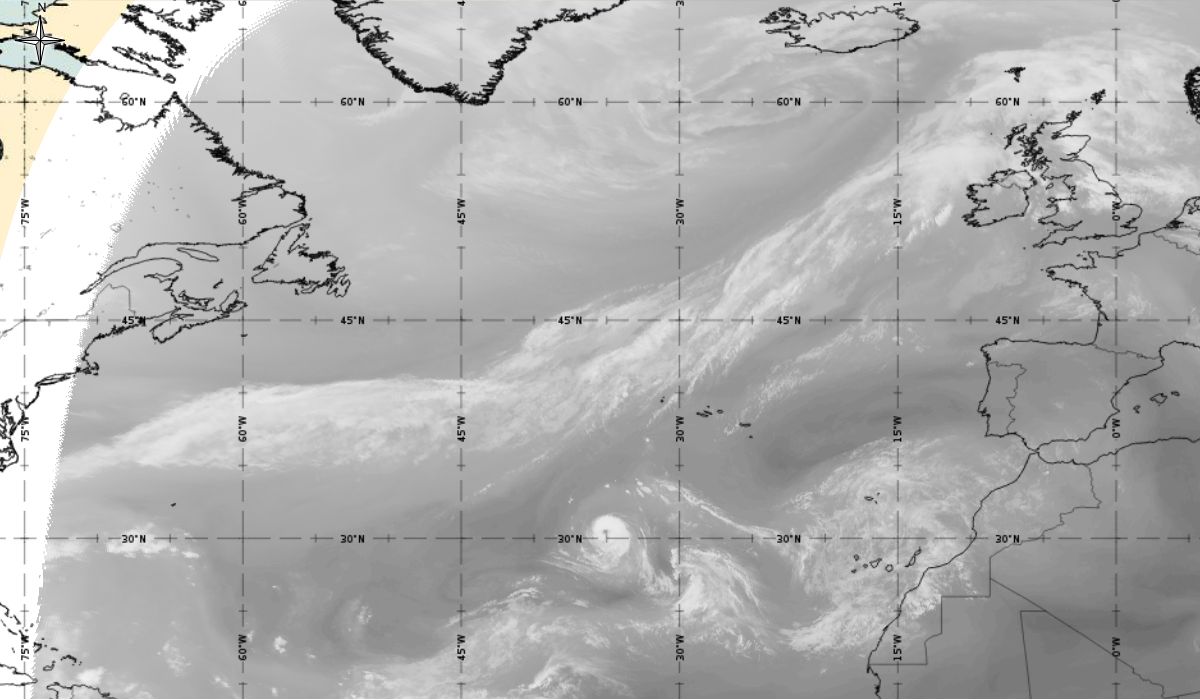
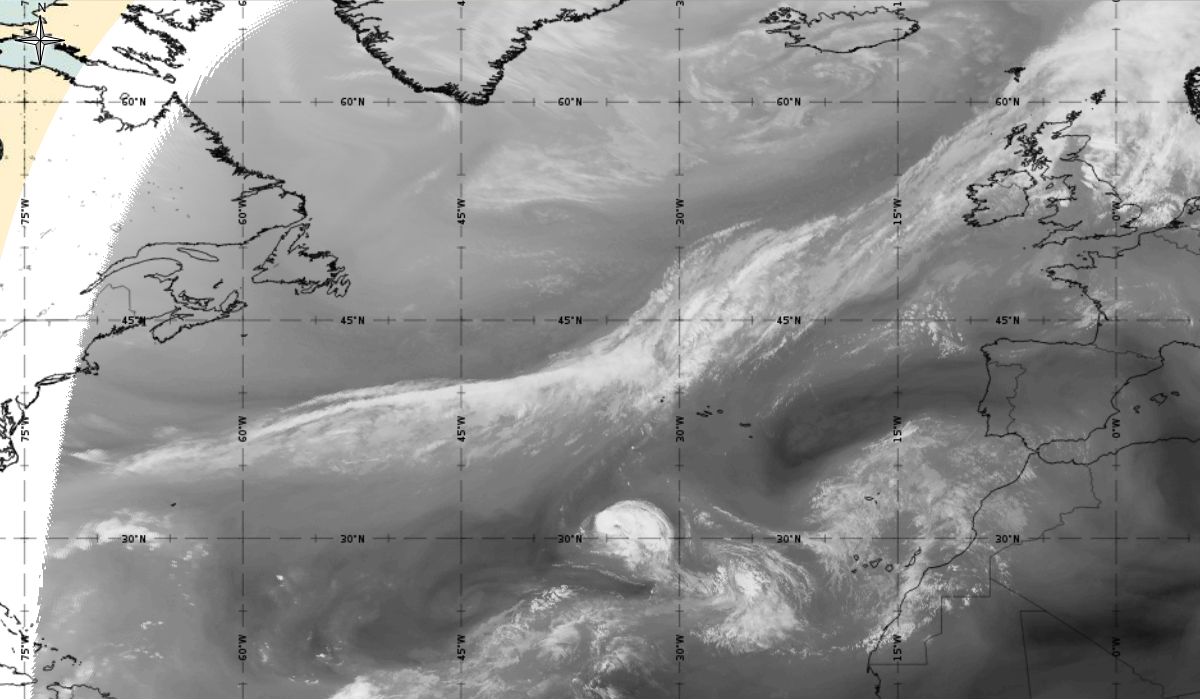
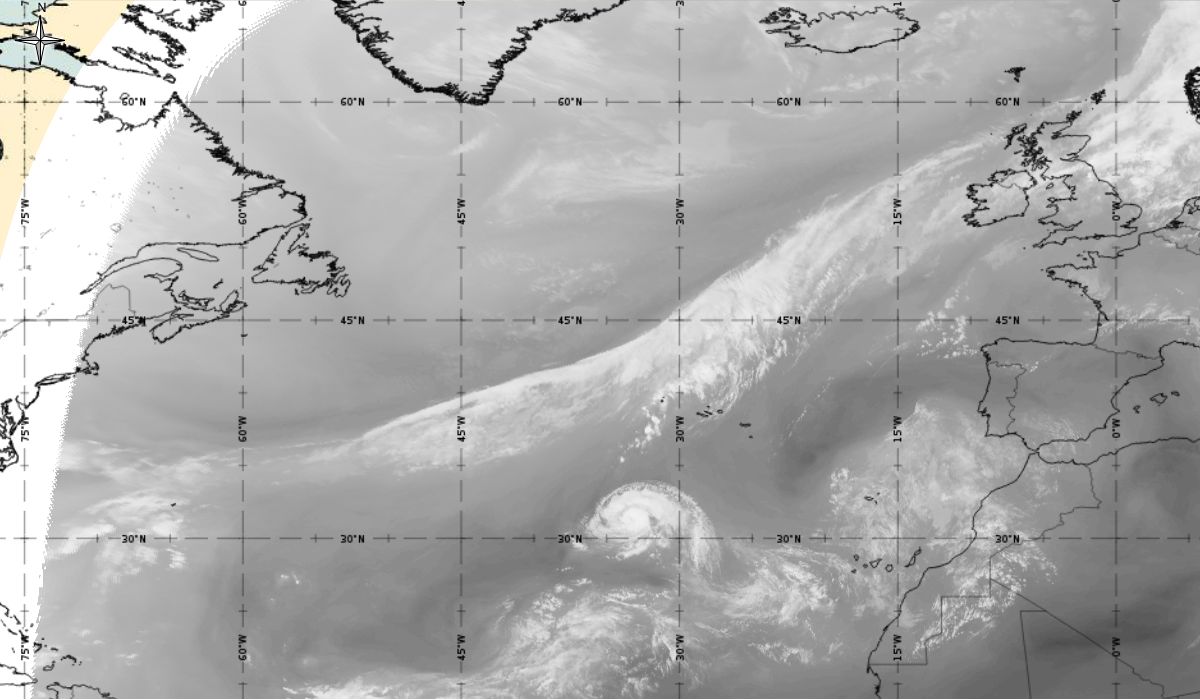
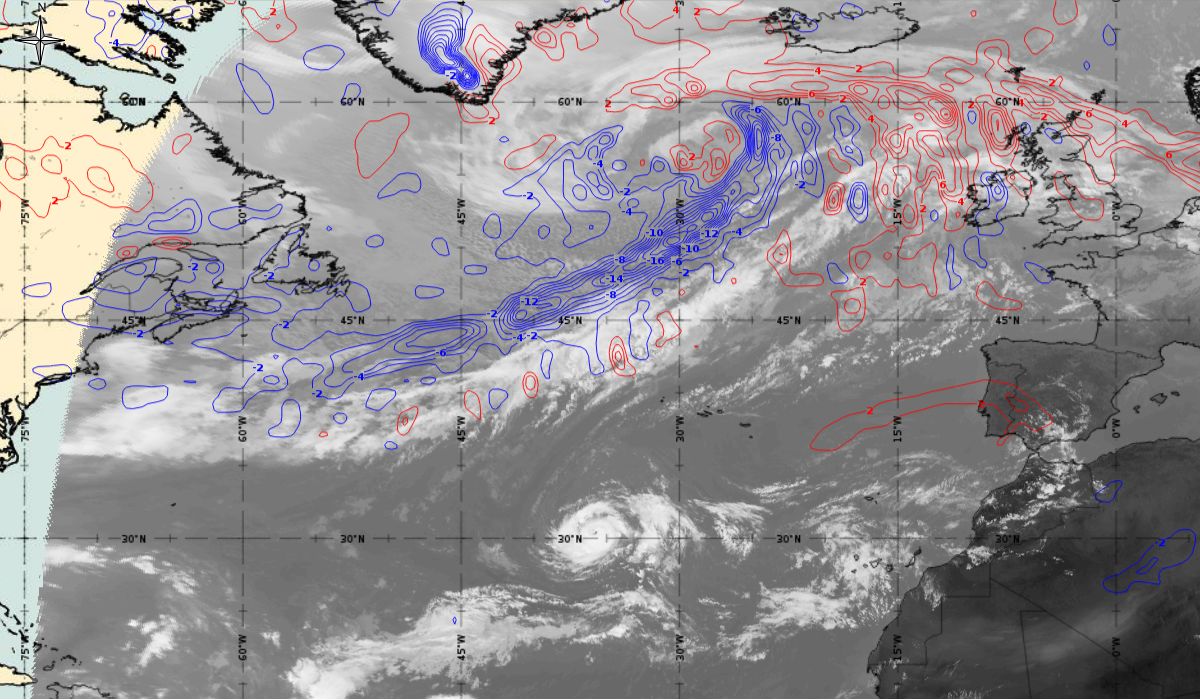
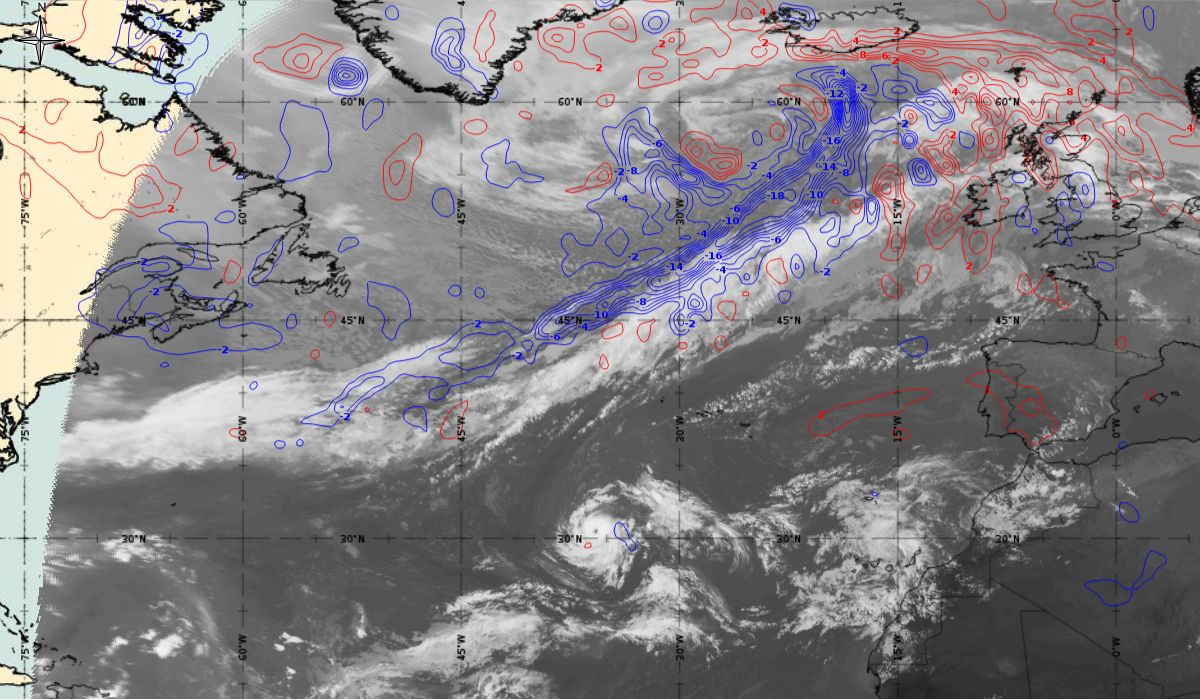
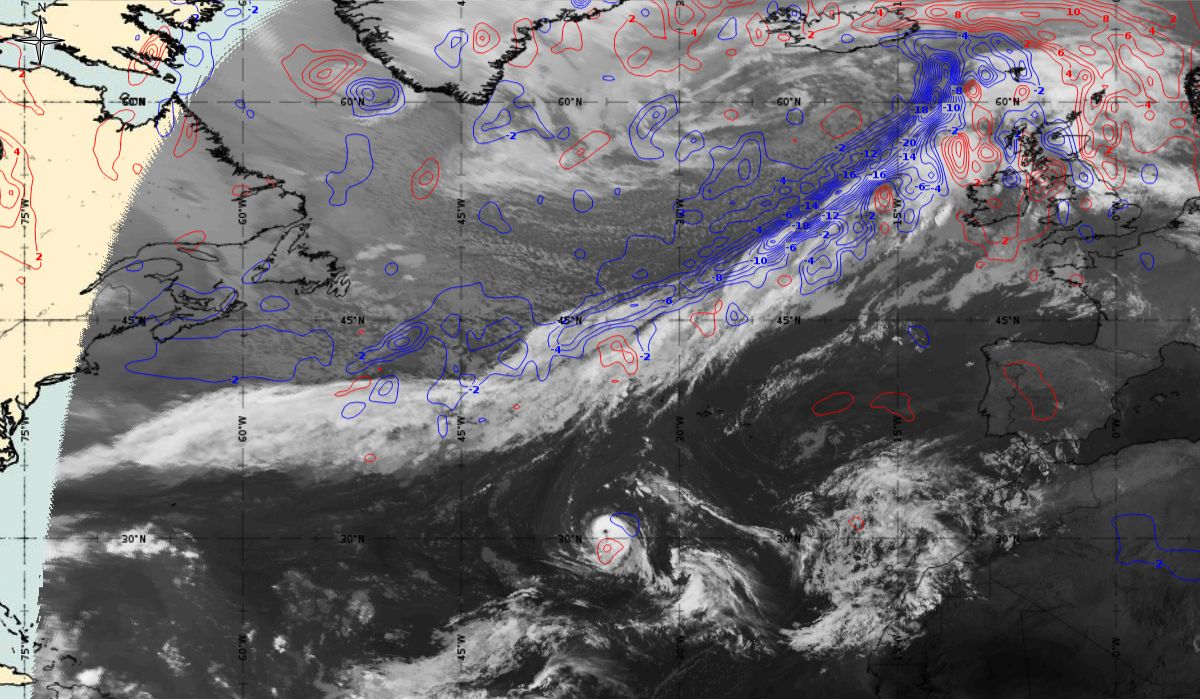
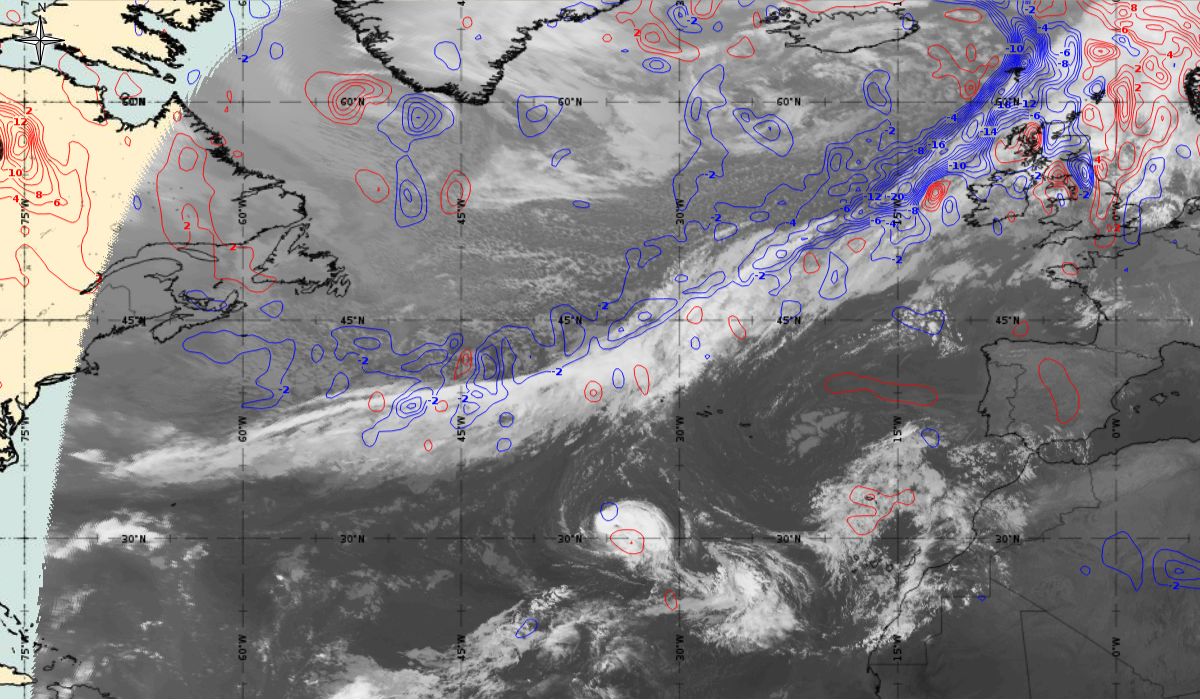
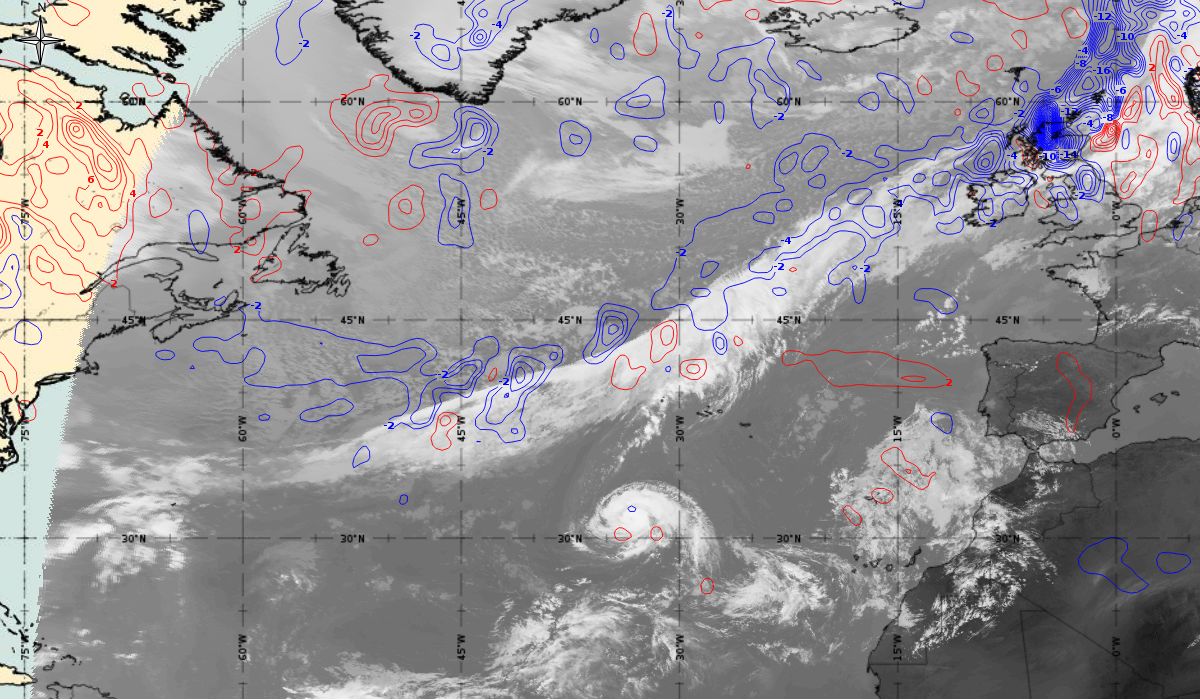
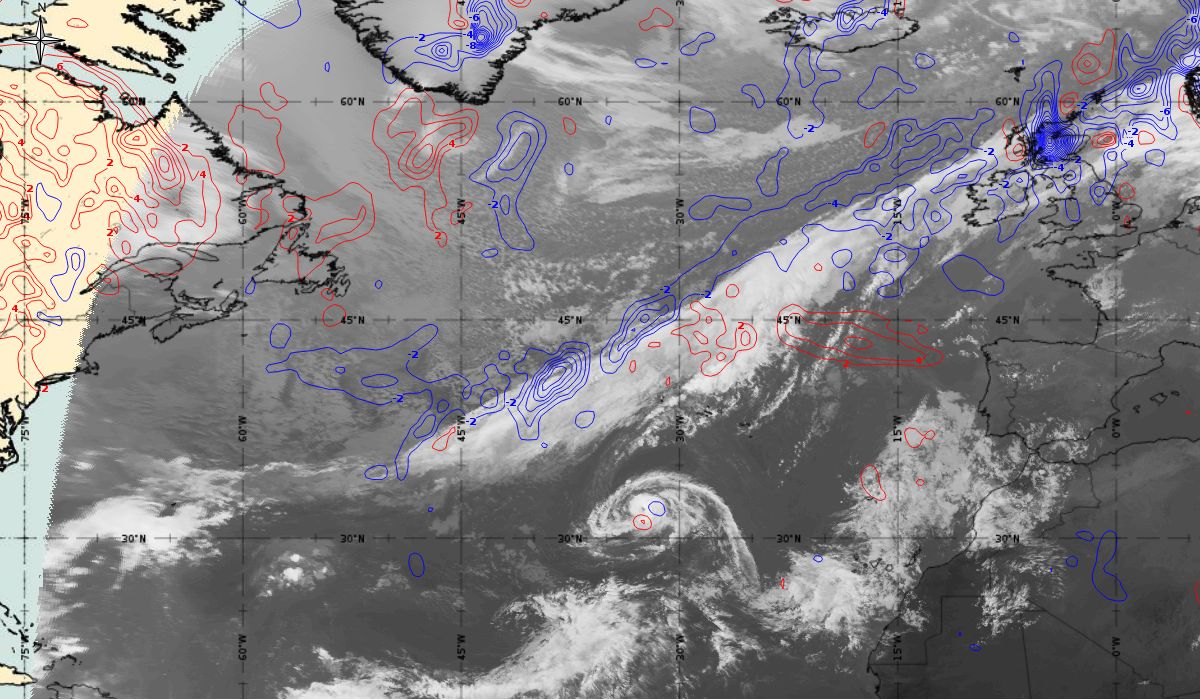
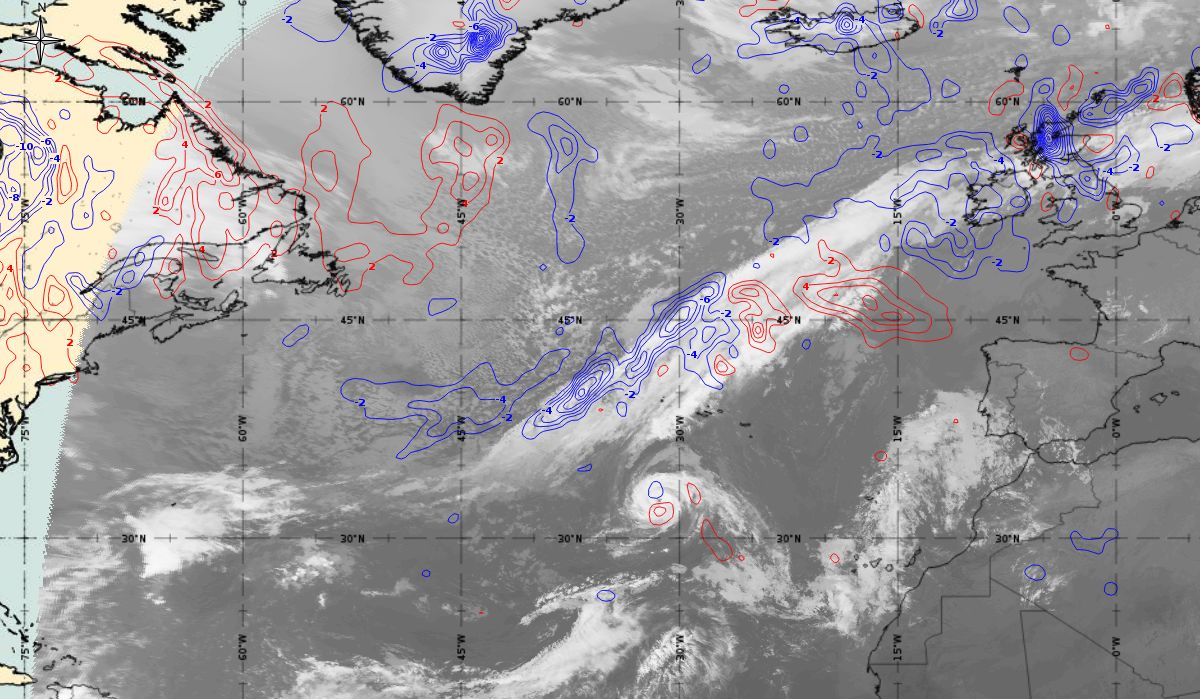
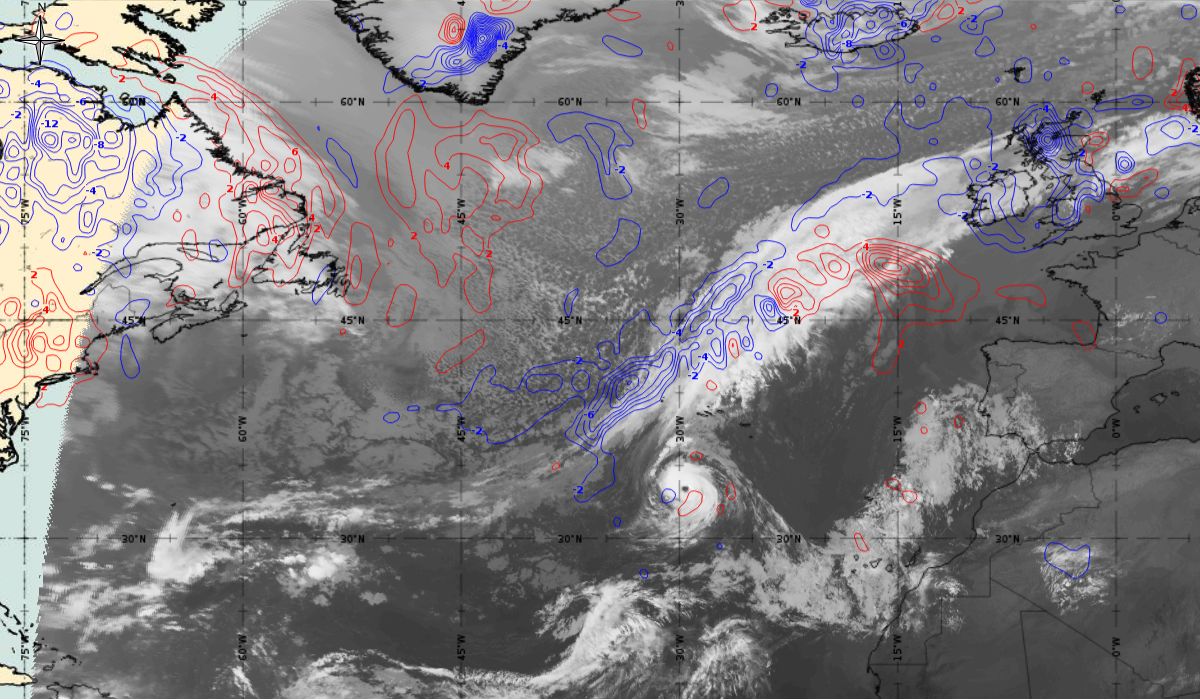
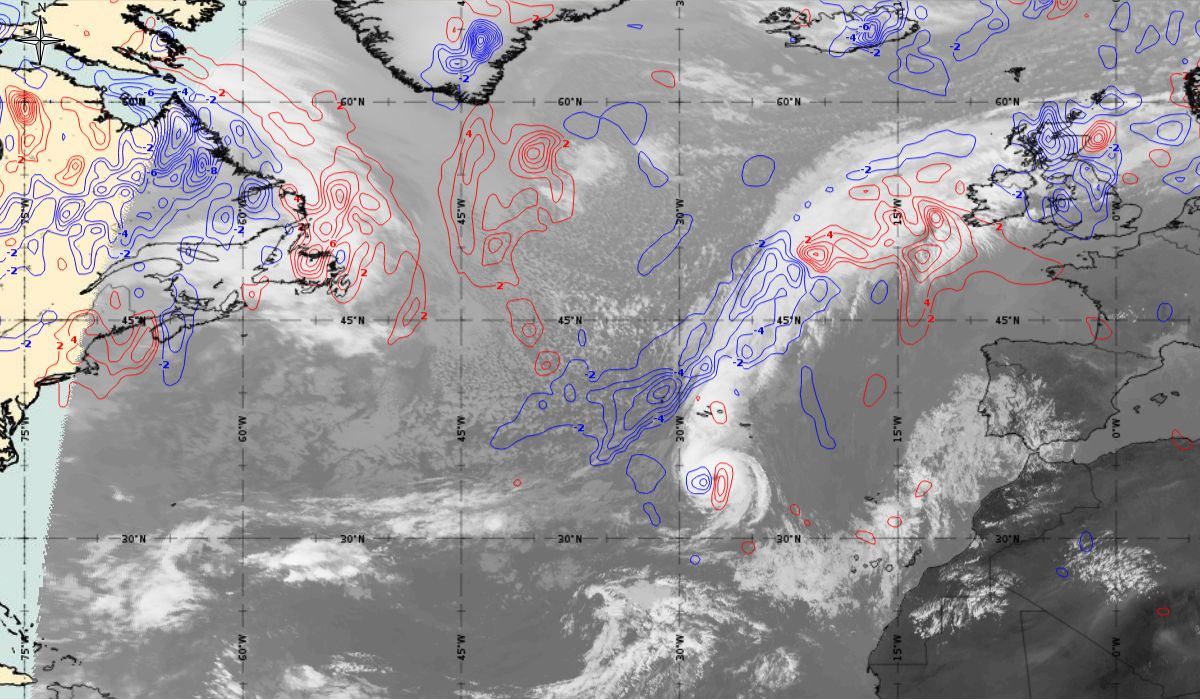
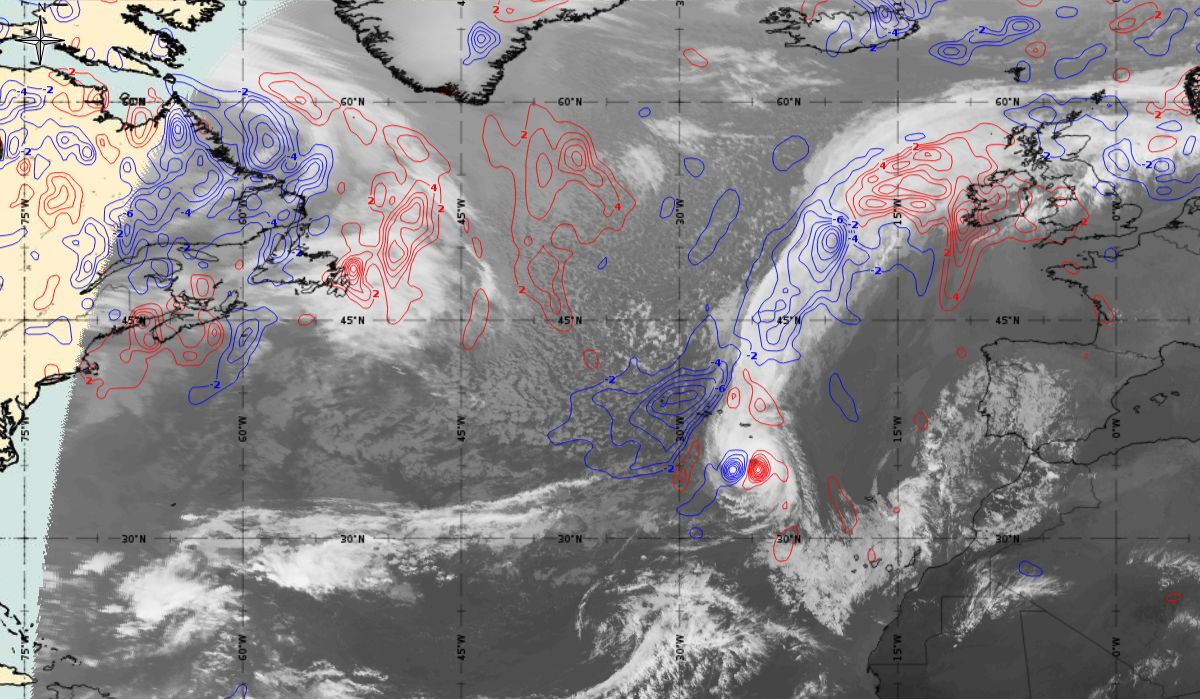
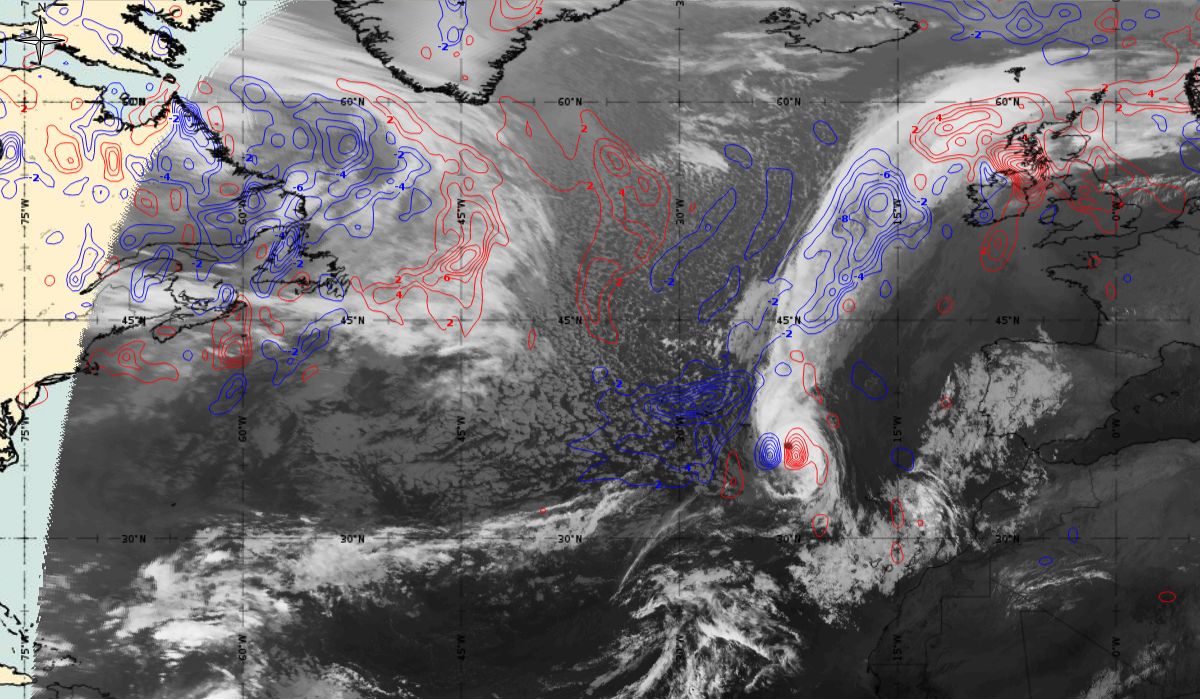
Temperature advection at 700 hPa (IR images)
As mentioned before, the tropical storm, Ophelia, which evolved into a hurricane, derives its energy through latent heat from the warm ocean, making it a warm-core low. A warm core low has no temperature advection into it (Figure 21). A mostly symmetrical cloud structure of category 1 hurricane Ophelia could be seen separated from the frontal system located far north with expressive thermal advection. In the next two days, when Ophelia grew stronger and became a hurricane category 3, there was very little to no temperature advection at 700 hPa. Once the hurricane is embedded in the strong upper level flow (15th October 00:00 UTC), at the leading edge of the upper level trough, the temperature advection become more pronounced.
Figure 21: Temperature advection at 700 hPa (blue lines - cold advection, red lines - warm advection), Meteosat 10 IR 10.8 from 12th October 2017, 00:00 UTC to 15th October 2017, 00:00 UTC (source: EUMeTrain, ePort
Note: Click on the image to go through the gallery