15/21.00 - 16/00.00 UTC - Frontal Diagnosis - Use of vertical cross sections
|
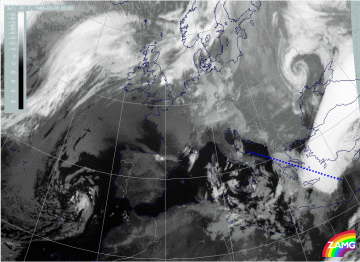
16 March 1998/00.00 UTC - Meteosat IR image; position of vertical cross section indicated
|
|
As can be seen in the image above, the vertical cross section has now a different orientation compared with the cross sections discussed for the 12 hours period before (compare 09.00 - 12.00 UTC - Frontal Diagnosis - Use of vertical cross sections and 15.00 - 18.00 UTC - Frontal Diagnosis - Use of vertical cross sections). It was chosen in such a way as to be perpendicular to both TFP zones and to have a similar relation to the cloud features as before.
|
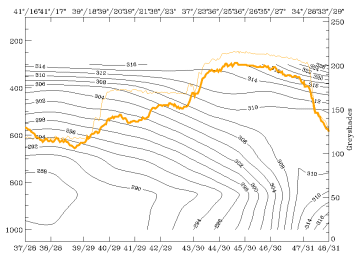
16 March 1998/00.00 UTC - Vertical cross section; black: isentropes (ThetaE), orange thin: IR pixel values, orange thick: WV pixel
values
|
|
The relation between isentropes and satellite pixel values can be seen in the image above. The main broad IR and WV peak between 37N/23E and 34N/27E represents the white cloud band, the smaller IR peak between 39N/18E and 39N/21E represents the low top cloudiness over Greece. For this peak the WV signal is rather small, indicating areas with dry WV values above. For the first time during this case study only one main frontal zone can be detected in the isentropes, but it has to be considered that the orientation of the vertical cross section line differs from that previously. The surface front is in the leading part of the bright cloud band but remnants of the former northern frontal surface might be detectable in the isentropes reaching the surface around 39N/21E.
|
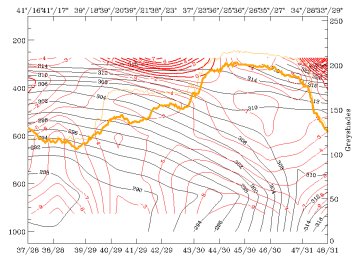
16 March 1998/00.00 UTC - Vertical cross section; black: isentropes (ThetaE), red thin: temperature advection - CA, red thick:
temperature advection - WA, orange thin: IR pixel values, orange thick: WV pixel values
|
|
As six hours before, the whole area of the vertical cross section is under intensive CA (compare 15.00 - 18.00 UTC - Frontal Diagnosis - Use of vertical cross sections).
|
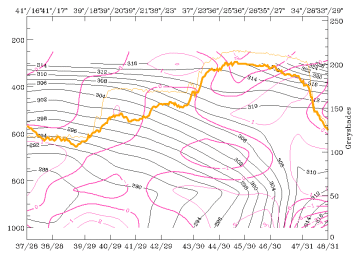
16 March 1998/00.00 UTC - Vertical cross section; black: isentropes (ThetaE), magenta thin: divergence, magenta thick: convergence,
orange thin: IR pixel values, orange thick: WV pixel values
|
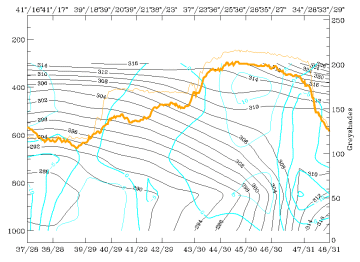
16 March 1998/00.00 UTC - Vertical cross section; black: isentropes (ThetaE), cyan thick: vertical motion (omega) - upward motion, cyan
thin: vertical motion (omega) - downward motion, orange thin: IR pixel values, orange thick: WV pixel values
|
The field of divergence (left image) supports the idea of having two different synoptic systems: the main one is a frontal one and shows convergence in middle and upper layers and, for the first time during this case study, divergence in the low layer; a second convergence maximum can be found between 900 and 650 hPa in the area of the low cloud area; the development of convergence in the lowest layer was already mentioned during the last 12 hours where this area was still a frontal zone. This new and intensified convergence area over Greece where the low level cloudiness exists is connected with pronounced vertical motion above (right image). This situation might support the development or maintenance of this cloud field. In contrast to this, the situation at the main front might be interpreted as beginning dissolution.
