Chapter III: Preconvective Environment
Table of Contents
- Chapter III: Preconvective Environment
- Preconvective Environment
Preconvective Environment
Global Instability Index
The Global Instability Index (GII) product is one of the MPEF meteorological products and describes the instability of the clear atmosphere by a number of airmass parameters. Although of highly empirical nature, the instability indices often indicate the potential for convection a few hours prior to the actual onset of convection.
For the 25 May 2009 case, the unstable airmass is well visible in several ways: (a) in the K-Index, where values exceed 30 °C; (b) in the Lifted Index, with values around -6 K (and in some areas even below -8 K); and (c) in the Total Precipitable Water (TPW) content, which shows the associated humidity of around 30 mm. The TPW content of the warm, humid airmass over Central France that was discussed previously and shown in the Dust RGB appears particularly clearly in the derived product GII, with values around 40mm.
The Lifted Index is (by definition) driven by near-surface heating and thus shows the expected diurnal cycle, while both the K-Index and the TPW show much smaller temporal changes.
24-hour loop of the GII K-Index
24-hour loop of the GII Lifted Index
24-hour loop of GII Total Precipitable Water
NWCSAF Statistical Physical Retrieval
The SEVIRI Physical Retrieval (SPhR) algorithm retrieves either the atmospheric temperature and moisture profiles and the surface temperature for one clear sky SEVIRI pixel, or a Field-Of-Regard (FOR) which contains M x M pixels. The main purpose of the SPhR is to provide information on the water vapor contained in a vertical column of unit cross-section area in several layers in the troposphere and to provide a range of instability indices. These parameters are calculated from the retrieved profiles of temperature and humidity. For your interest you can find more information on the product in this article.
The algorithm functions much like a GII with a neural network. The algorithm, based on physical retrieval, obtains retrieved Temperature (T) and humidity (q) profiles on clear pixels. The parameters are calculated from these retrieved profiles.
- 24-hour loop of the Physical Retrieval - K-Index (Flash material not existing)
- 24-hour loop of the Physical Retrieval - Lifted Index (Flash material not existing)
- 24-hour loop of the Physical Retrieval - Showalter Index (Flash material not existing)
- 24-hour loop of the Physical Retrieval - Total Precipitable Water (Flash material not existing)
- 24-hour loop of the Physical Retrieval - Total Precipitable Water: Boundary Layer (Flash material not existing)
- 24-hour loop of the Physical Retrieval - Total Precipitable Water: Medium Layer (Flash material not existing)
- 24-hour loop of the Physical Retrieval - Total Precipitable Water: High Layer (Flash material not existing)
Summary
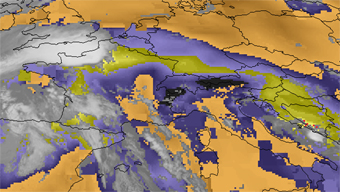
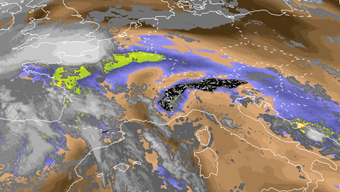
In this chapter two similar products for a preconvective environment were presented: (1) the GII product with its origin in the MPEF production chain, and (2) the PGE13 (Physical Retrieval) as it is produced and developed by the Nowcasting SAF. These products are useful mainly in the morning hours. Identifying the regions with the highest potential for thunderstorms makes it easier to focus on them later that day. This idea was also the starting point of a study by ZAMG in 2008, where the early morning Lifted Index and K-index were compared with lightning occurences later that day. Below we see the K-index for the GII (left) and the Physical Retrieval, or PGE13, as it is also known (right).
Figure 3.1: K-index as obtained by MPEF GII (above) and from the Nowcasting SAF Physical Retrieval (below) for 25 May 2009 0600UTC
Both images use the same colour scale for the K-index values over 20. The differences are found in Baden-Württemberg (SW Germany), Southern Austria (Carinthia and Styria) and along the Adriatic Coast. All these areas apprear to be less stable in the GII retrieval scheme with all K-index values topping 30 °C or higher. Both maximum values for K-index are found along the coast of the Adriatic.
Further north, in the Netherlands, stable conditions are found over the central part in the PGE13 retrieval scheme, with the GII listing values up to around 20 °C.
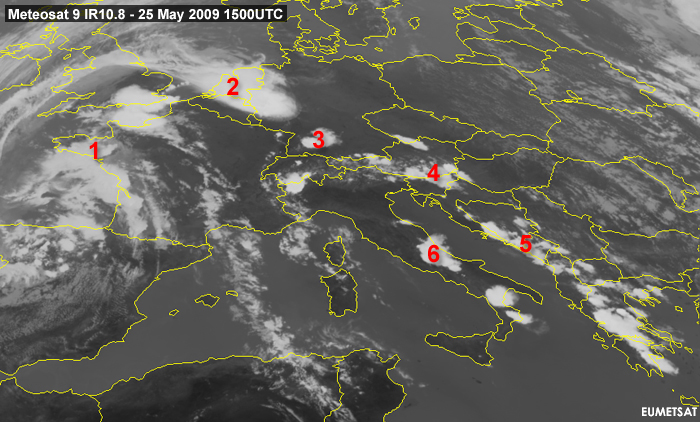
In the IR10.8 images we can see the result of convection of that day and making it able to do a subjective(!) comparison.
Figure 3.2: Meteosat 9 IR10.8 - 25 May 2009: 1500UTC
In the image several convective areas are to be recognised; Brittany (FR), Netherlands, Baden-Württemberg (GER), Carinthia (AT), Adriatic Coast and the center part of Italy. The performance between the two preconvective products is listed in the table below.
| GII | NWCSAF: PGE13 | |
|---|---|---|
| 1 - Brittany | + | ++ |
| 2 - the Netherlands | + | - |
| 3 - Baden-Württenberg | ++ | + |
| 4 - Carinthia | ++ | + |
| 5 - Adriatic Coast | ++ | + |
| 6 - Central Italy | + | - |
Table 3.1: Table listing the performance of the GII and the PGE13 product for several regions in Europe. A '+' is sign of good performance, with an increase of '+' indicative for a higher K-index. A '-' in this table means that the algorithm failed to nowcast the convective event.
In this case it seems that the GII performed better, however a longer comparison and a longer testing of the algorithm is necessary.


