Weather Events
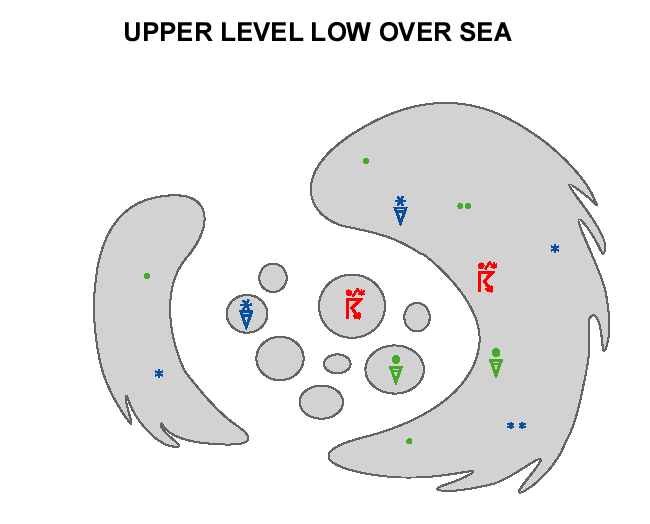
- The frontal cloud band on the leading edge of an Upper Level Low is usually thick enough to produce precipitation. In some cases there is also frontal cloudiness on the rearward edge. Within the cloud bands there are embedded Cbs, and therefore the precipitation is showery.
- When the Upper Level Low is over land, there is a low cloud layer in the centre.
- Over cold surface there is no convection, and therefore no showers occur.
Over Sea
| Parameter | Description |
| Precipitation |
|
| Temperature |
|
| Wind (incl. gusts) |
|
| Other relevant information |
|
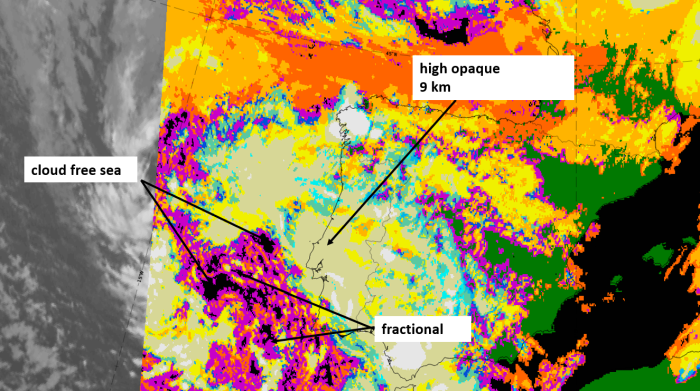
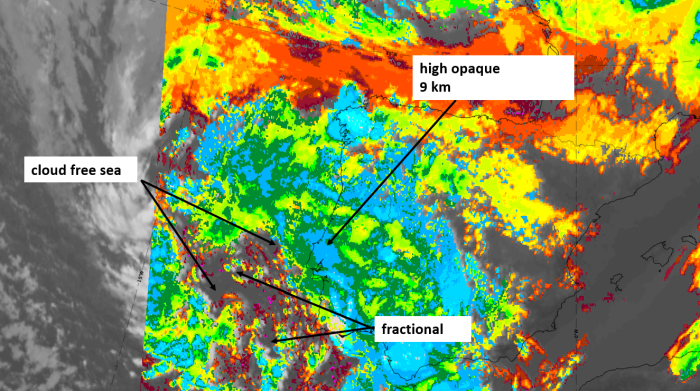
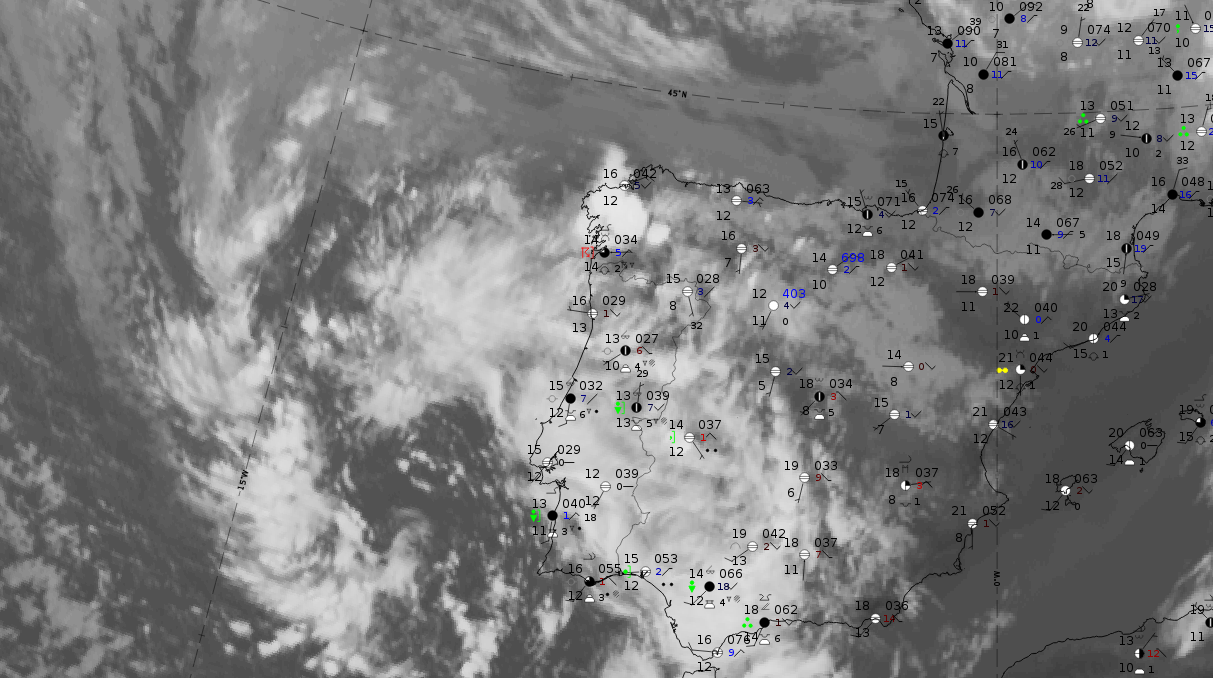
The case west of and over Spain from 13 May 2020 at 18 UTC can be used as an example for a cut-off low (at least partly) over sea. The IR image below shows the two cyclonically curved cloud bands around the cut-off low centre which is located to the west of Spain, over the ocean.
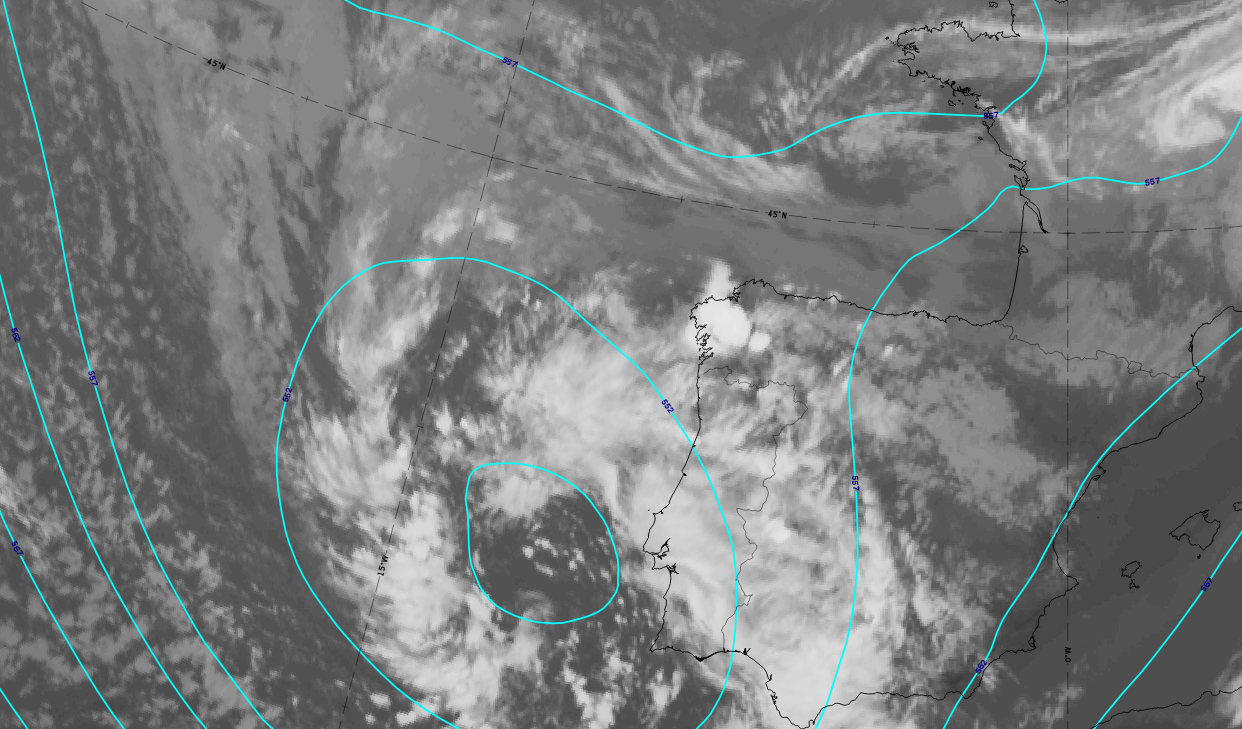
13 May 2020 at 18 UTC: IR; cyan lines: height contours 500 hPa.
|
|
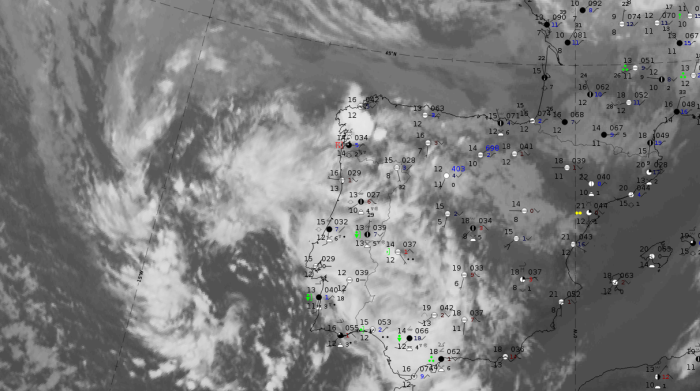
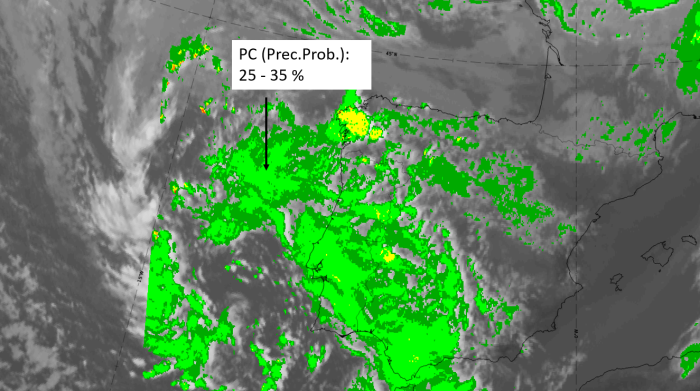
Legend: 13 May 2019 at 18UTC: IR + synoptic measurements (above) + probability of moderate rain (Precipitting clouds PC - NWCSAF).
Note: for a larger SYNOP image click this link.
The cut-off low centre is mostly cloud free with some smaller cloud cells. The cloud bands at the cut-off low boundary are accompanied by precipitation, mostly in shower form. This corresponds with the fact that the probability of moderate precipitation from the NWCSAF is low.
|
|
|
|
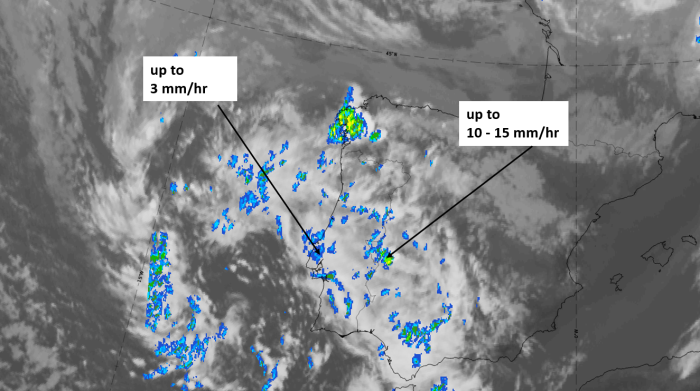
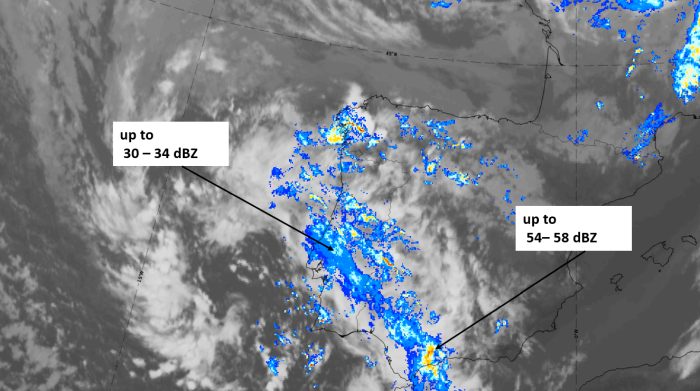
Legend:
13 May 2020 at 18 UTC, IR ; superimposed:
1st row: Cloud Type (CT NWCSAF) (above) + Cloud Top Height (CTTH - NWCSAF) (below); 2nd row: Convective Rainfall Rate (CRR NWCSAF) (above) + Radar intensities from Opera radar system (below).
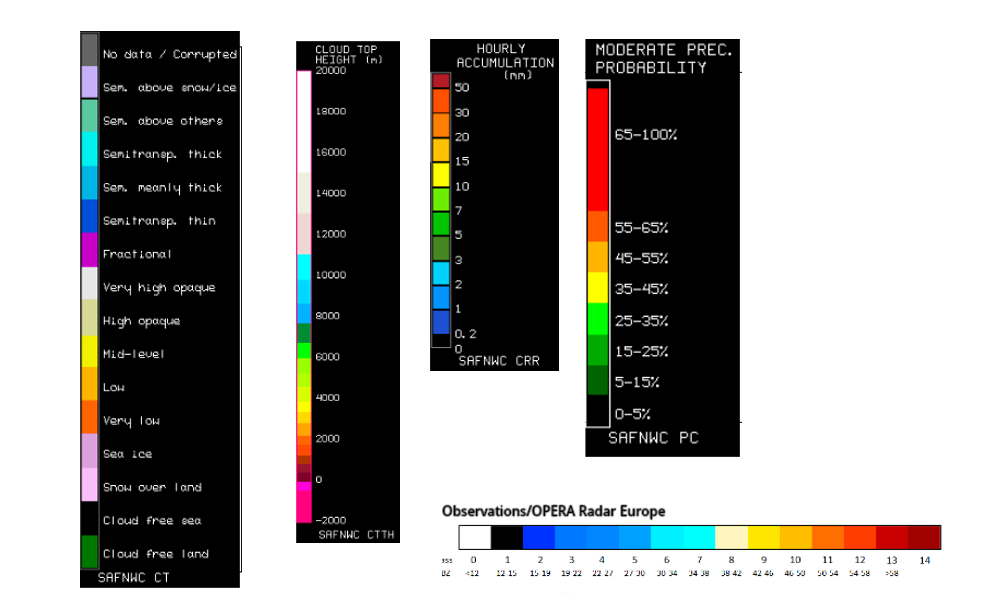
For identifying values for Cloud type (CT), Cloud type height (CTTH), precipitating clouds (PC), and Opera radar for any pixel in the images look into the legends. (link).
Over Land
| Parameter | Description |
| Precipitation |
In the summer season:
|
| Temperature |
|
| Wind (incl. gusts) |
|
| Other relevant information |
|
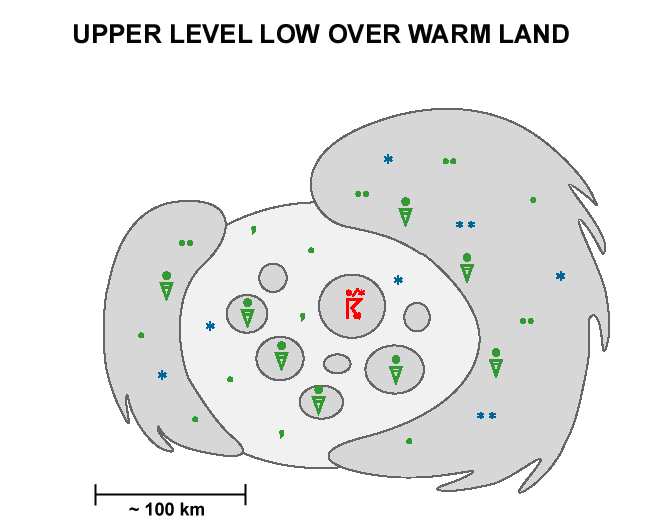
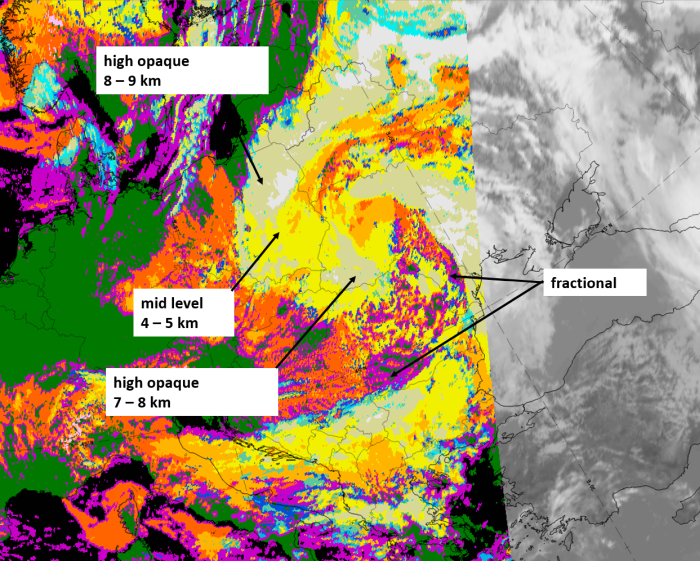
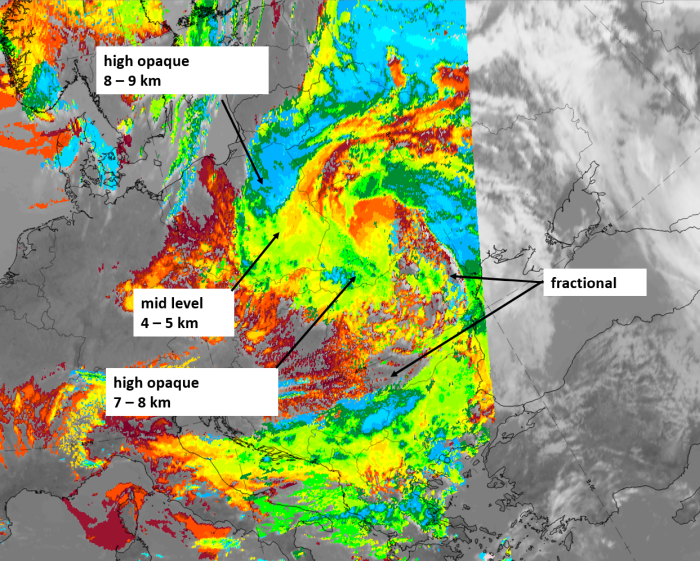
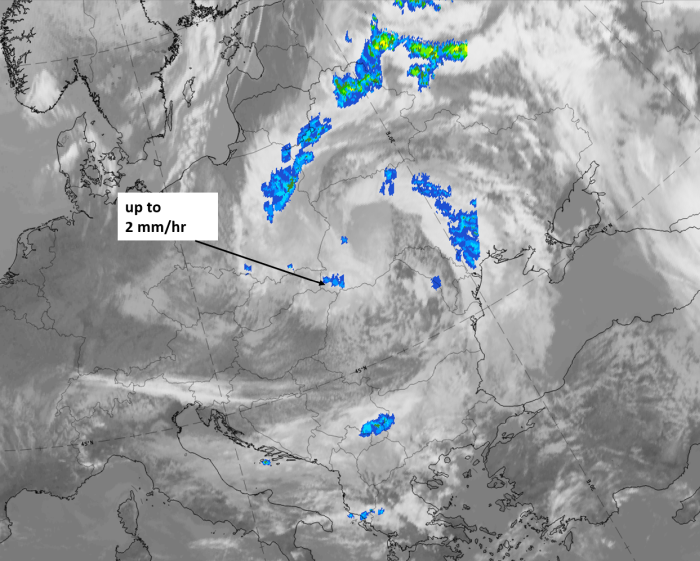
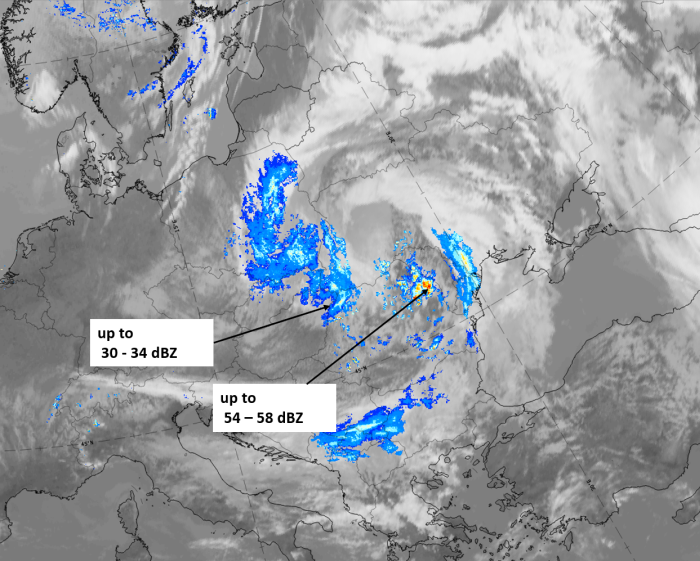
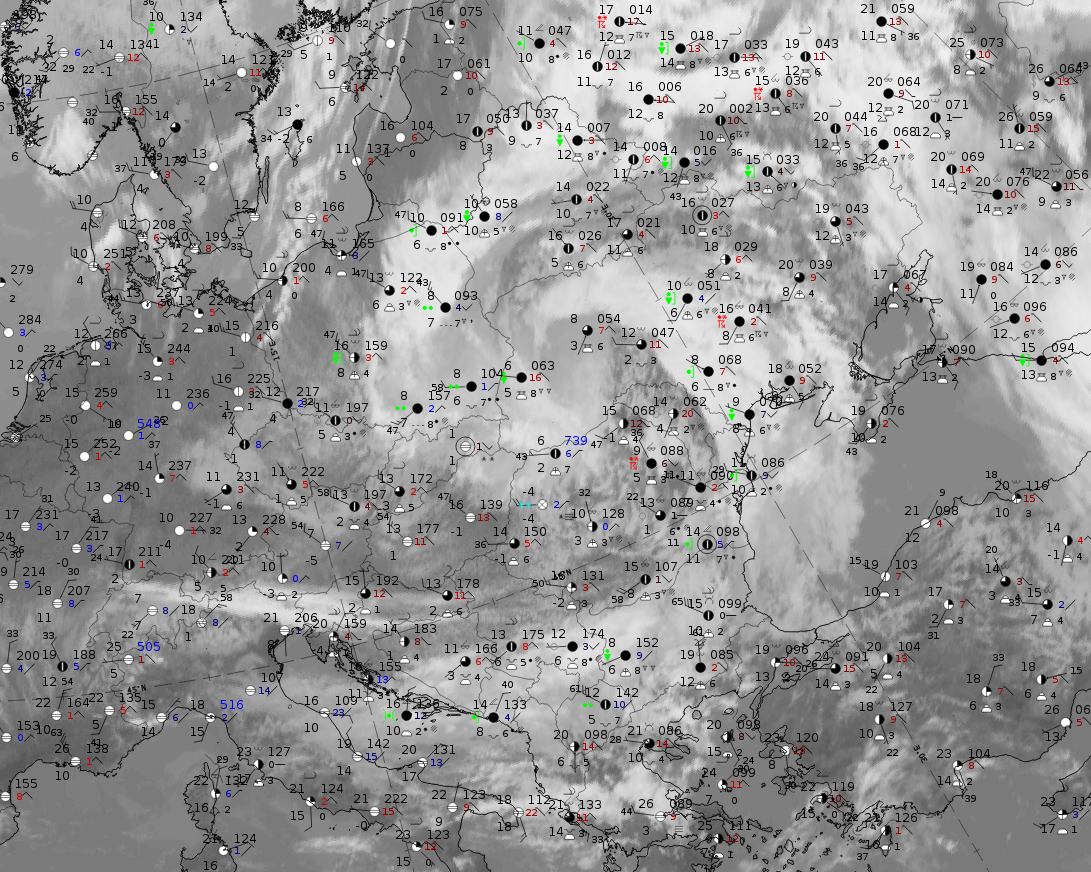
The case from 6 May 2020 at 12 UTC, described in detail in the chapter "Appearance in satellite images" over Central Europe, can be used as an example for a cut-off low over land. The IR image below shows the two cyclonically curved cloud bands around the cut-off low centre which is at least partly filled with dense low-level cloud over Eastern Poland and Western Ukraine. More eastwards, cellular cold air cloud does exist in the mostly cloud free area.
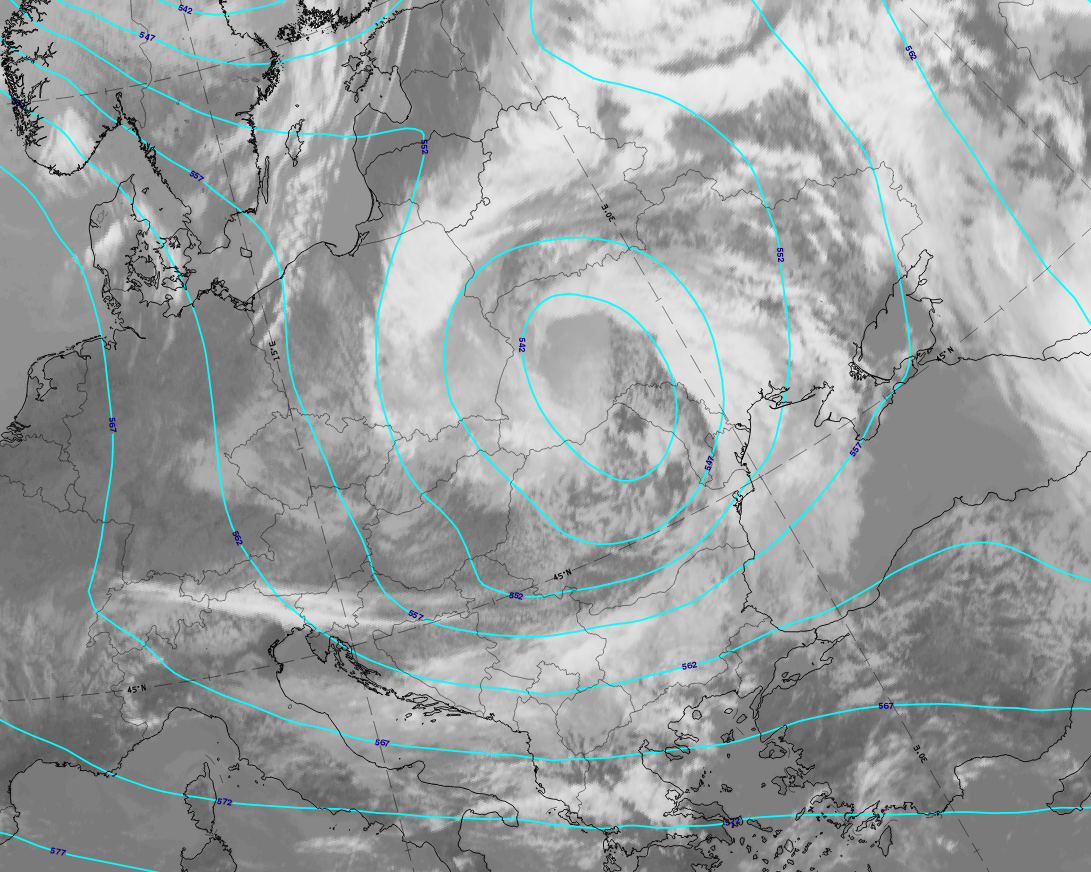
6 May 2020 at12 UTC: IR; cyan lines: height contours 500 hPa.
|
|
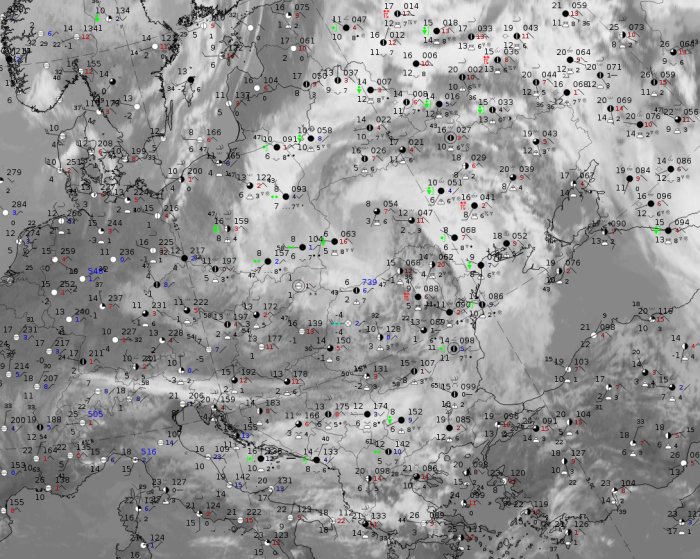
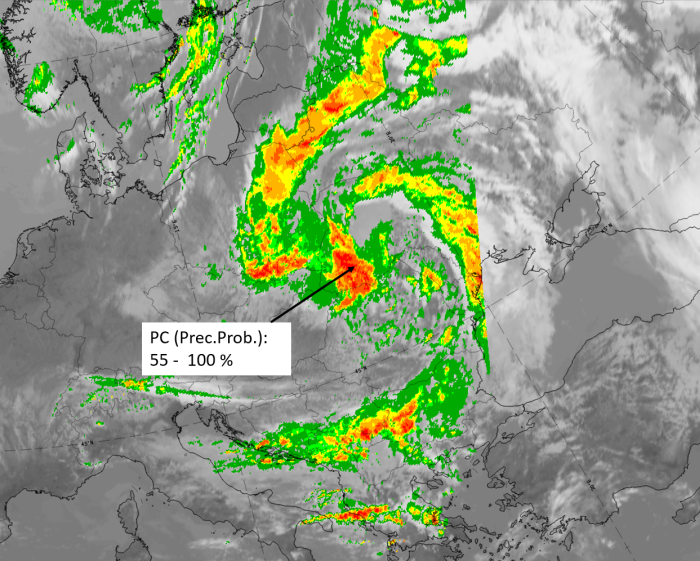
Note: for a larger SYNOP image click this link.
The overcast part of the cut-off low over Eastern Poland and Western Ukraine show rain as well as showers and Cbs which are superimposed. East of this, there are isolated Cbs and thunderstorms. The probability of moderate precipitation computed by NWCSAF diagnoses very high values for the overcast part in the cut-off low centre.
|
|
|
|
Legend:
6 May 2020 at 12 UTC, IR ; superimposed:
u.l.: Cloud Type (CT NWCSAF); u.r.: Cloud Top Height (CTTH - NWCSAF); l.l.: Convective Rainfall Rate (CRR - NWCSAF); l.r.: Radar intensities from Opera radar system.
For identifying values for Cloud type (CT), Cloud type height (CTTH), precipitating clouds (PC), and Opera radar for any pixel in the images look into the legends. (link).
Special investigation of DANA cases
In the chapter “Weather events” for the CM “ULL”, a distinction between cases over land and cases over ocean is made. The case for “over the sea” shows a situation in the southwest of the Iberian Peninsula between Portugal and Morocco. This case is not a representative DANA situation because the cut off process started already over the western or southwestern Atlantic while moving to the south in the direction of Morocco where the ULL is already cut off.
The figures below show synoptic observations and radar images from the Opera system. For further information the Dust RGB as well as the Sandwich product image is presented. The latter is especially interesting for detection of convective cells and their severity.
Trough stage
 |
 |
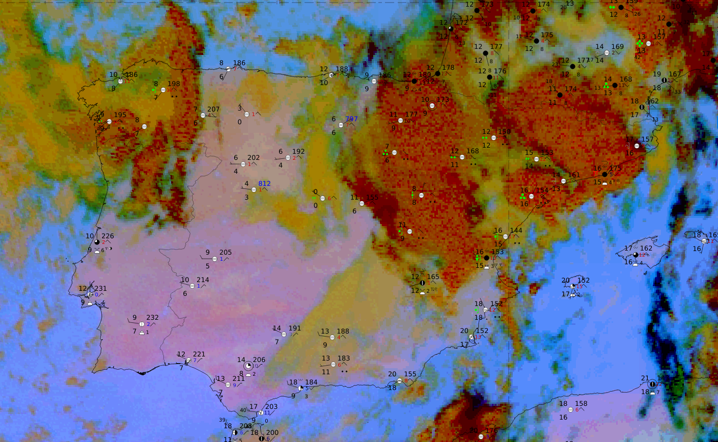 |
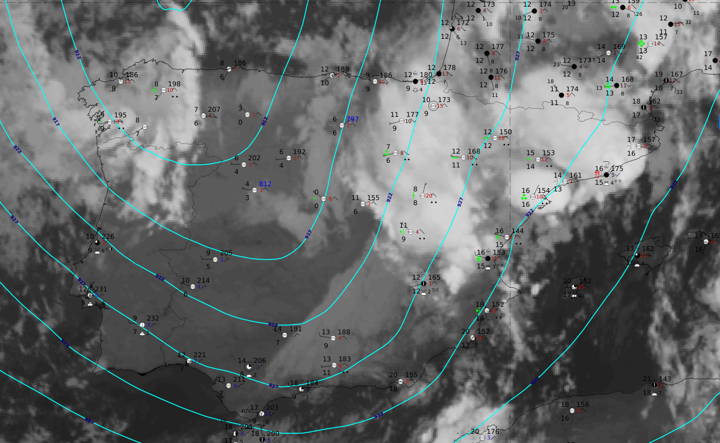
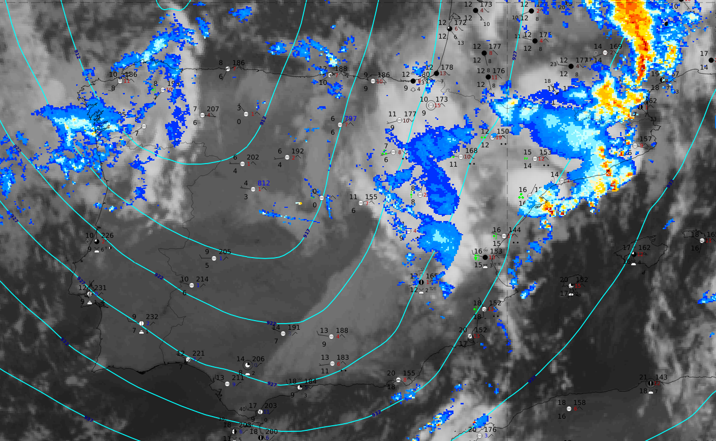
Fig 9:
26 October 2024, 00UTC: trough stage.
Top: IR, geopotential height at 300 hPa, synoptic observations; middle (in addition to top): Opera radar; bottom: Dust RGB, synoptic observations.
In the trough stage of this case most of the cloud system is at the leading side over northeastern to southeastern Spain. These clouds are to a high degree precipitating ice clouds, with many synoptic stations reporting rain. There are also some clouds over northwestern Spain and northern Portugal, which is at the rearward side of the trough. This area shows more mid-level cloud fields with only weak rain reported.
Tear off stage
 |
 |
 |
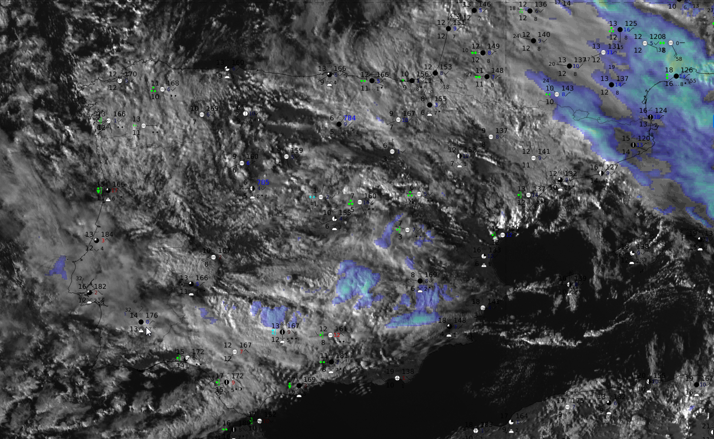 |
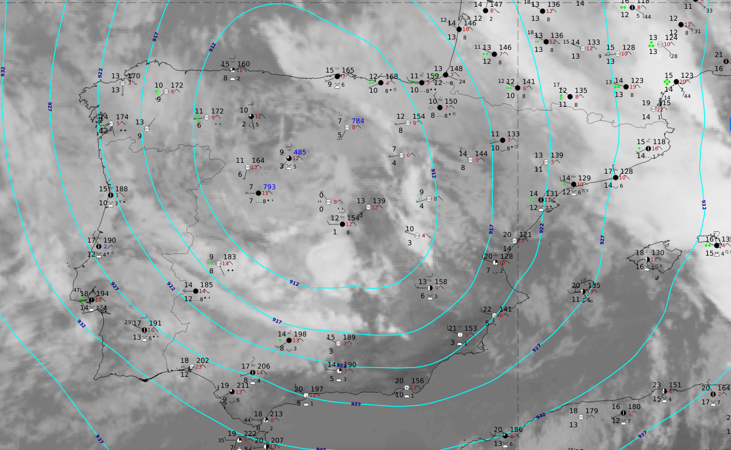
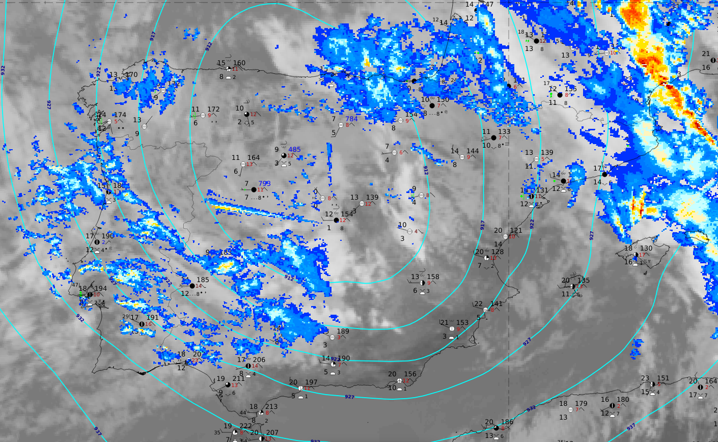
Fig 10:
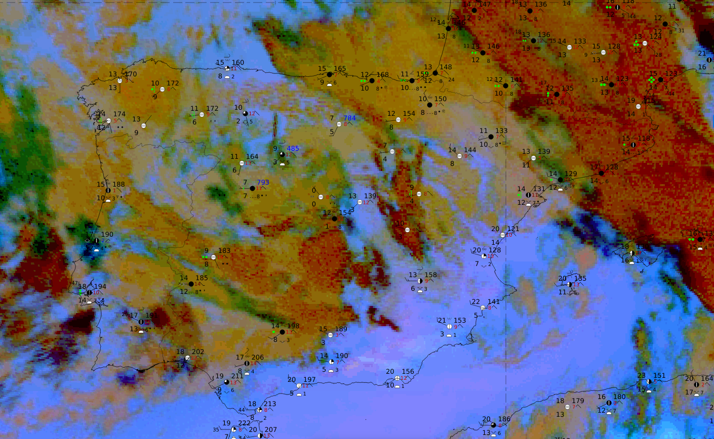
26 October 2024, 12 UTC: tear off stage.
Top: IR, geopotential height at 300 hPa, synoptic observations; second (in addition to top): Opera radar; third: Dust RGB, synoptic observations; bottom: Sandwich product, synoptic observations.
In this tear off stage, with the centre of the ULL over central Spain, band-like features have formed at both boundaries of the very large ULL with thicker cloud and more precipitation at the leading part over northeastern Spain. The centre of the ULL over central Spain is nearly filled with midlevel cellular cloud and there are no notable rain occurrences. The cloud band at the rear side from the middle of Portugal into southern Spain also shows some cells with thicker cloud and some rain events.
The development of two cloud bands at the baroclinic boundaries of a ULL in the tear off stage can be observed in several cases but quite often the band at the rear side dissolves, as occurs in this case.
Cut off stage
 |
 |
 |
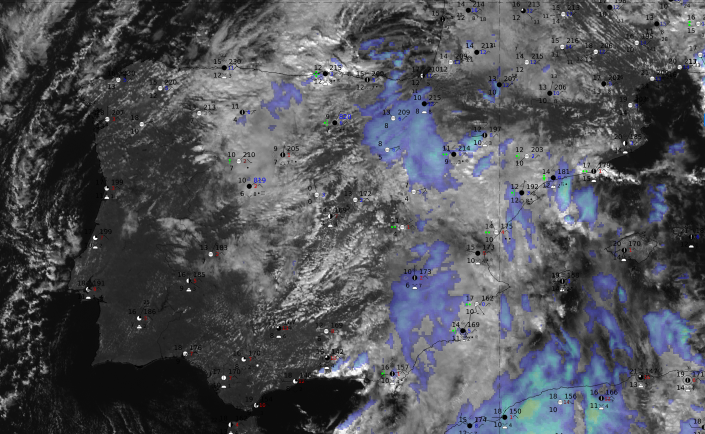 |
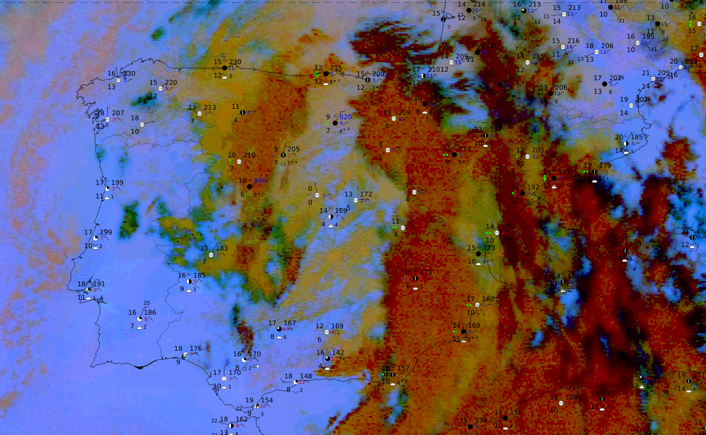
Fig 11:
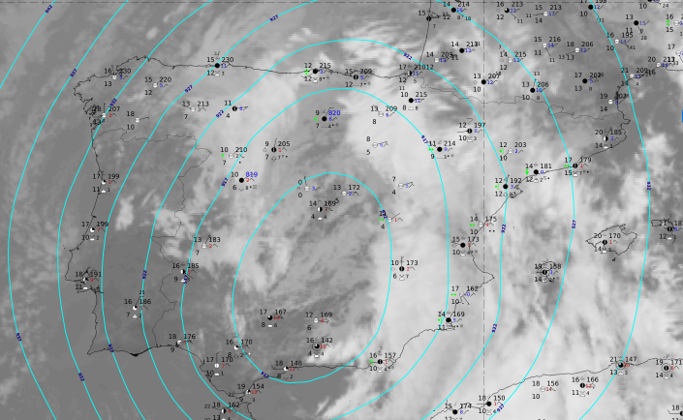
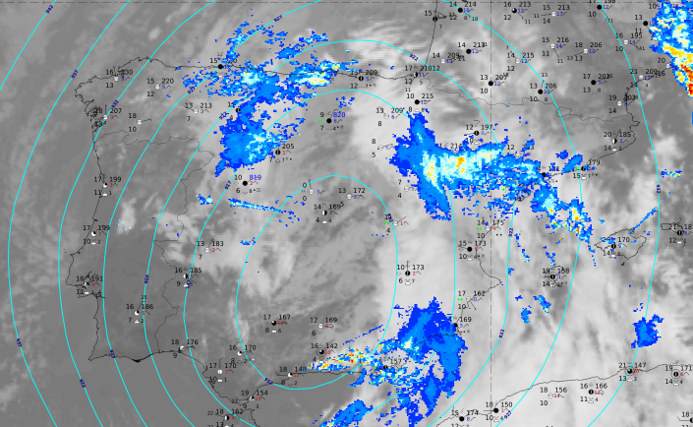
27 October 2024, 12UTC: cut off stage.
Top: IR, geopotential height at 300 hPa, synoptic observations; second (in addition to top): Opera radar; third: Dust RGB, synoptic observations; bottom: Sandwich product, synoptic observations.
Between the tear off and cut off stages of this DANA case the cloudiness at the leading side, which covers the whole eastern part of Spain, has increased tremendously and there were widespread rain reports in this area. The rearward side, which is relevant for Portugal, has cleared up in large parts. The Dust RGB shows large areas with ice cloud and there is also a distinct radar signal within the eastern cloud band.
Renewed cut off stage after two days
As already mentioned, the DANA system then moved during the following two days southward to Morrocco and then backward again with even more intense cloud and rain, leading to weather warnings of the highest severity.
 |
 |
 |
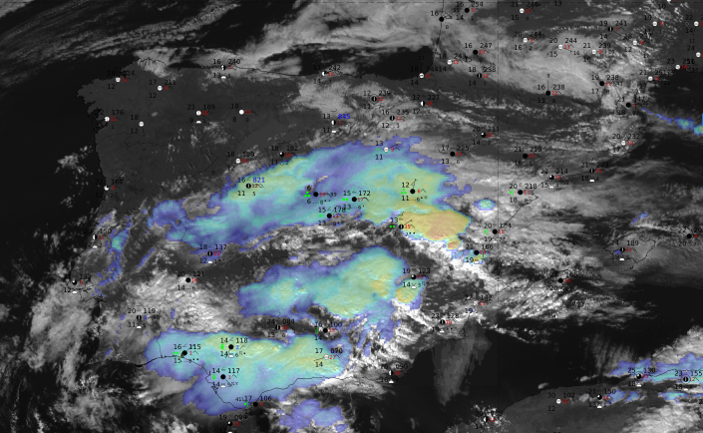 |
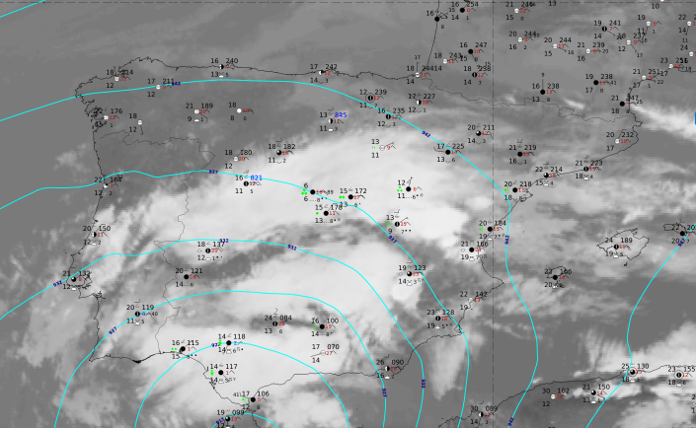
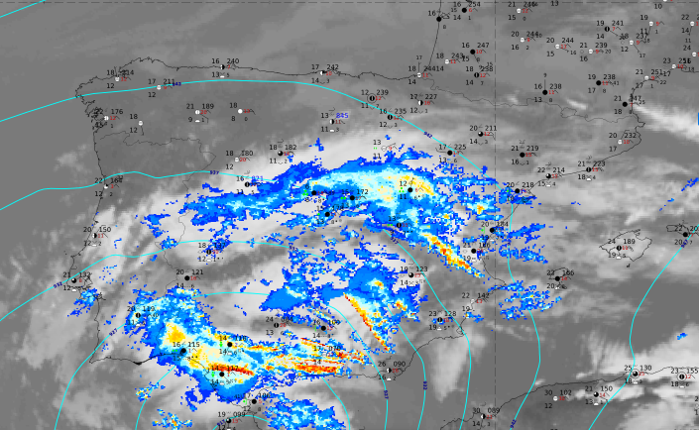
Fig 12:
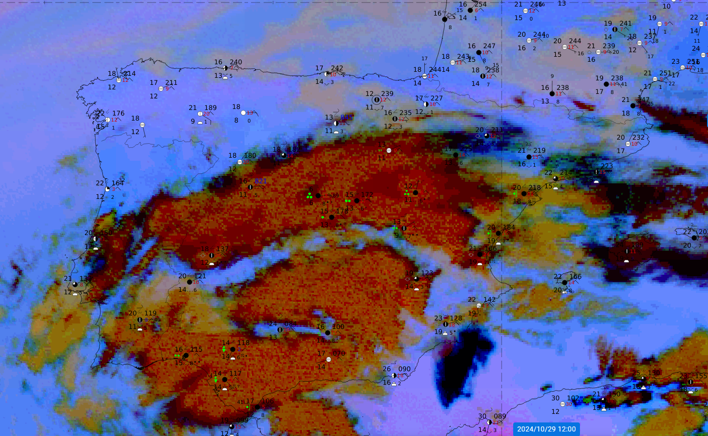
29 October 2024, 12 UTC: cut off stage—DANA.
Top: IR, geopotential height at 300 hPa, synoptic observations; second (in addition to top): Opera radar; third: Dust RGB, synoptic observations; bottom: Sandwich product, synoptic observations.
These weather images represent the situation two days after the cut off DANA stage and after the movement back to the south of Spain. Intense cloud systems have also developed at the leading side of the very large system over southern and southeastern Spain, with nearly all synoptic stations reporting rain and large and thick convective cells. These can be identified especially clearly in the Sandwich product, with a mesoscale convective system (MCS) over the region of Valencia between approximately 05 and 09 UTC. Thunderstorms and intense rain were reported from nearly all stations in Andalusia, with the most intense reported from stations to the west of Valencia and north of Andalusia.
The weather situation at the time of the catastrophe
 |
 |
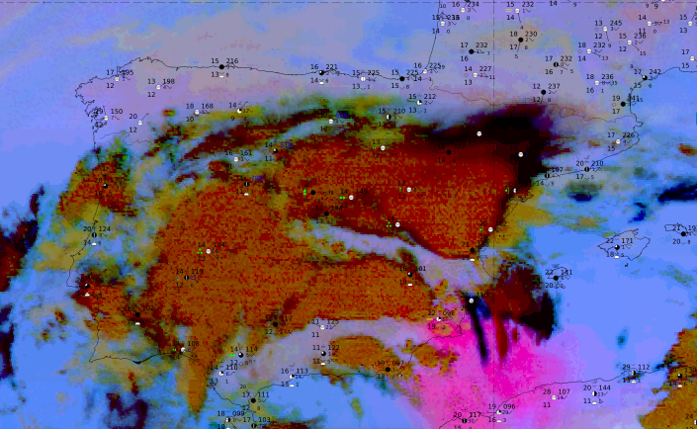 |
Fig 13:
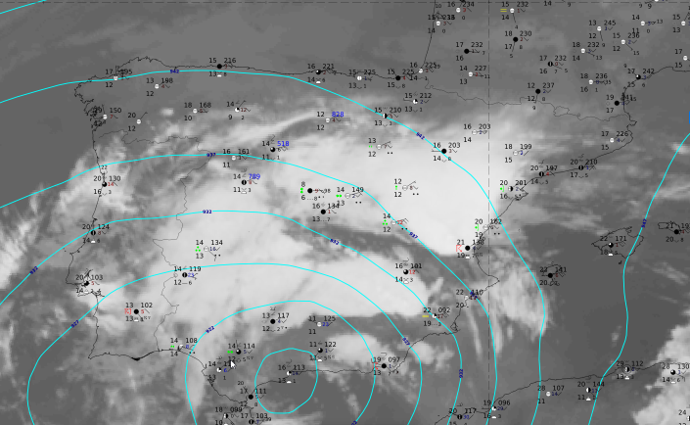
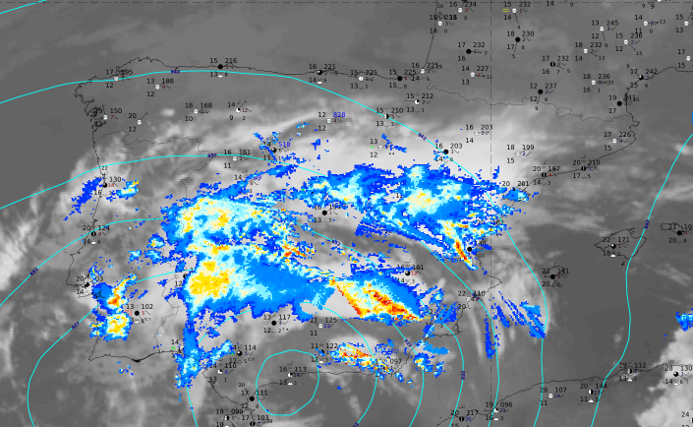
29 October 2024, 18 UTC: cut off stage—DANA.
Top: IR, geopotential height at 300 hPa, synoptic observations; second (in addition to top): Opera radar; bottom: Dust RGB, synoptic observations.
This is the time when the weather catastrophe occurred in Valencia and all the panels reflect the extremely dangerous meteorological situation. At this time (18 UTC) it is possible to identify the V-shape of a second MCS that has been affecting the area of Valencia the whole afternoon.
Also remarkable is the rose-coloured area in the Dust RGB between the North African and southeastern Spanish coasts. It can be regarded as sign of Sahara dust, which is brought into the atmosphere through intense upward motion.
In addition to the images above an hourly loop over the whole day of 29 October shows clearly the link to two MCSs lasting around 6 hours each, the first one during the morning (05–10 UTC) moving westward and the second one in the afternoon (14–20 UTC).
In many scientific investigations of this catastrophe, it can be read that this DANA situation was extraordinarily intense but that also other local meteorological, hydrological and orographic conditions were significant in developing a severe meteorological state into an incredibly catastrophic situation.