Table of Contents
Cloud Structure In Satellite Images
Upper Level Lows are relatively long-lived (mostly from 2 to 10 days) phenomena. Their life cycle consists of three stages:
- Upper level trough
- Tear-off
- Cut-off
- Final stage
1. Upper level trough stage
There is a pronounced upper level trough behind a frontal zone.
Appearance in the basic channels:
- In IR10.8 images, a white or light grey cloud band is connected to the frontal zone on the leading side of the trough, while some thin white cloud stripes due to Cloud Fibres exist on the rearward side. There may possiblybe some convective white cells around the axis of the trough.
- In VIS0.6 images, a white or light grey cloud band is connected to the front on the leading side of the trough. Some convective white cells may exist around the axis of the trough.
- In WV6.2 images, light grey bands occur on the leading and rear part of the trough.
Appearance in the basic RGBs:
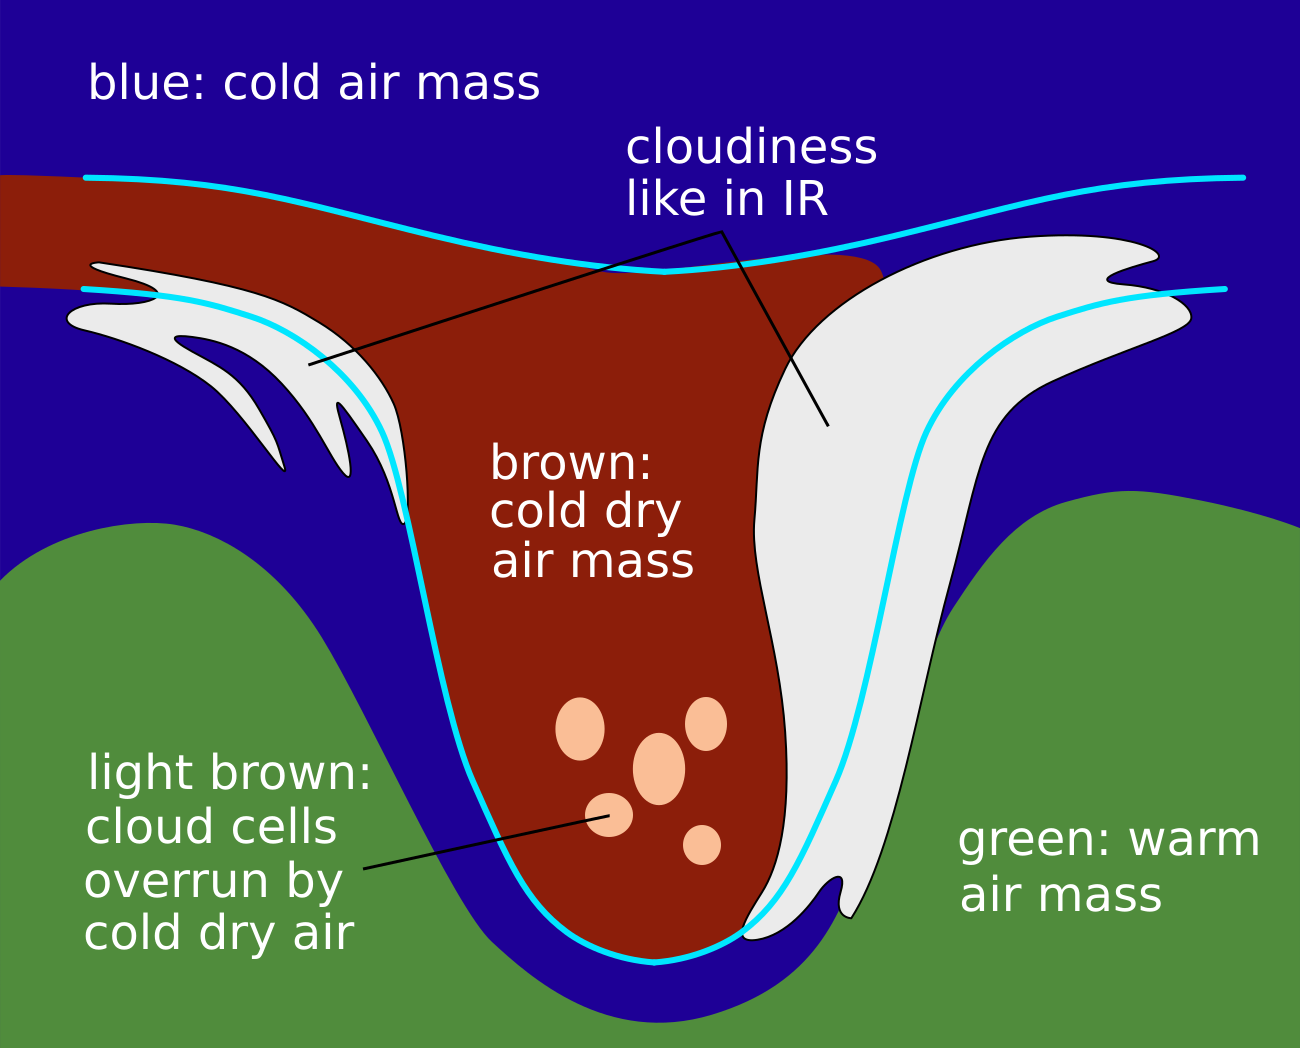
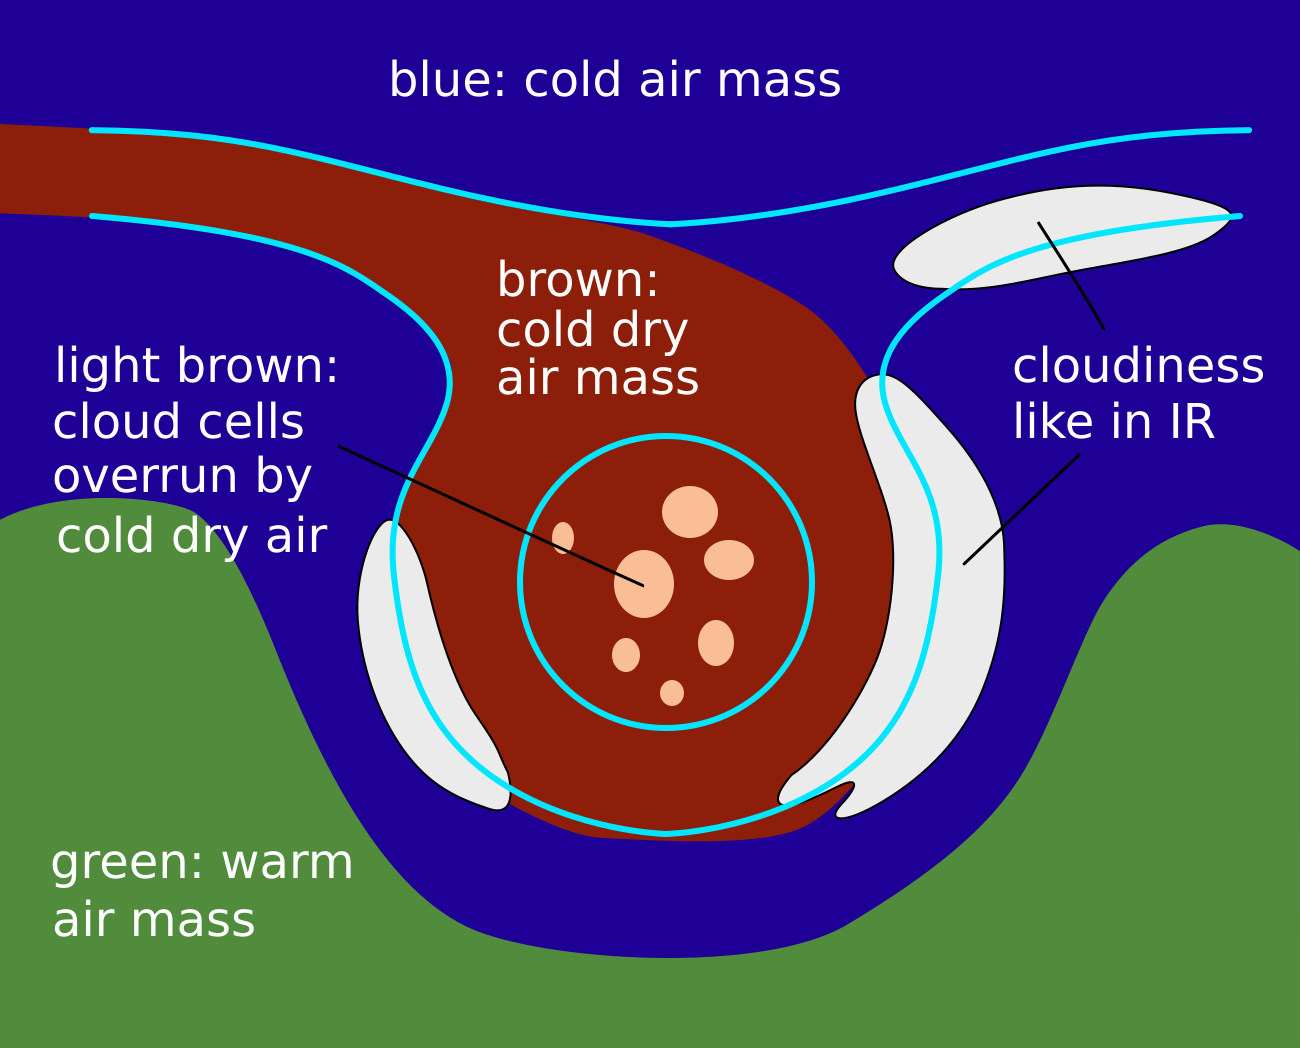
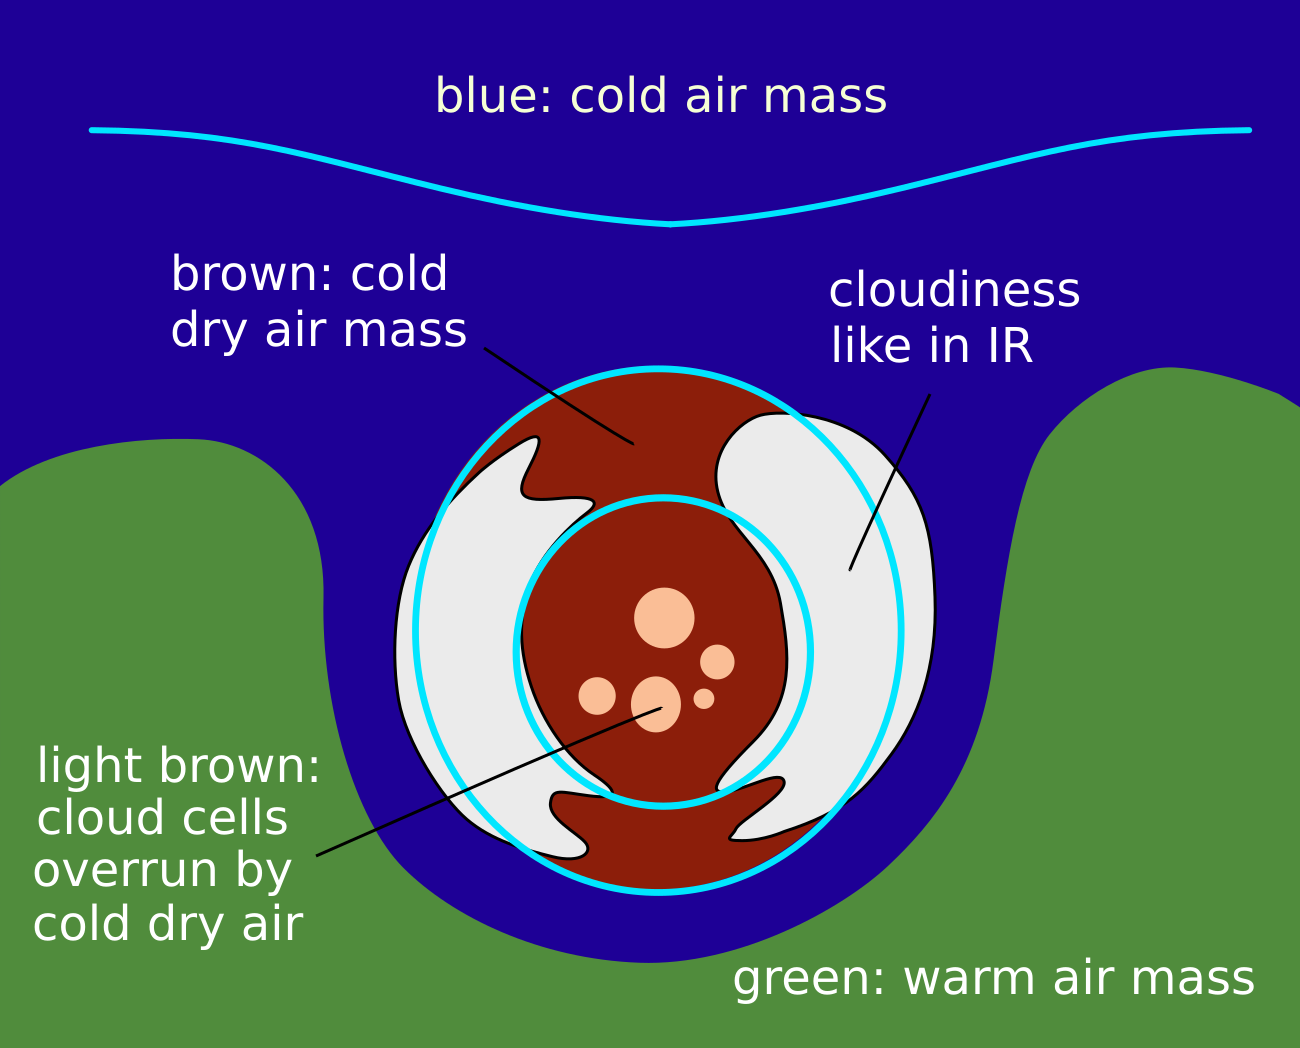
Airmass RGB:
The most important phenomenon here is the dark brown colour within the trough, indicating the cold and dry air there. Cloud bands and fibres at the boundaries of the trough, as well as possible cloud cells within the trough centre, are very similar to IR.
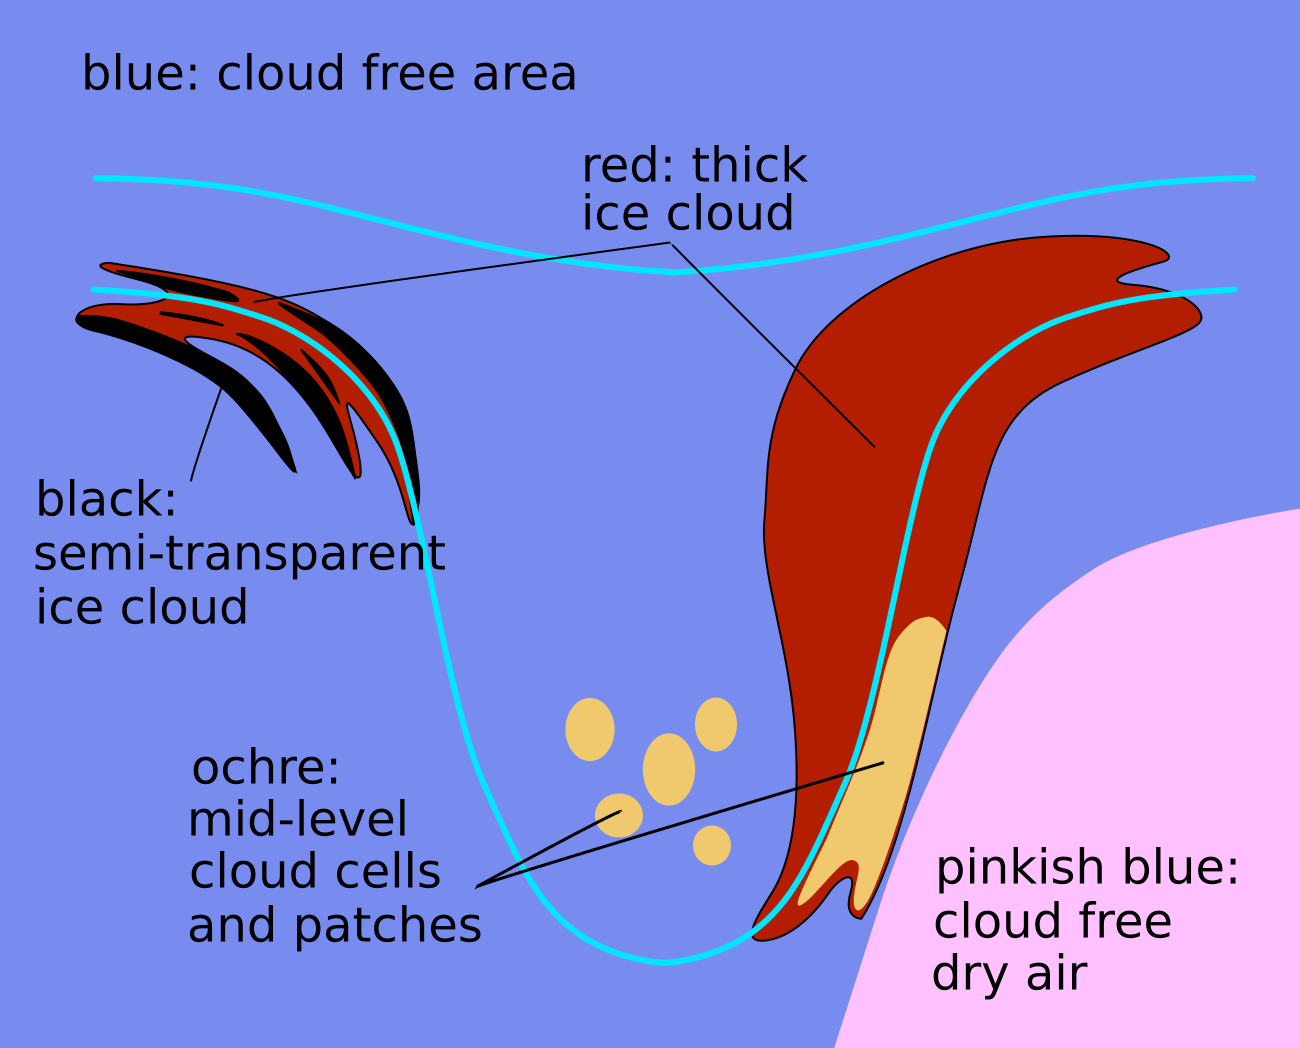
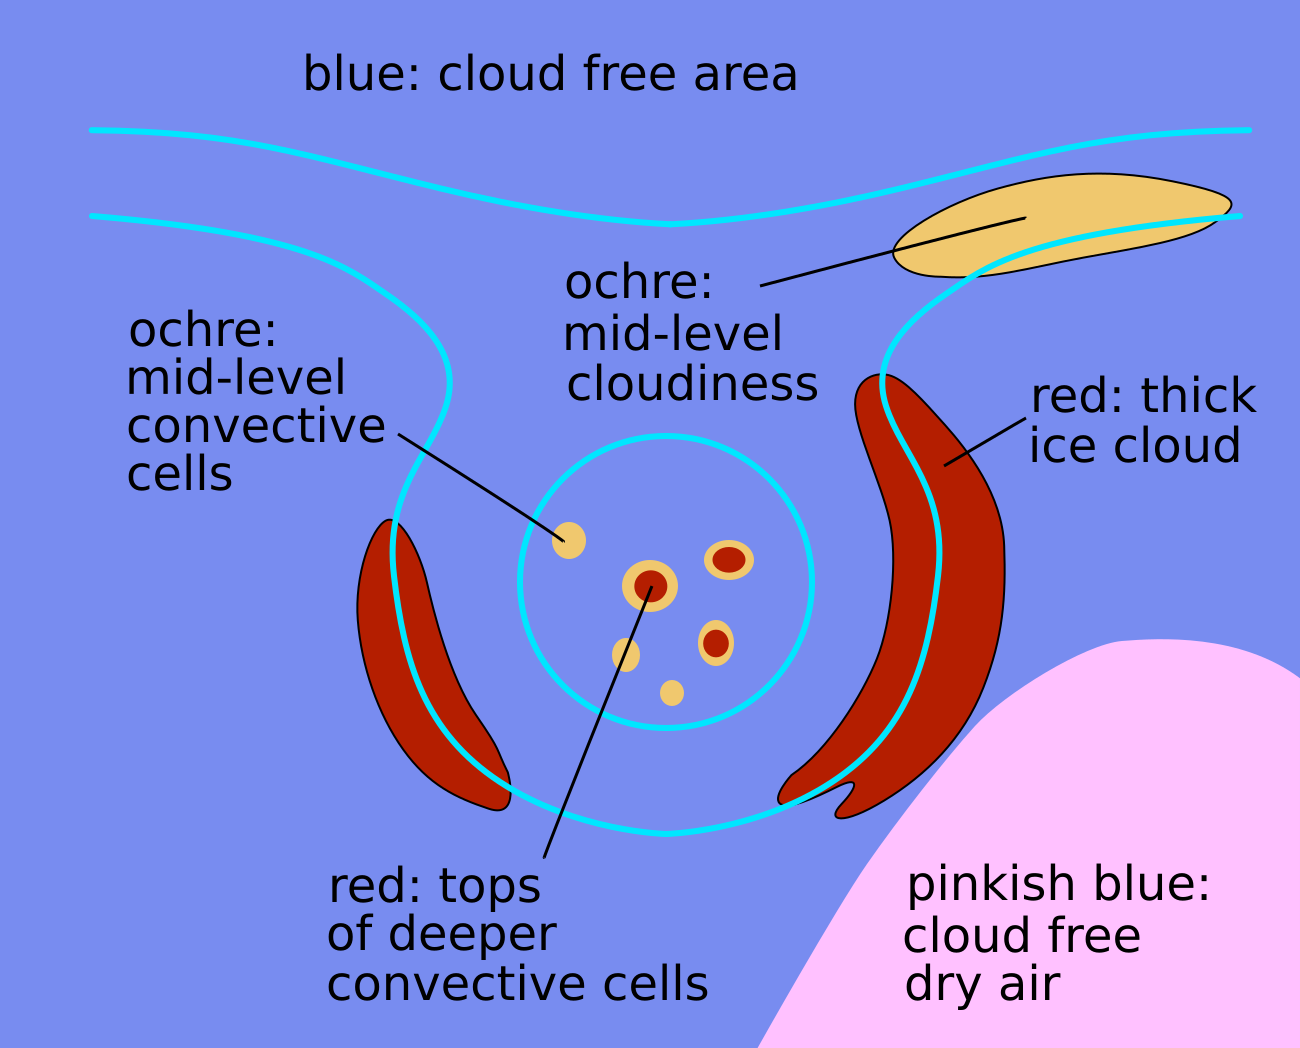
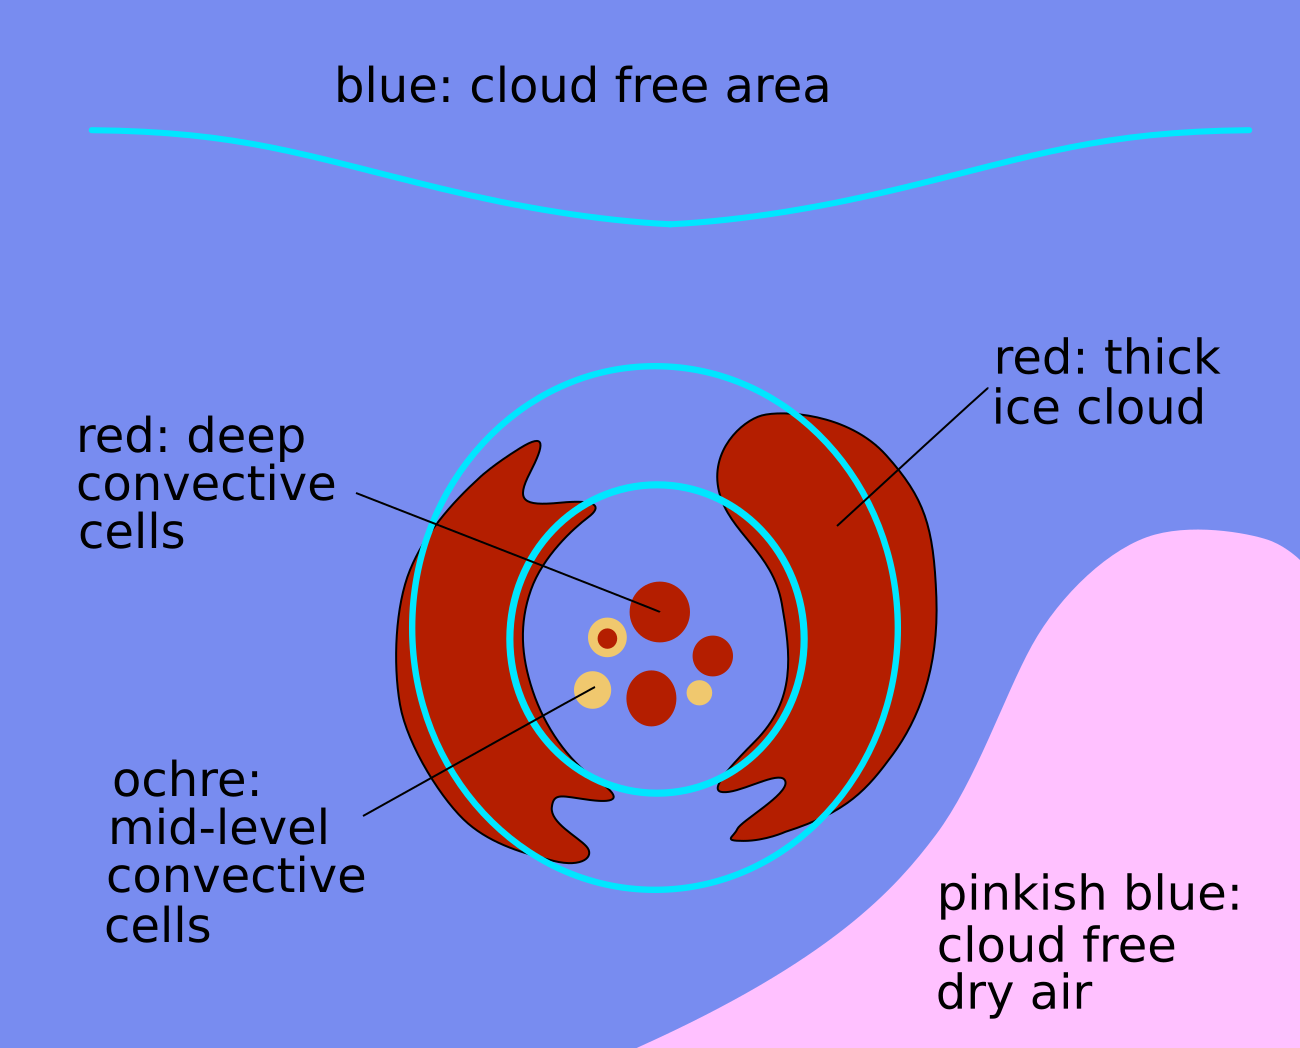
Dust RGB
The cloud free areas within the trough show blue to pinkish blue colours, while the cloud band at the leading side of the trough usually exhibits dark red colours, indicating thick ice cloud. If clouds exist at the rearward side, it can vary from dark red to black depending on the thickness of the ice clouds there. If there is already cold air cloudiness in the trough centre, this stage of the cut off process usually results in ochre cloud colours, indicating that the cloud-tops are low to mid-level. For cases over land in wintertime, this centre can also be filled by ochre mid-level cloud patches.
 |
 |
Legend: Cut off process: trough stage, Left: air mass RGB; right: dust RGB.
2. Tear-off
The bottom of the upper trough is detached from the main stream resulting in a closed circulation.
Appearance in the basic channels:
- In IR10.8 images, a white to light grey cyclonically curved cloud band is on the leading side of the trough - possibly also on the rear side. Some white convective cells may occur between the bands.
- In VIS0.6 images, a grey cyclonically curved cloud band exists on the leading side of the trough, possibly also on the rear side. Some white convective shells may occur between the bands.
- In WV6.2 images, a grey cyclonically curved cloud band exists around the detaching low.
Appearance in the basic RGBs:
Airmass RGB
At this stage of the cut-off process, air mass composition makeup is the same as the trough stage before: dark brown colours in the centre are concentrated in the circle-like centre and cold air cloud (if it exists) is mostly overrun by this dry air, which results in a more ochre colour. Existing cloud bands at the boundaries are similar to those in the IR channel. Often the cloud band at the rear of the former trough is only weakly developed, or is not present at all.
Dust RGB
The same as before the cloud boundaries vary between ochre and dark red; the same is true for the clouds in the centre which often start to increase in thickness.
 |
 |
Legend: Cut off process: tear-off stage, Left: air mass RGB; right: dust RGB.
3. Cut-off stage
The Upper Level Low is separated from the main upper stream.
Appearance in the basic channels:
- In IR10.8 and VIS0.6 images, white to light grey cyclonically curved cloud bands exist on the leading and rearward side of the low, later forming a spiral. Some white convestive cells may exist within it.
- In WV6.2 images, a round area or a spiral of grey clouds exist, with some white cells on the leading side.
Appearance in the basic RGBs:
Airmass RGB:
In the cut-off stage the airmass RGB is a further development of the stage before. The most pronounced feature is the dark brown colour in the cold and dry centre.
Dust RGB
The most pronounced features are the dark red, thick ice cloud in the cloud band, which are spiralling around the cut off low centre. Cold clouds in this centre are now thick, demonstrated by the dark red colour for thick ice cloud.
 |
 |
Legend: Cut off process: cut-off stage, Left: air mass RGB; right: dust RGB.
4. Final stage
The Upper Level Low merges with the main stream, or dissolves slowly while being almost stationary.
Appearance in the basic channels:
- In IR10.8 and VIS0.6 images there are light grey cyclonically curved stripes that merge with the white cloud band of a frontal zone.
- In WV6.2 images there is a dark grey area that soon disappears under the light grey area of the frontal zone.
Cut-off processes can last several days. During this long development phase, cloud features can vary a bit from the ideal schematics or show only some features from it. In the two cases shown below, typical areas for cut-off processes over Europe are shown.
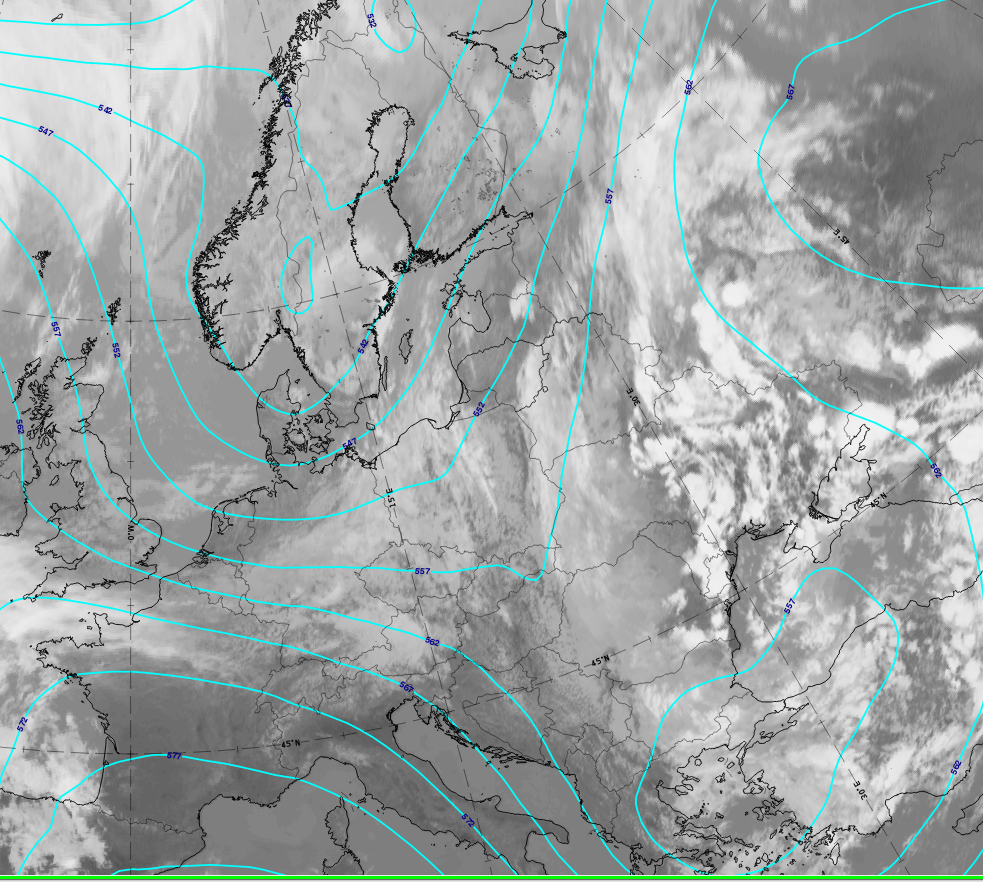
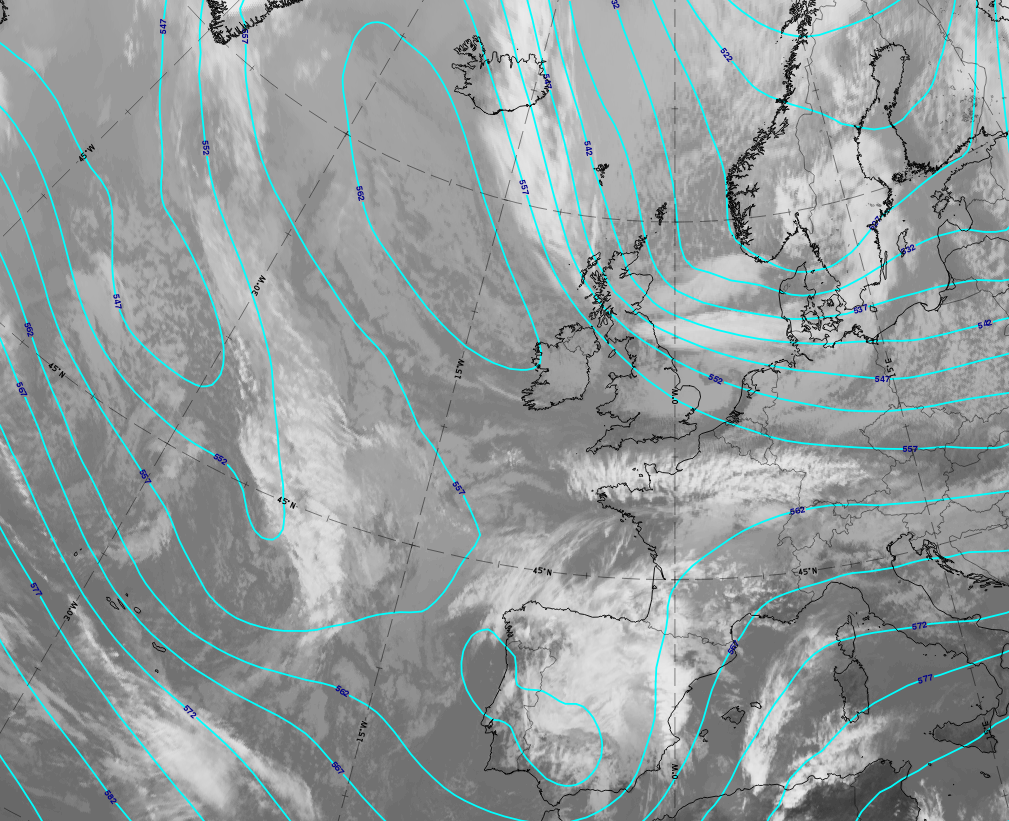
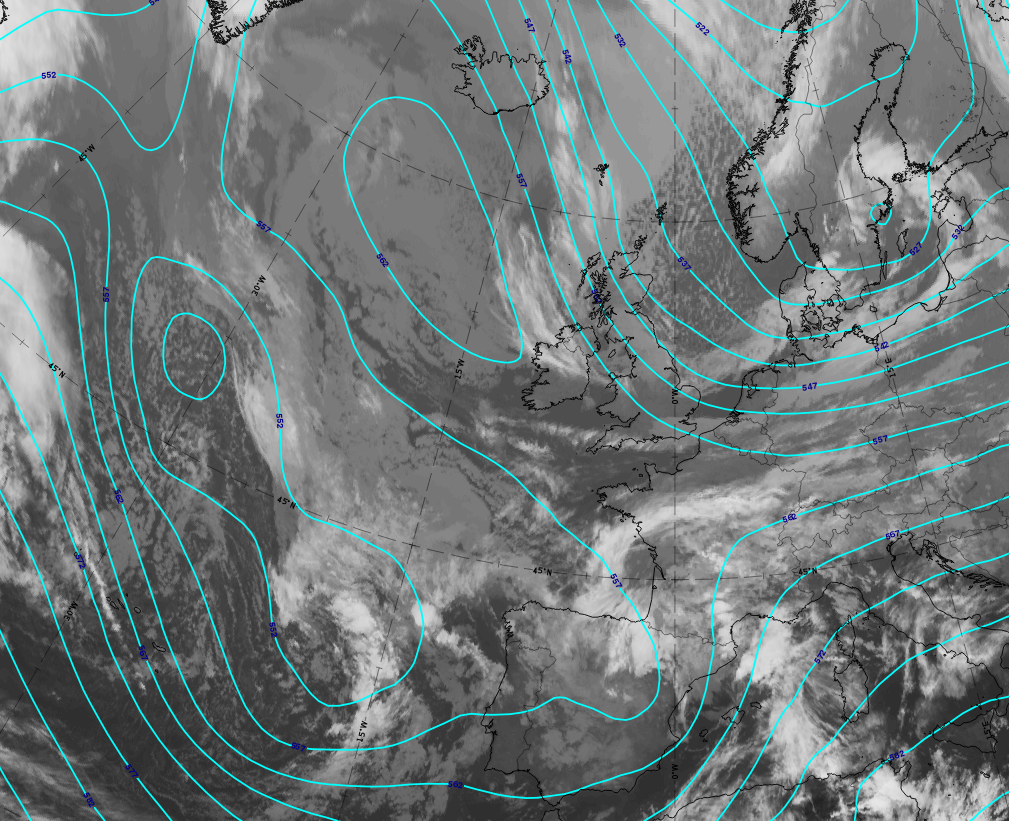
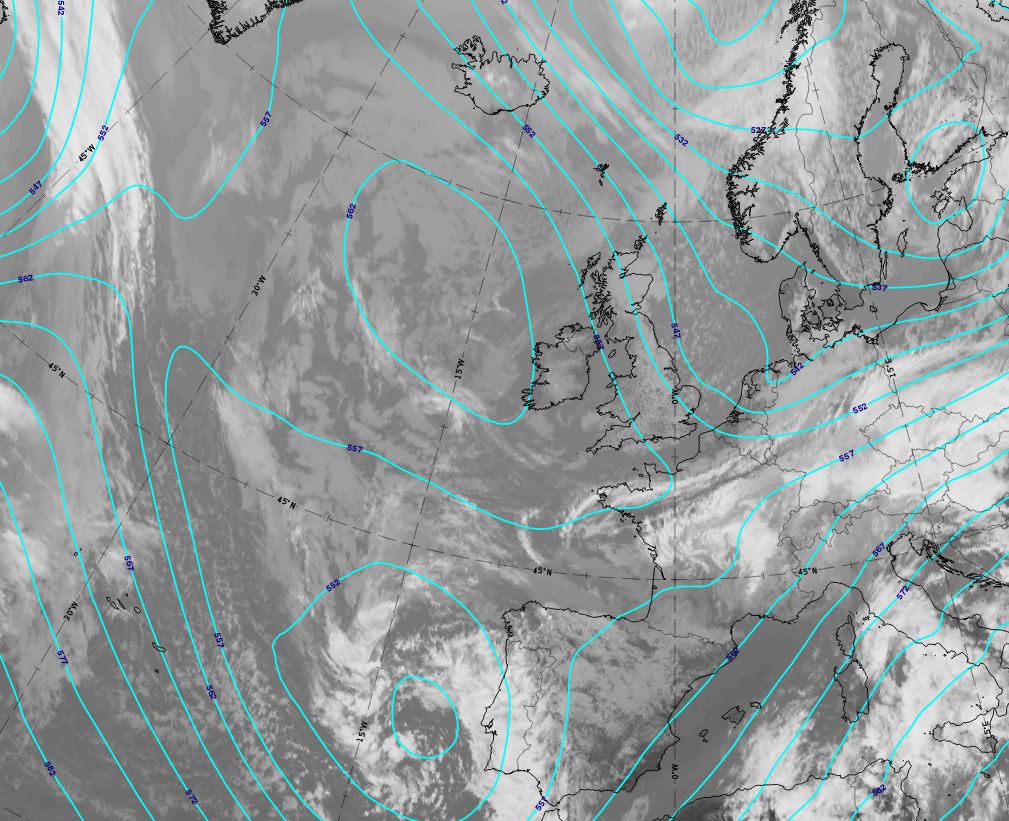
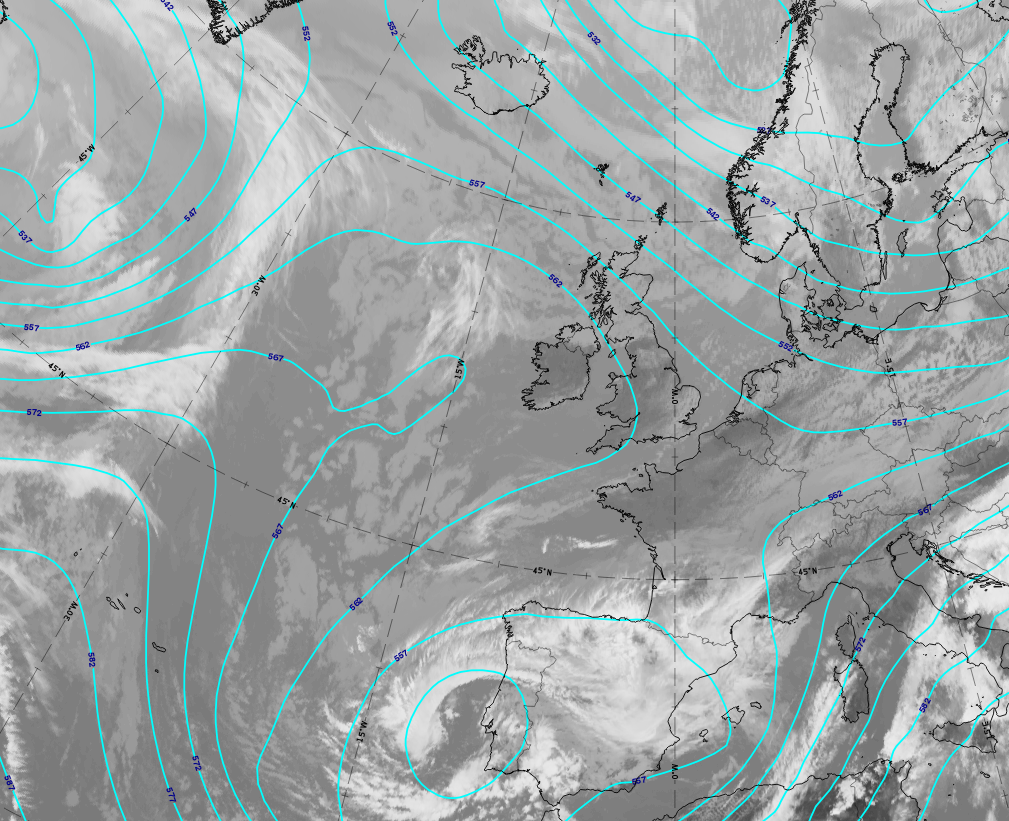
In the case of 4 - 7 May 2020 the cut-off process starts with a trough over Scandinavia which moves and develops into Central Europe. The trough and the tear off stage are accompanied by less distinct cloud features than those described for a well-developed case. However, the cut-off and final stage are very distinct.
 |
 |
 |
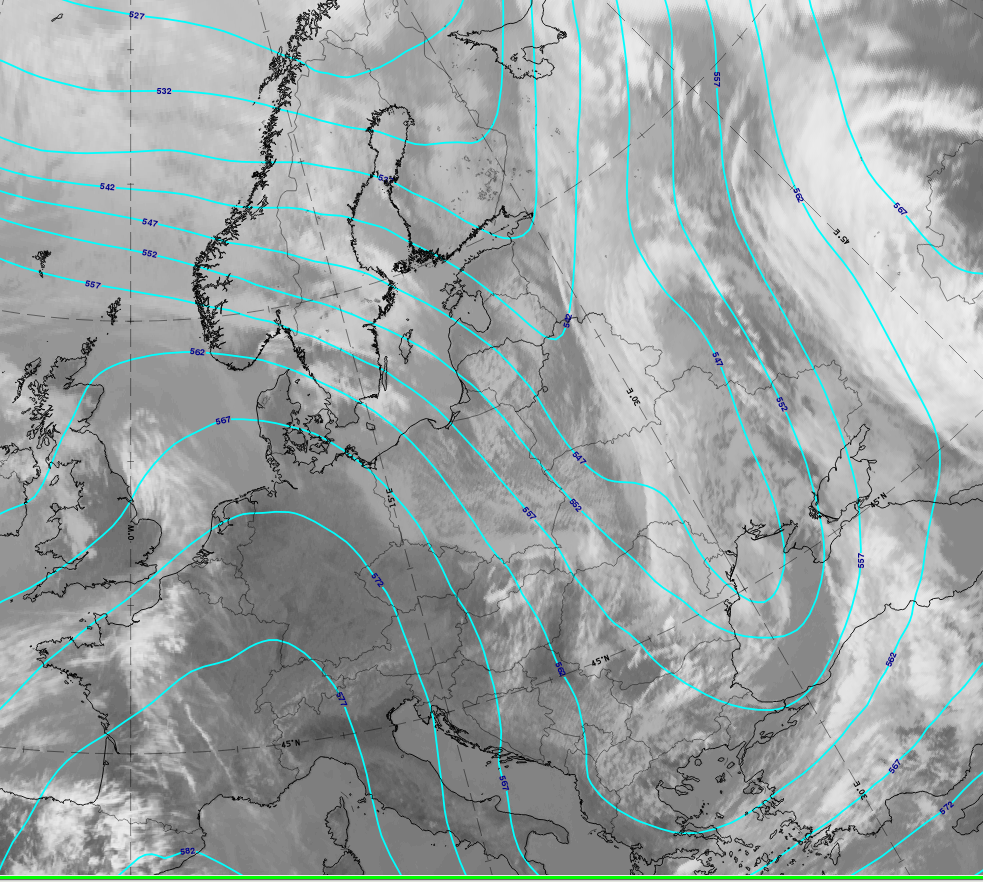 |
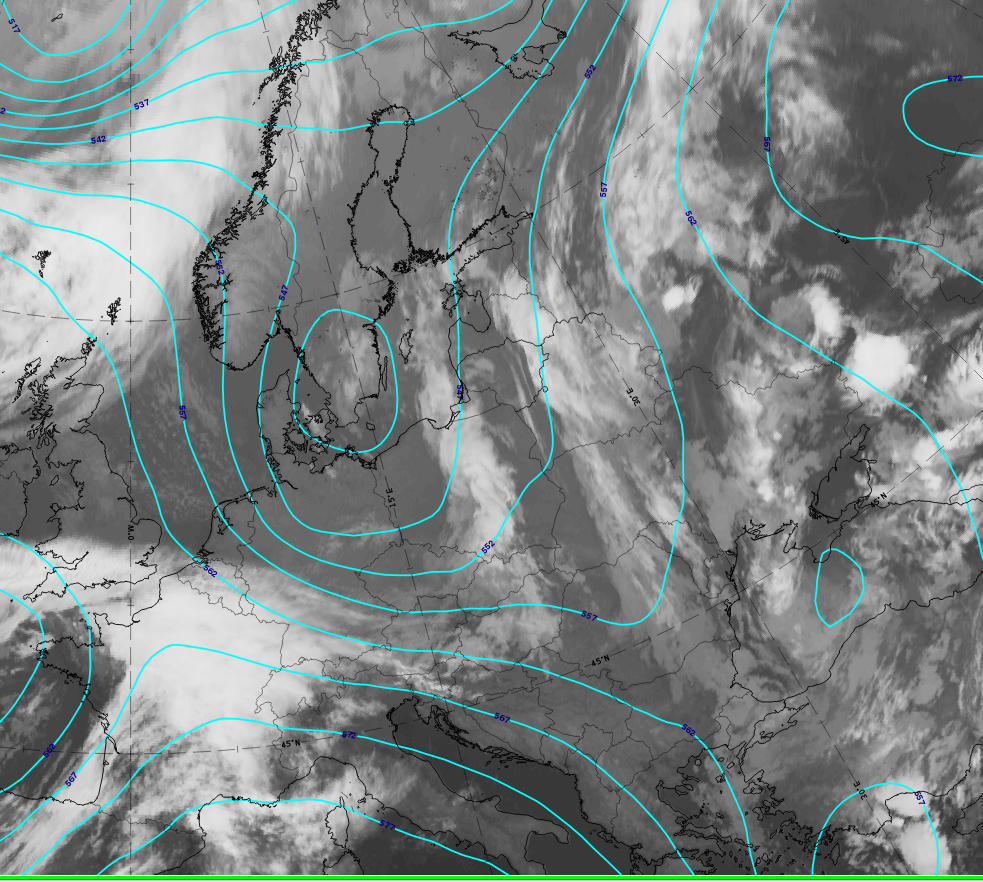
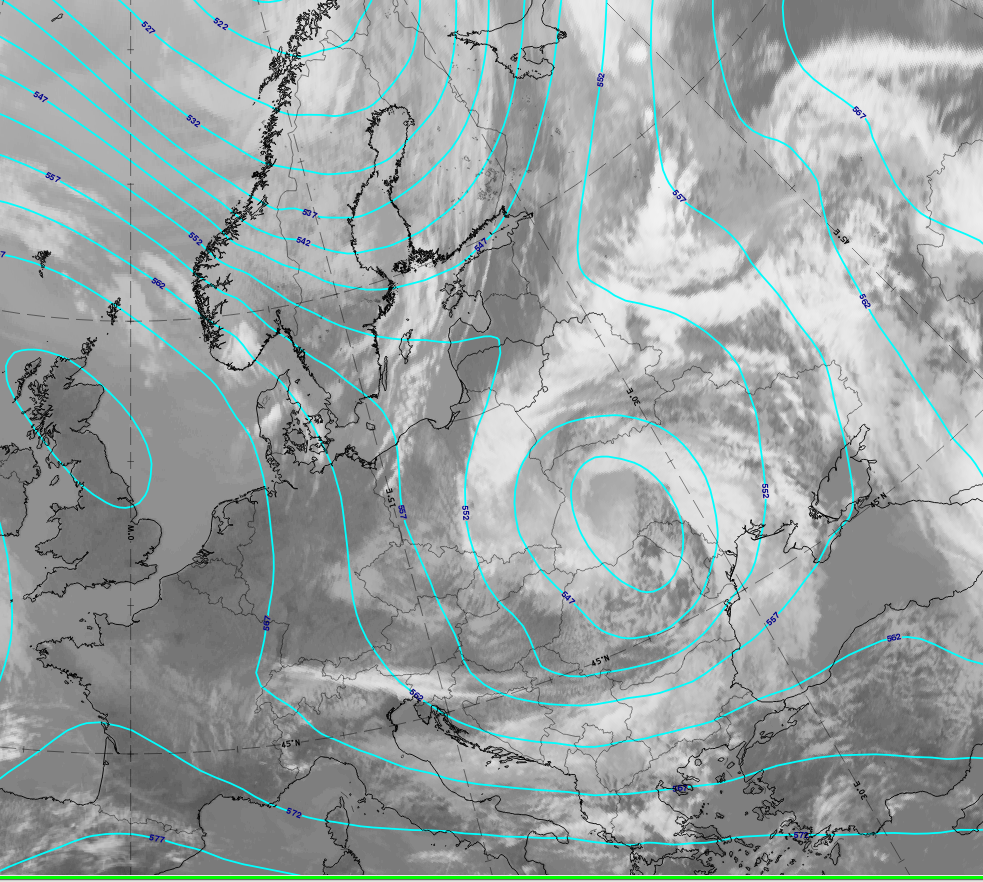
4 - 7 May 2020: cut-off process: IR; cyan lines: Height contours 500 hPa.
u.l.: 4 May at 12 UTC trough stage; u.r.: 5 May at 3 UTC tear-off stage; l.l.: 6 May at 12 UTC cut-off stage; l.r.: 7 May at 12 UTC final stage.
*Note: click on the image to access image gallery (navigate using arrows on keyboard)
The second case which is from 12 - 14 May (and continued beyond this), starts with a trough over the Atlantic and during the cut-off process this shifts to the southeast with a very well-developed cut-off stage over Spain. All stages have very pronounced cloud features but a final stage cannot be observed - the cut-off feature lasts for several days longer and thereby moves southward out of the panel frame.
 |
 |
 |
 |
12 - 14 May 2020: cut-off process: IR; cyan lines: Height contours 400 hPa.
u.l.: 12 May at 15 UTC trough stage; u.r.: 13 May at 00 UTC tear-off stage; l.l.: 13 May at 15 UTC cut-off stage; l.r.: 14 May at 12 UTC advanced cut-off stage.*Note: click on the image to access image gallery (navigate using arrows on keyboard)
The case of 4 - 7 May 2020 is chosen for demonstrating the basic channels and the basic RGBs for the typical cut-off development stages.
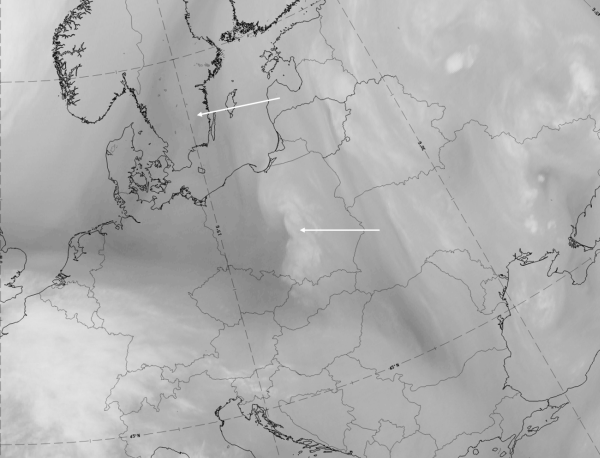
Trough stage: 4 May 2020 at 12 UTC
Frontal cloud band at the southern leading side of the trough over Germany and Poland; some cloud cells and patches in the trough centre over south Sweden; no cloud system at the rear side of the trough.
|
|

|
|

Legend:
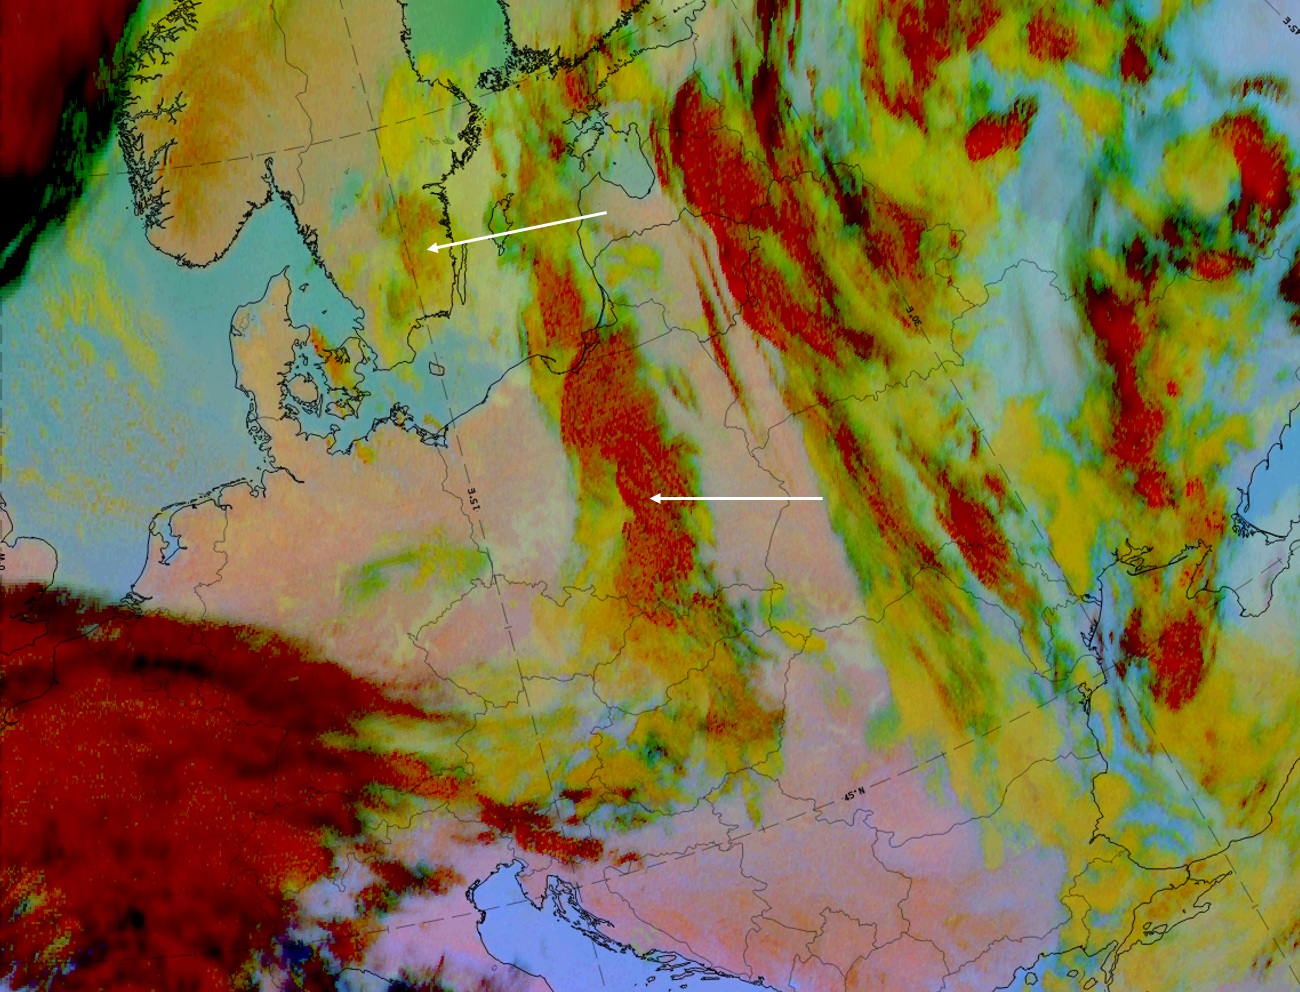
4 May 2020 at 12UTC: 1st row: IR (above) + HRV (below); 2nd row: WV (above) + Airmass RGB (below); 3rd row: Dust RGB (black arrows indicate the cloud band at the rear of the trough, as well as cold air cloudiness within the trough) + image gallery.
*Note: click on the Dust RGB image to access image gallery (navigate using arrows on keyboard).
| IR | A light grey to white cloud band exists at the southern leading side of the upper level trough. Some light grey clouds exist in the trough centre over Southern Sweden. No cloud system exists at the rear side of the trough - the next cloud system is far to the NW. |
| HRV | A white cloud band at the leading side of the trough, with white cells in the trough centre over Sweden. |
| WV | The whole area shows grey colours but not distinct band-like structures; darker grey colours exist in the trough centre over Sweden. |
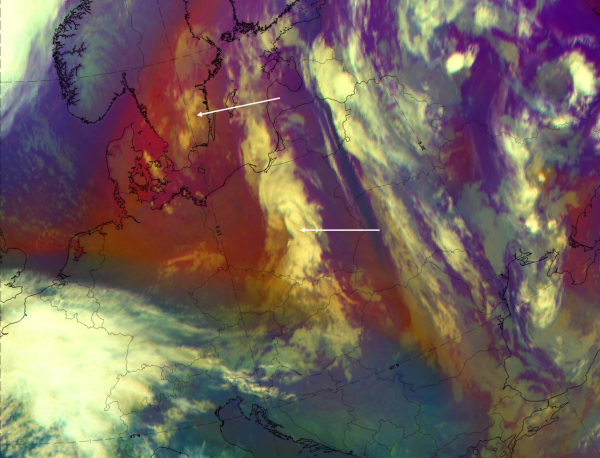
| Airmass RGB | Dark brown colours in the trough centre representing the cold and dry air; clouds at the leading side are overrun by cold air (blue colours) in the south and cold and dry air (brown colours) to the north. |
| Dust RGB | A cloud band at the leading side is mostly ochre in colour, representing mid-level cloud. Some fibres also exist. |
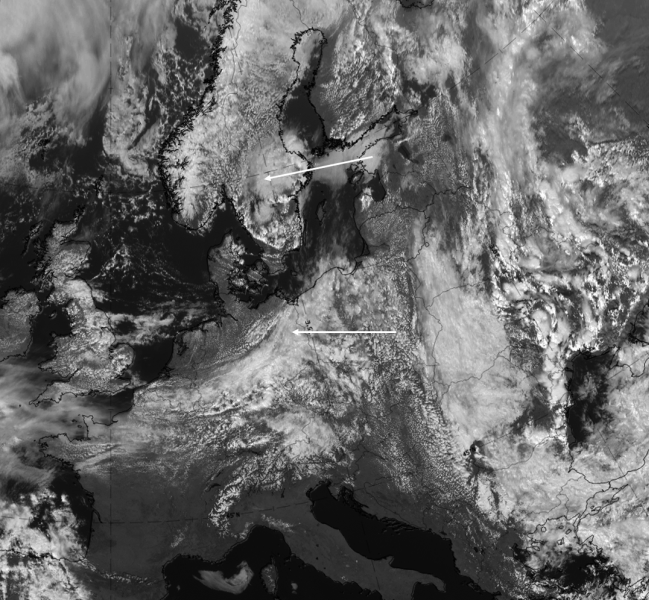
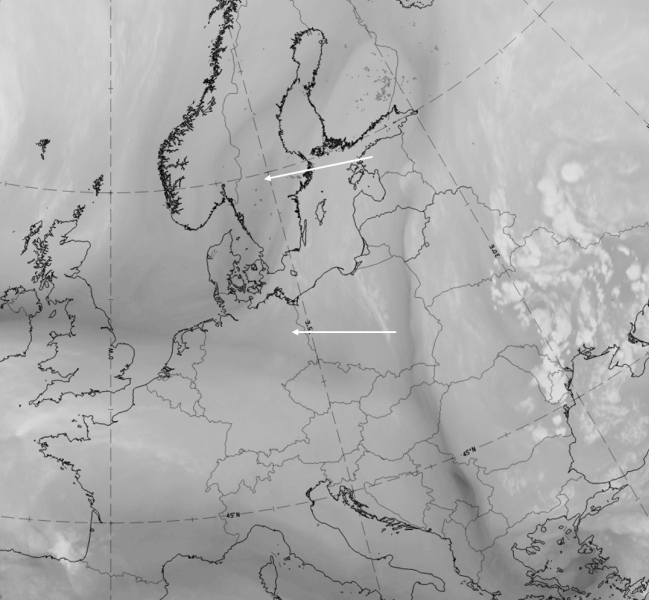
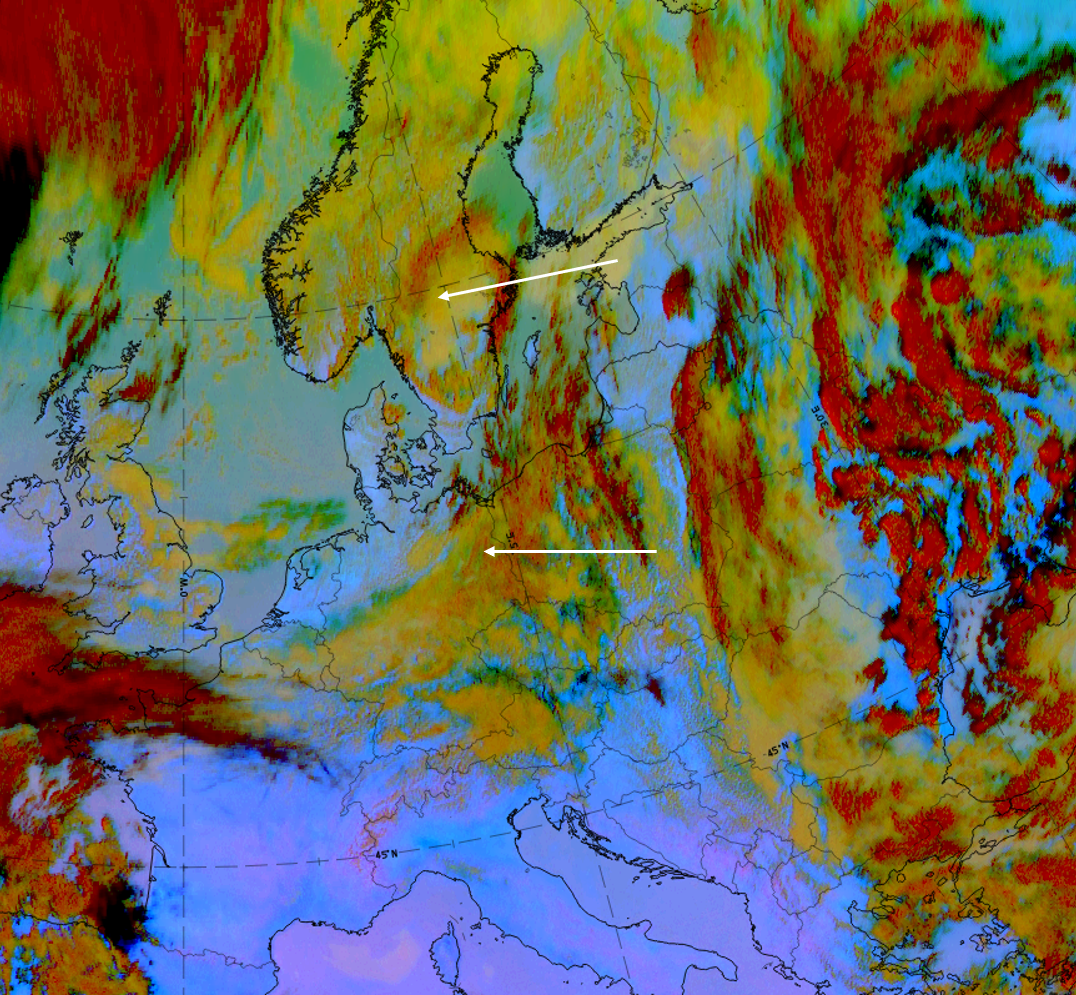
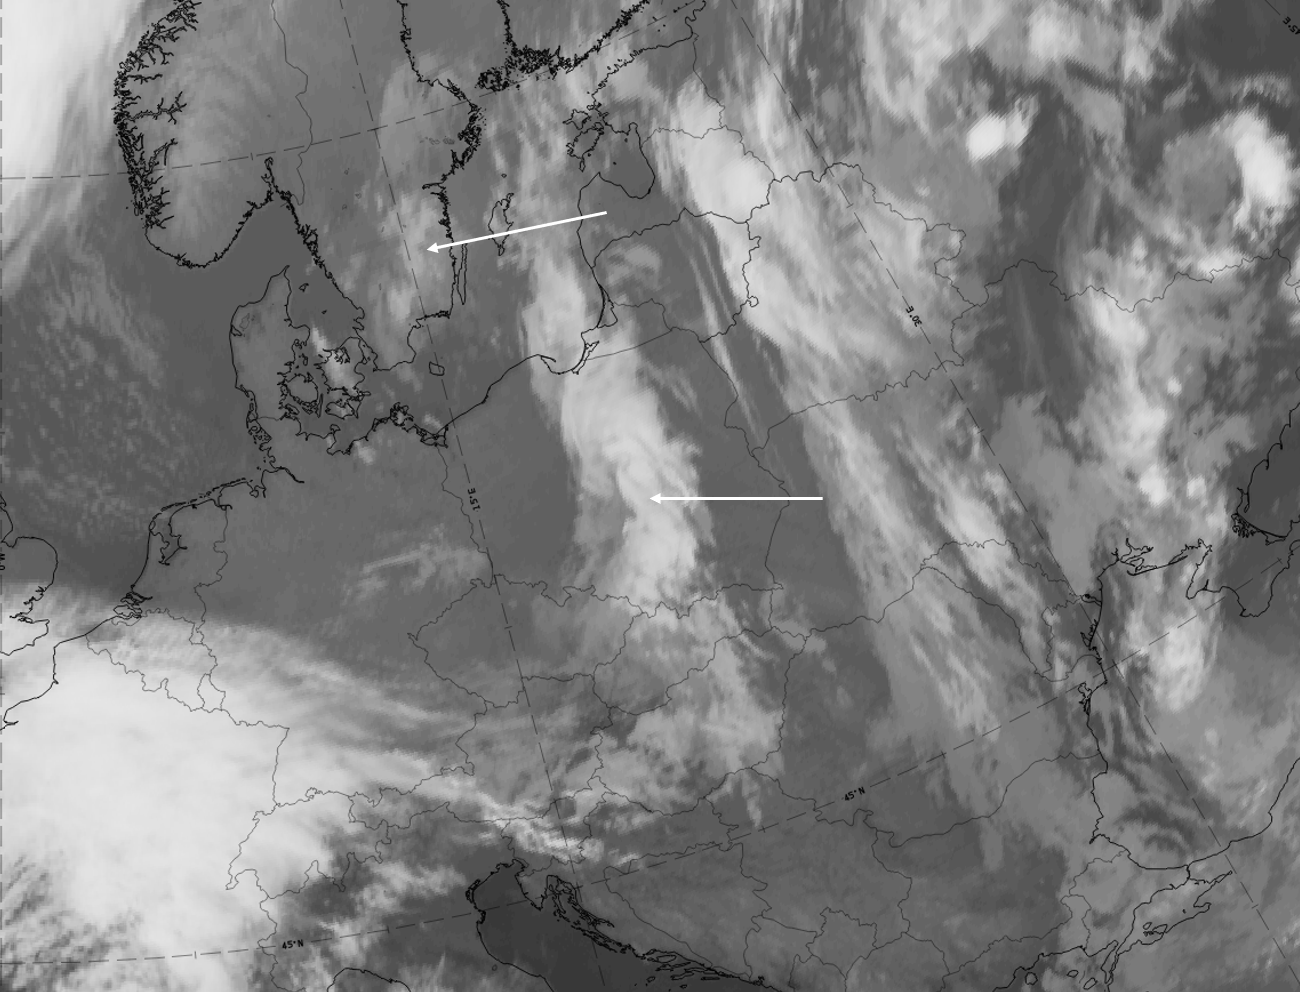
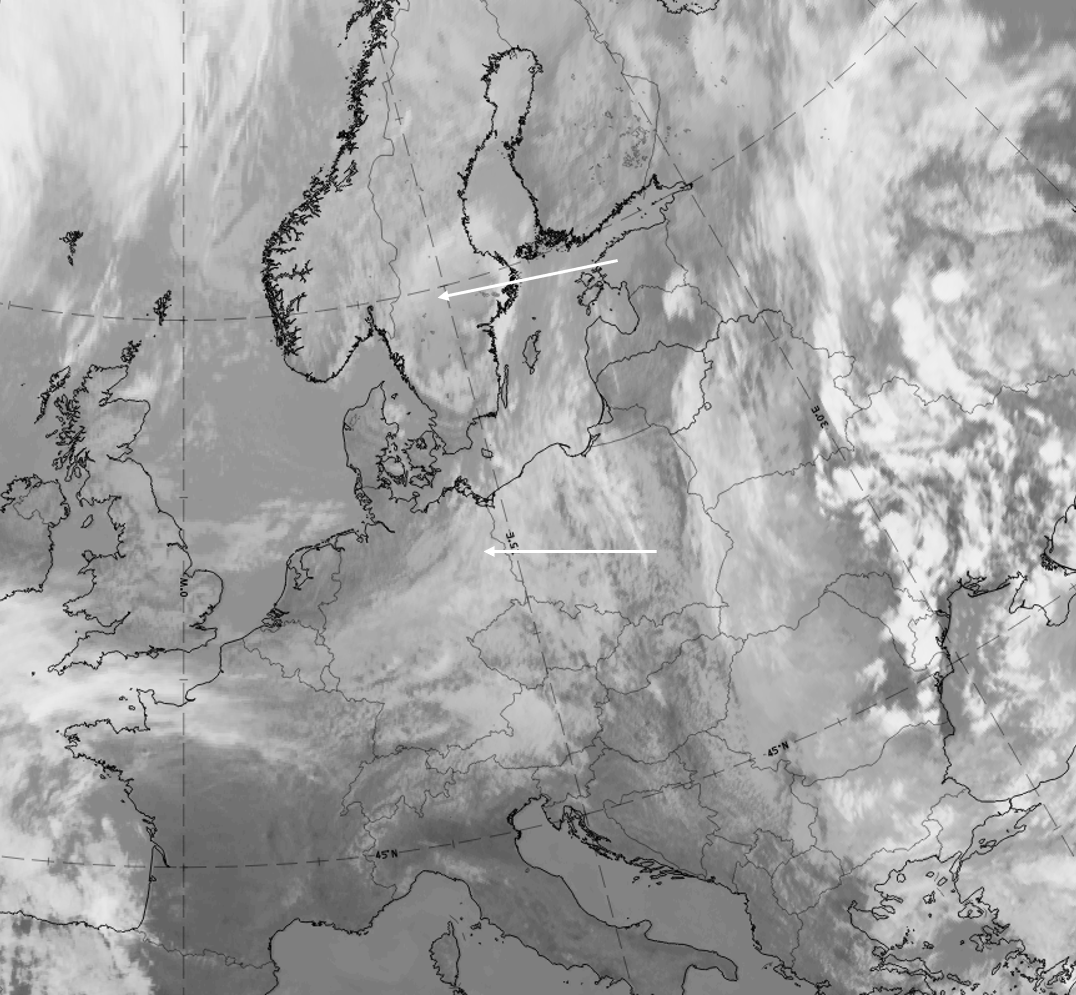
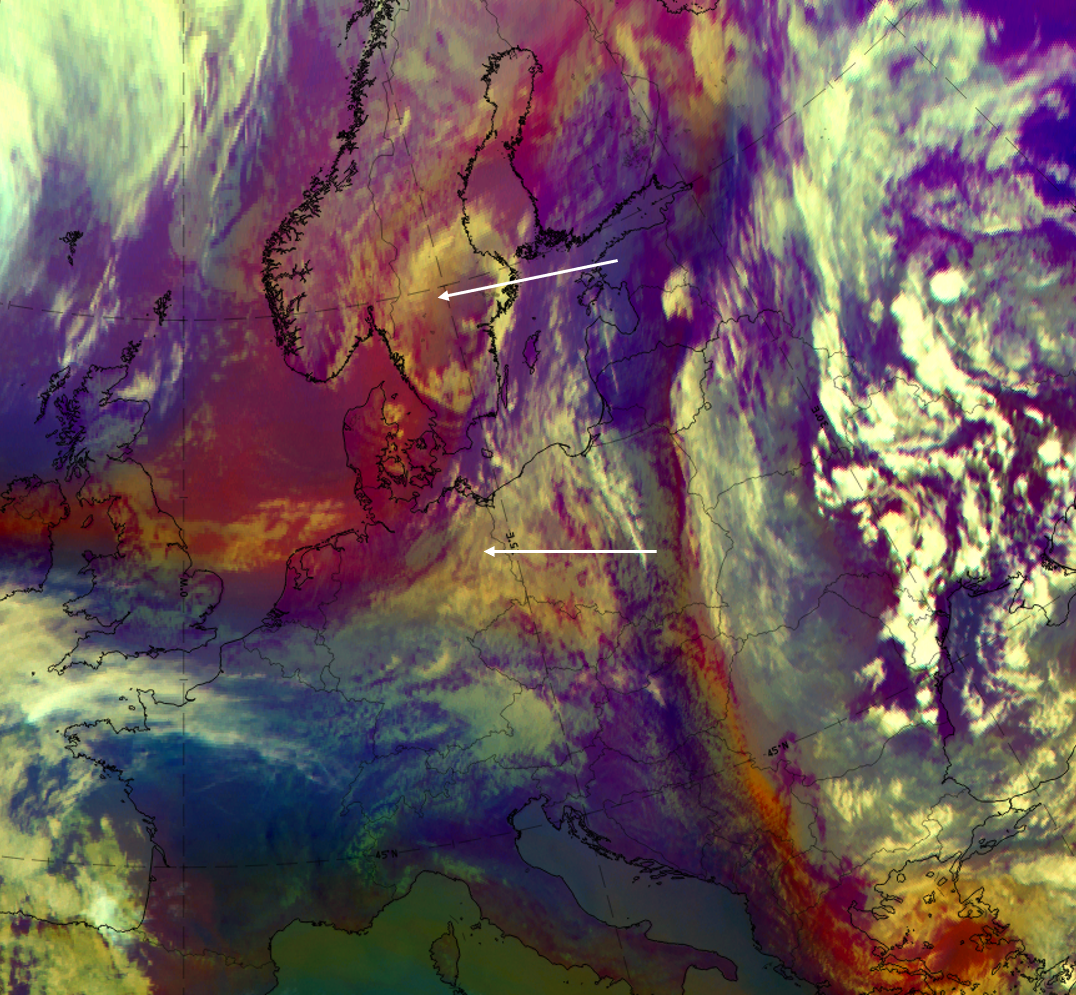
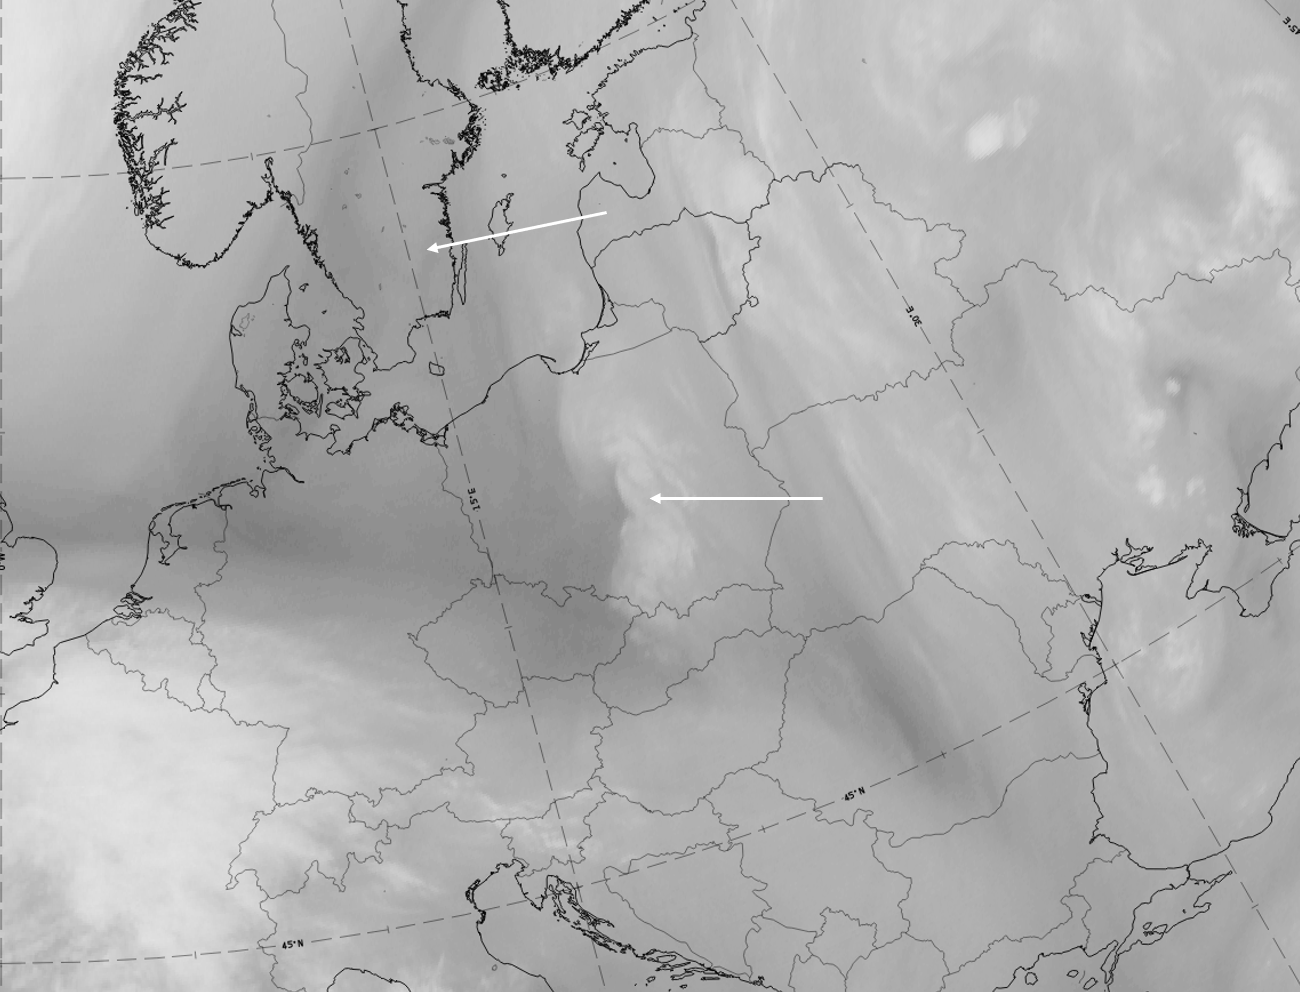
Tear-off stage: 5 May 2020 at 03 UTC
The cloud band at the leading edge of the torn-off low can be seen over Poland. Some cloud cells exist in the low centre over Southern Sweden and some fibrous clouds from the next system exist over Northern Norway.
|
|
5 May 2020 at 03UTC: 1st row: IR; 2nd row: WV (above) + Airmass RGB (below); 3rd row: Dust RGB + image gallery.
*Note: click on the Dust RGB image to access image gallery (navigate using arrows on keyboard).
| IR | All three cloud systems accompanying the leading side, the centre and the rearward side of the tear-off low, are white. |
| HRV | Not available at this point of time. |
| WV | Light grey colours on the cloudy areas, especially at the leading side; dark grey shades exist in the centre of the torn-off low; cyclonic rotation becomes visible. |
| Airmass RGB | Dark brown colours partly in the tear-off low centre and above the cold air cloud; very bright cloud band at the leading side. |
| Dust RGB | Dark red colours are the cloud band at the leading side of the tear-off low, indicating thick ice cloud; the same is true for small cold air clouds in the centre over Southern Sweden; the cloud free areas are mostly in pinkish blue, indicating higher humidity in the air near the ground below. Some greenish areas indicate thin mid-level cloud. |
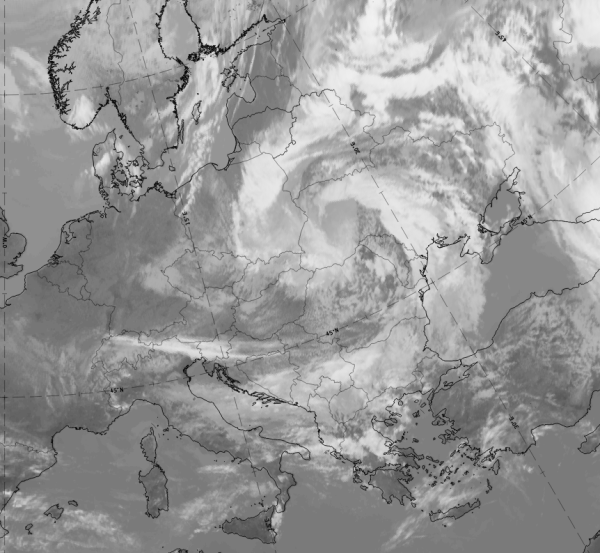
Cut-off stage: 6 May 2020 at 12 UTC
Two cloud bands spiral around the cut off low centre: the southern one developed from the frontal band at the rear side of the trough and the northern one developed within the cyclonic rotation, after cut off from cloudiness in the northeast. Some small cold air cells exist in the cut off low centre.
|
|

|
|
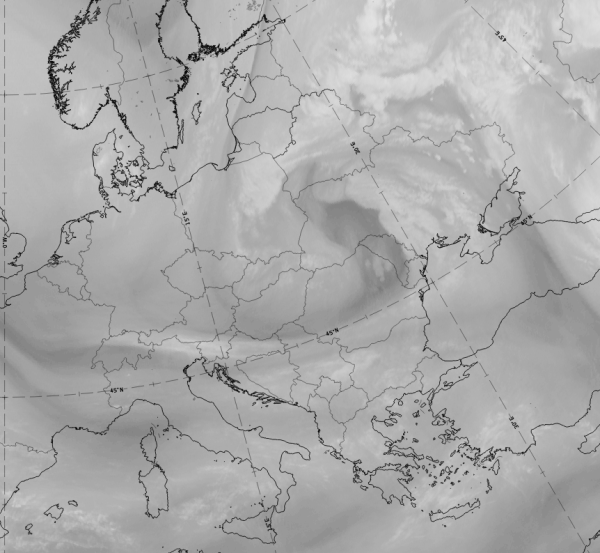
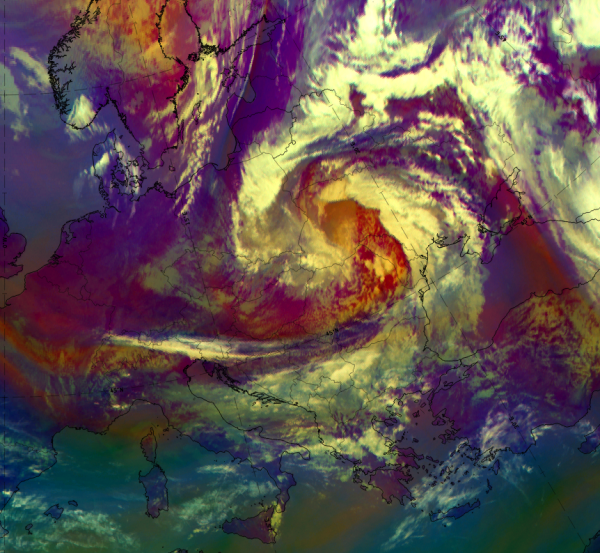
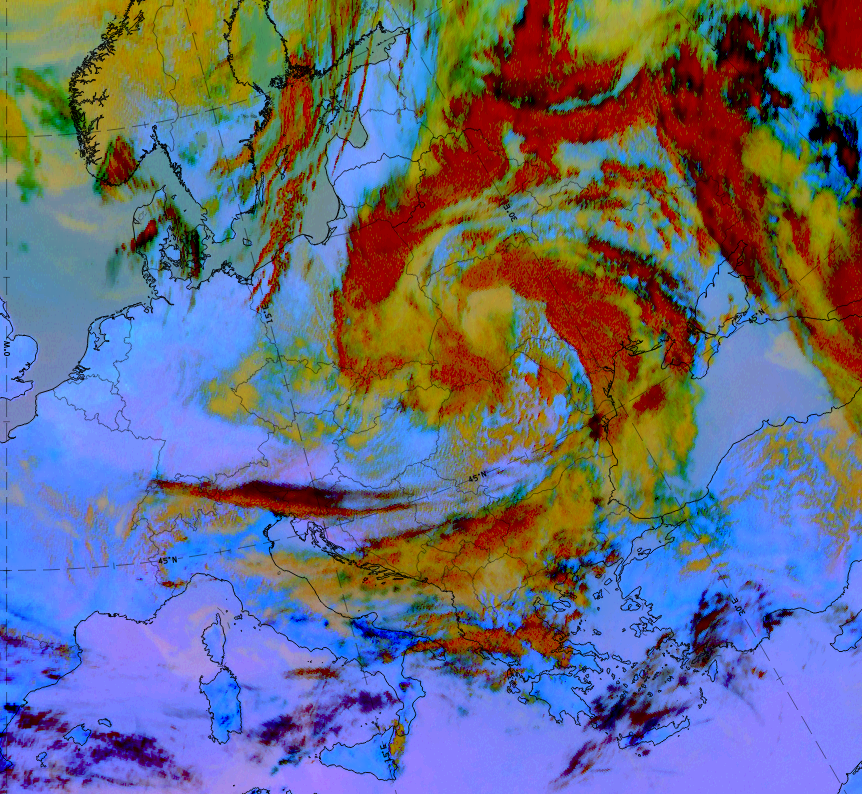
6 May 2020 at 12UTC: 1st row: IR (above) + HRV (below); 2nd row: WV (above) + Airmass RGB (below); 3rd row: Dust RGB + image gallery.
*Note: click on the Dust RGB image to access image gallery (navigate using arrows on keyboard)
| IR | Two cloud bands are cyclonically curved around the cut of low centre, with light grey to white grey shades; white small cells in the centre indicated by some light grey cloud patches. |
| HRV | A white cloud band around - and white cloud cells within - the cut-off low centre; white low to mid-level cloud patches in the centre are very distinct in the HRV channels. |
| WV | Cloud bands are white to light grey; the centre of the cut off low is dark grey. |
| Airmass RGB | Bright cloud bands with similar appearance to those in the IR channel; blue colours accompanying the bands indicate the cold air. The cut-off low centre has dark brown colours indicating the cold and dry air there. |
| Dust RGB | The two curved cloud bands are dark red over a large area, representing the thick ice cloud; the ochre colours indicate the mid-level water clouds which are partly in the cloud bands and partly in the cut off low centre. |
The air below an Upper Level Low is potentially unstable, which leads to the so-called core convection and convective cloudiness. Over warm sea this convective development can be intensive. Contrary to this, the centre of an Upper Level Low over land is often overcast with low or middle level cloudiness with some convective cells embedded.
Other conceptual models that may look like an Upper Level Low in satellite images are Comma (see Comma) and Polar Low (see Polar Low). These can be separated from each other with the help of numerical fields, especially on the 500 hPa level.
Meteorological Physical Background
Upper Level Lows are closed cyclonically circulating eddies in the middle and upper troposphere. They are sometimes also called "cold drops", because the air within an Upper Level Low is colder than in its surroundings.
The development of a typical Upper Level Low goes through four stages, during which a bottom of an upper trough is detached from the main stream, until it finally fills up or merges with another trough:
- Upper level trough
- Tear-off
- Cut-off
- Final stage
1. Upper Level Trough stage
The prerequisite of the forming of the Upper Level Low are unstable waves within the main stream, where the temperature wave is behind the geopotential wave.
- There is cold advection within the trough and warm advection on the ridge of the geopotential wave.
- The vertical axis of the trough has a backward-oriented inclination with height.
- The amplitudes of the waves increase; the wavelenght can decrease.
|
Cyan: 500 hPa geopotential height, green: 500 hPa temperature
|
|
|
|
2. Tear-off stage
- The amplitudes of the waves increases further.
- The isohypses form an inverse omega-shape and the cold air flows into the middle of this omega.
- Often at the same time the ridge behind the main upper trough continues to move eastward quicklier than the trough, appearing to "fall forward".
- In the end of this stage the cold bottom of the trough is detached from the main stream.
3. Cut-off stage
- The bottom of the upper trough is completely detached from the main stream forming a closed circulation.
- If there is a strong forward-falling ridge behind, it may also separate from the main stream and form an upper level high (a counterpart for the upper level low). This happens in most of the ULL cases.
- The cold core of the Upper level Low warms up slowly because of the diabatic warming of the sinking clod air.
- If a cold Upper Level Low is situated over a warm surface, convection arises within the core. This occurs especially over the Atlantic Ocean (Canarian Isles) and over the Mediterranean in summertime.
- Another location for convection is ahead of the low within the area of a thickness ridge.
4. Final stage
Within an Upper Level Low there is convection, unless the surface is very cold. The air near the surface is warm and the circulation is slowed down by the friction. The convection brings warm air and friction upwards. Consequently, the Upper Level Low weakens slowly.
- In most cases the Upper Level Low merges with the main stream before it has completely dissolved by the convection. Usually a large trough in the main stream approaches from the rear and catches the upper level low.
- The Upper Level Low can also merge with another Upper Level Low.
For an example see Key Parameters.
If the Upper Level Low is far from the main stream, it can dissolve solely by convection. This kind of development occurs mostly in southern areas; in Europe they can be found over the Mediterranean.
Upper Level Lows can be divided into two classes according to their size and lifetime:
- small lows with a lifetime of 2-4 days
- big lows with a lifetime of 5-14 days
Note that over land an Upper Level Low can also form when a surface low of an extratropical cyclone disappears due to friction. This is just a late stage of a cyclone development and the upper low fills up relatively quickly.
Key Parameters
- Height contours 500 hPa:
In the initial stage there is an upper trough. The bottom of the trough forms an inverse omega shape and is detached from the main stream forming a separate low. In the final stage the low weakens and merges with another trough or low. - Temperature 500 hPa:
The air within the Upper Level Low is colder than in the surroundings. The isotherms shows a life cycle similar to that of the geopotential. - Height contours 1000 hPa:
Usually loose field with no remarkable features. In some cases some weak cyclonic circulation may appear. - Equivalent thickness:
There is a thickness ridge ahead of the low and a trough or a distinct minimum behind or in the centre of the low. - Thermal front parameter:
There are two baroclinic zones:- A frontal-like cloud band ahead of the low
- A Baroclinic Boundary (see Baroclinic Boundary ) behind the low.
- Potential vorticity:
Within the Upper Level Low there is colder air with lower tropopause than in its surroundings. Consequently, in the area of the low there is a local maximum of PV.
Height contours and temperature 500 hPa
1. Trough stage
|
|
14 September 2005/06.00 UTC - Meteosat 8 IR 10.8 image; cyan: height contours 500 hPa, dark green: temperature 500 hPa
|
|
|
2. Tear-off stage
|
|
14 September 2005/12.00 UTC - Meteosat 8 IR 10.8 image; cyan: height contours 500 hPa, dark green: temperature 500 hPa
|
|
|
3. Cut-off stage
|
|
15 September 2005/12.00 UTC - Meteosat 8 IR 10.8 image; cyan: height contours 500 hPa, dark green: temperature 500 hPa
|
|
|
4. Final stage
|
|
16 September 2005/12.00 UTC - Meteosat 8 IR 10.8 image; cyan: height contours 500 hPa, dark green: temperature 500 hPa
|

|
|
Height countours at 1000 hPa
|
|
15 September 2005/12.00 UTC - Meteosat 8 IR 10.8 image; magenta: height contours 500 hPa, cyan: height contours 1000 hPa
|
|
|
Equivalent thickness and thermal frontal parameter
|
|
15 September 2005/12.00 UTC - Meteosat 8 IR 10.8 image; green: equivalent thickness, blue: thermal frontal parameter
|
|
|
Potential vorticity
|
|
15 September 2005/12.00 UTC - Meteosat 8 WV 6.2 image; magenta: height of PV=1 unit
|
|
|
Typical Appearance In Vertical Cross Sections
- Isentropes:
Often there is a conditionally unstable stratification in the lower and middle troposphere, with isentropic values decreasing with height. Otherwise isentropes show a shape of a ridge with the isolines far from each other in the area of the Upper Level Low. - Relative Vorticity:
Due to the cyclonic circulation within the Upper Level Low there is a maximum of relative vorticity. - Temperature Advection:
The air within an Upper Level Low is colder than in the surroundings. Therefore, there is distinct cold advection ahead of the Upper Level Low, and warm advection behind it. - Potential Vorticity:
There is a maximum of potential vorticity above the centre of the Upper Level Low.
|
|
15 September 2005/12.00 UTC - Meteosat 8 IR 10.8 image; position of vertical cross section indicated
|
|
|
Relative vorticity
|
|
15 September 2005/12.00 UTC - Vertical cross section; black: isentropes (Thetae), blue: relative vorticity
|
|
|
Temperature advection
|
|
15 September 2005/12.00 UTC - Vertical cross section; black: isentropes (Thetae), red thin: temperature advection - CA, red thick:
temperature advection - WA
|
|
|
Potential vorticity
|
|
15 September 2005/12.00 UTC - Vertical cross section; black: isentropes (Thetae), dark green: potential vorticity
|
|
|
Weather Events
- The frontal cloud band on the leading edge of an Upper Level Low is usually thick enough to produce precipitation. In some cases there is also frontal cloudiness on the rearward edge. Within the cloud bands there are embedded Cbs, and therefore the precipitation is showery.
- When the Upper Level Low is over land, there is a low cloud layer in the centre.
- Over cold surface there is no convection, and therefore no showers occur.
Over Sea
| Parameter | Description |
| Precipitation |
|
| Temperature |
|
| Wind (incl. gusts) |
|
| Other relevant information |
|
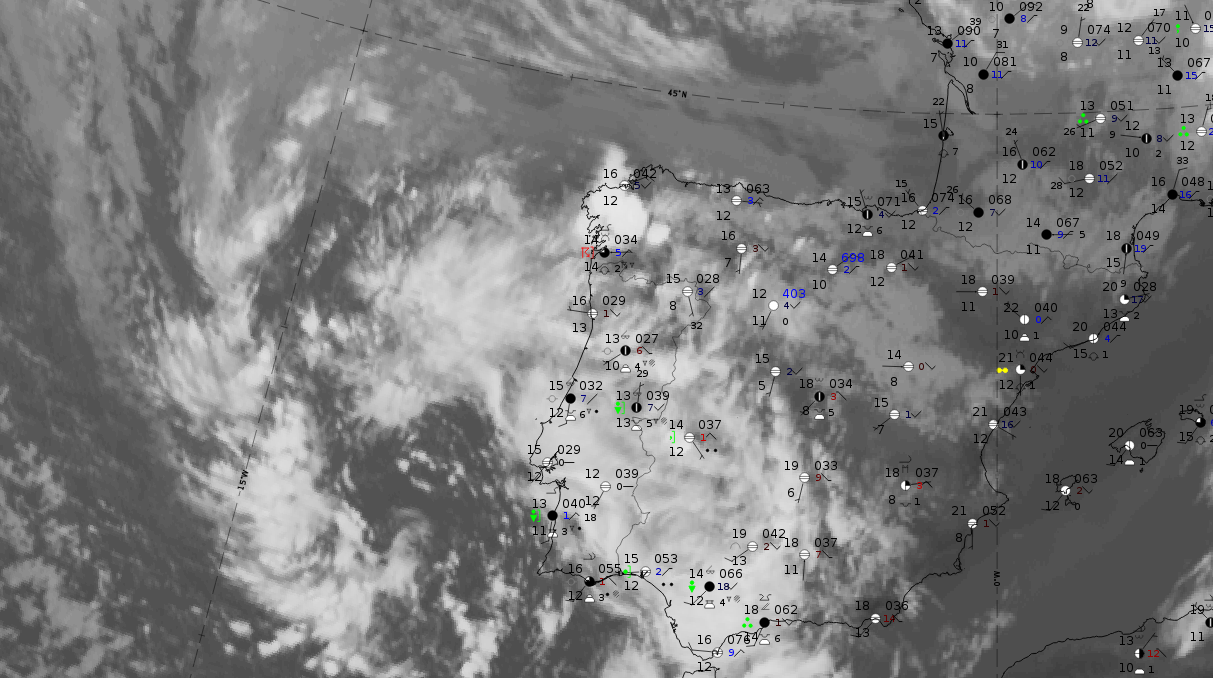
The case west of and over Spain from 13 May 2020 at 18 UTC can be used as an example for a cut-off low (at least partly) over sea. The IR image below shows the two cyclonically curved cloud bands around the cut-off low centre which is located to the west of Spain, over the ocean.
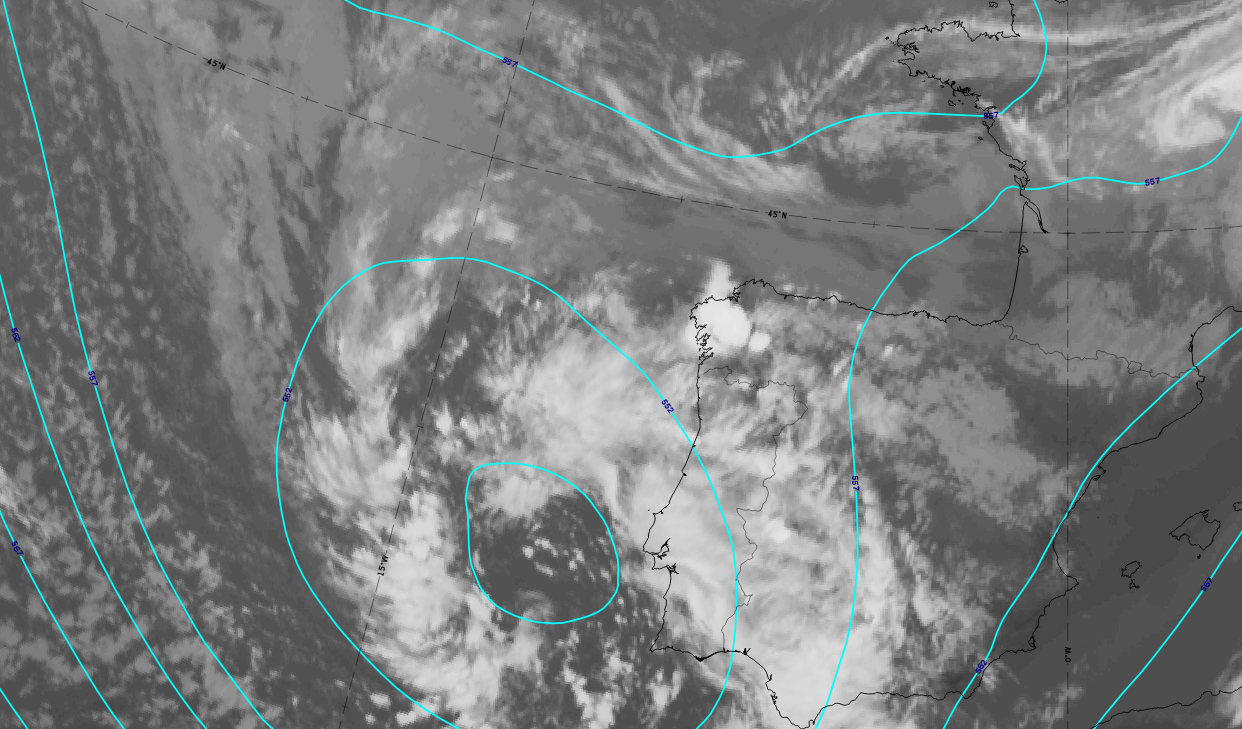
13 May 2020 at 18 UTC: IR; cyan lines: height contours 500 hPa.
|
|
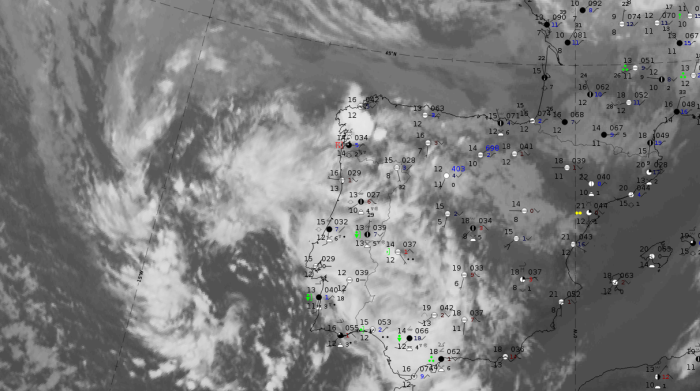
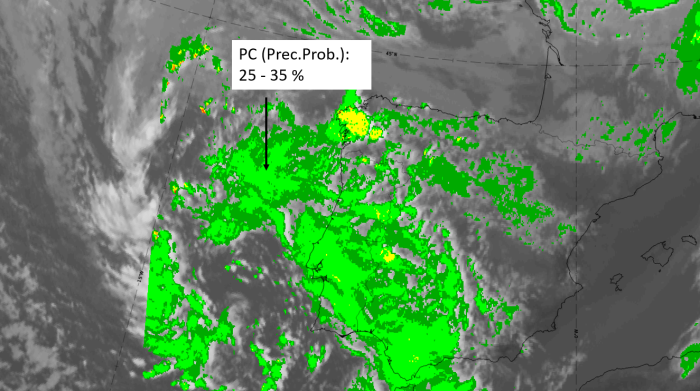
Legend: 13 May 2019 at 18UTC: IR + synoptic measurements (above) + probability of moderate rain (Precipitting clouds PC - NWCSAF).
Note: for a larger SYNOP image click this link.
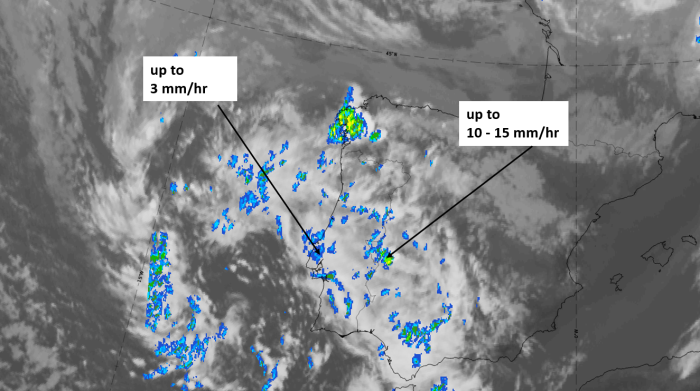
The cut-off low centre is mostly cloud free with some smaller cloud cells. The cloud bands at the cut-off low boundary are accompanied by precipitation, mostly in shower form. This corresponds with the fact that the probability of moderate precipitation from the NWCSAF is low.
|
|
|
|
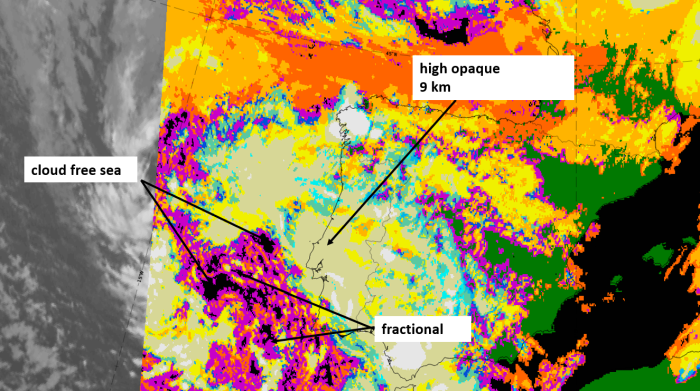
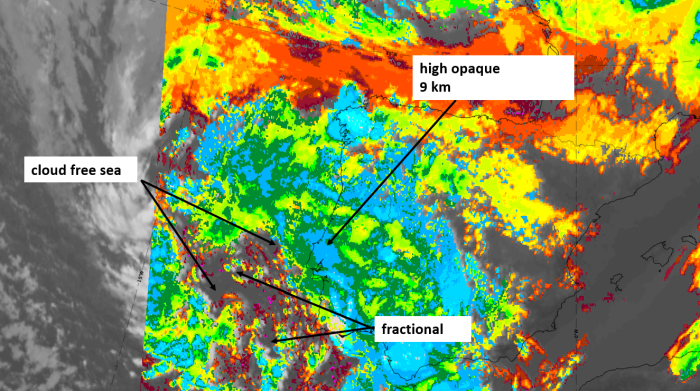
Legend:
13 May 2020 at 18 UTC, IR ; superimposed:
1st row: Cloud Type (CT NWCSAF) (above) + Cloud Top Height (CTTH - NWCSAF) (below); 2nd row: Convective Rainfall Rate (CRR NWCSAF) (above) + Radar intensities from Opera radar system (below).
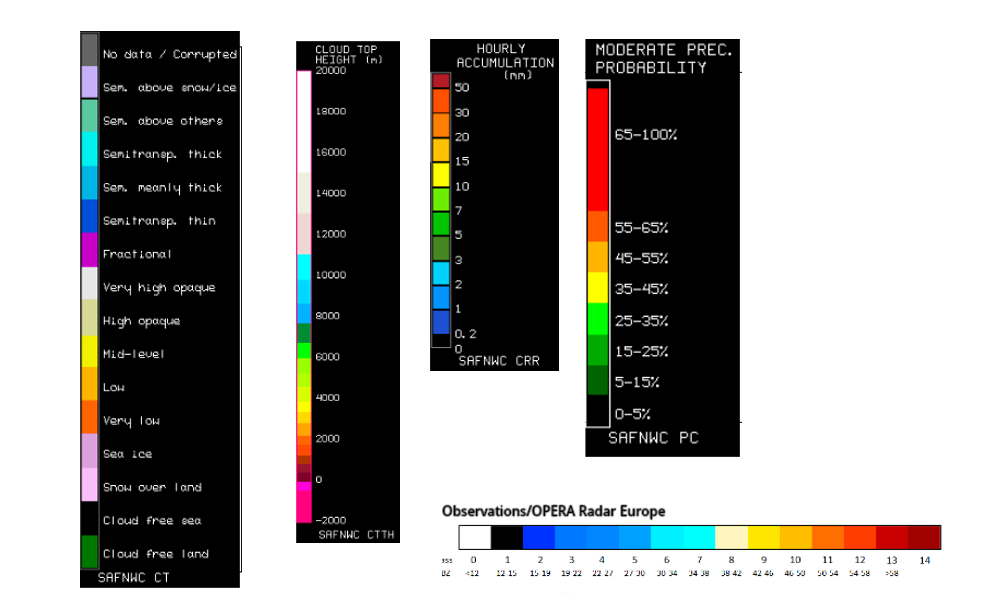
For identifying values for Cloud type (CT), Cloud type height (CTTH), precipitating clouds (PC), and Opera radar for any pixel in the images look into the legends. (link).
Over Land
| Parameter | Description |
| Precipitation |
In the summer season:
|
| Temperature |
|
| Wind (incl. gusts) |
|
| Other relevant information |
|
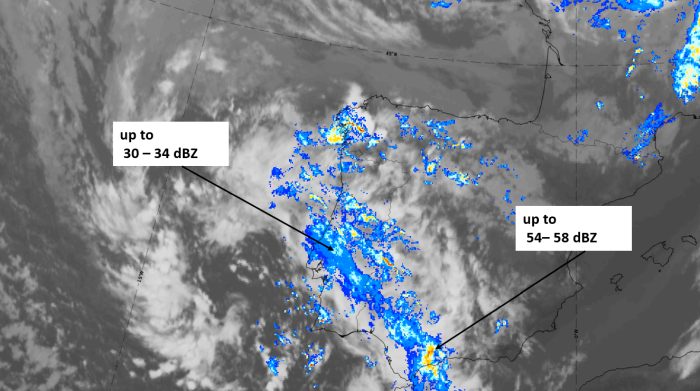
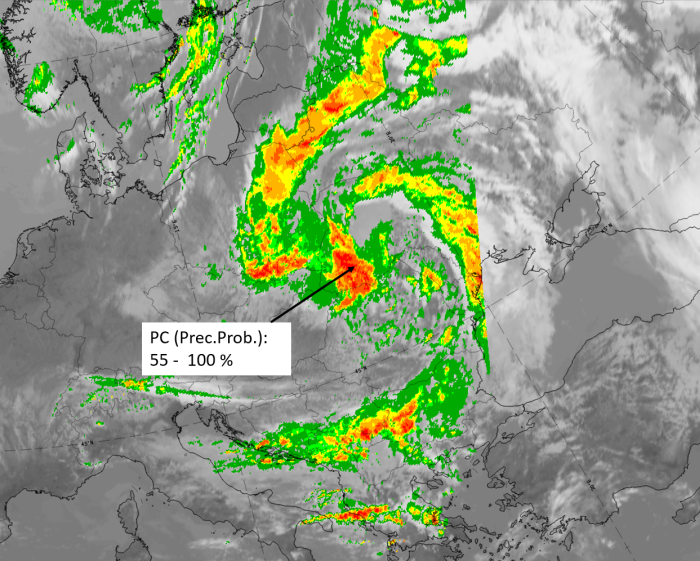
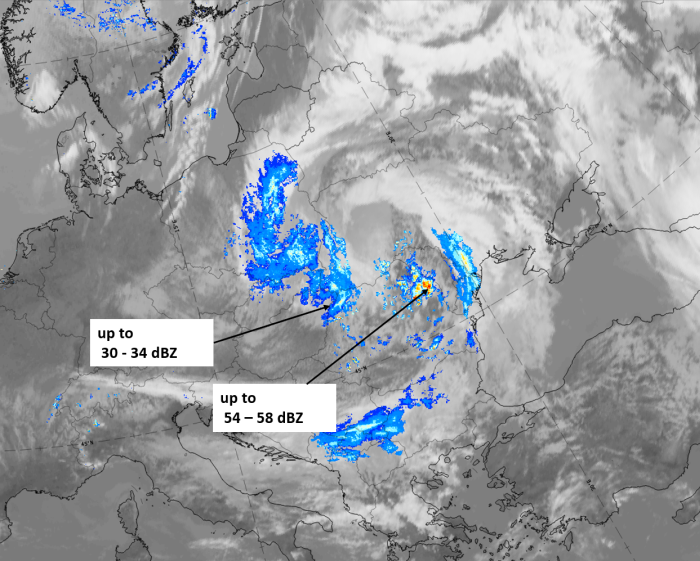
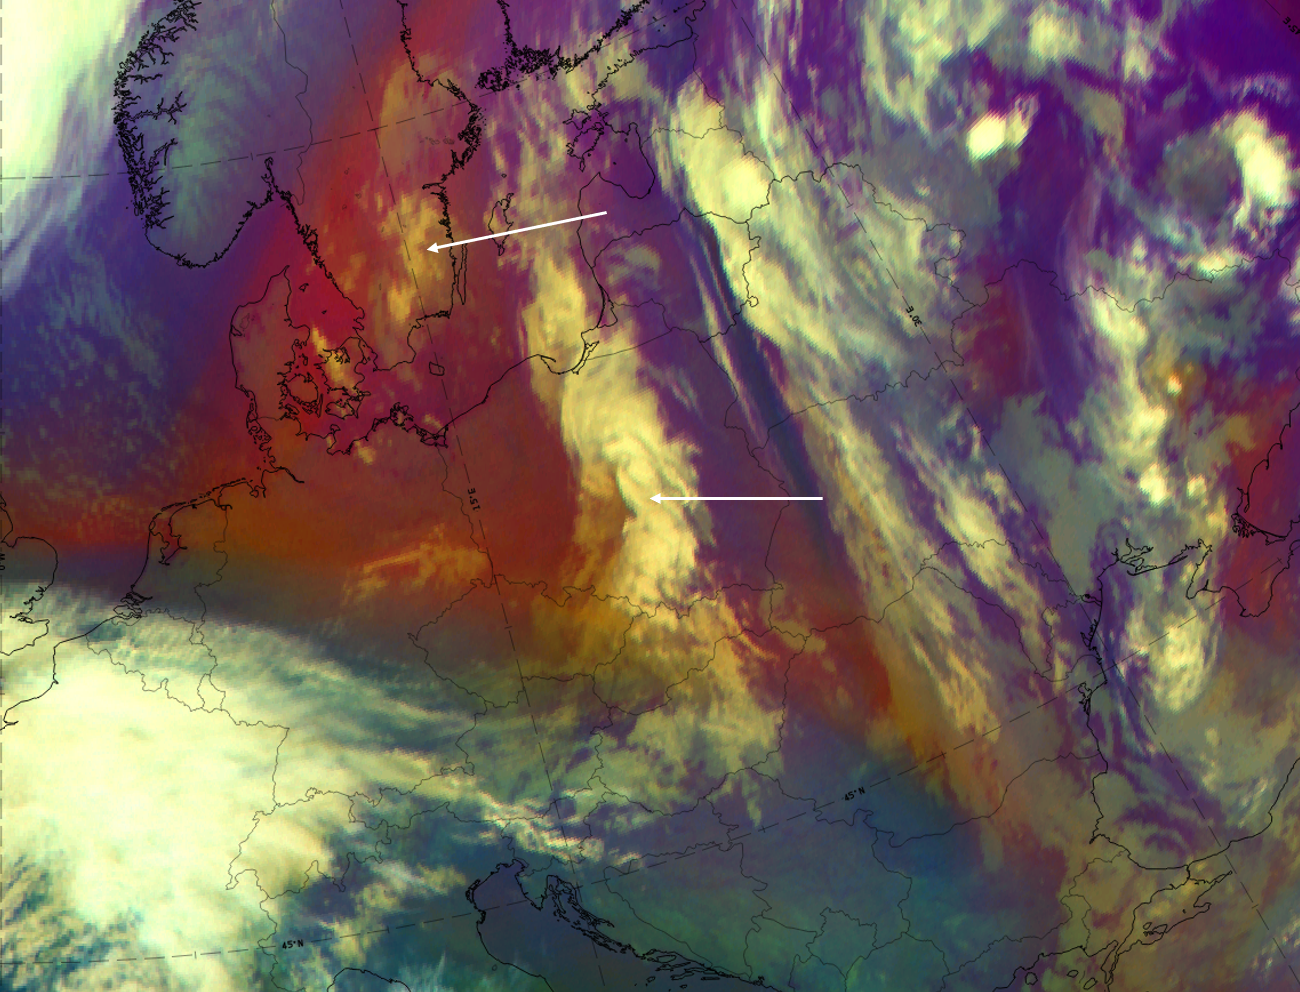
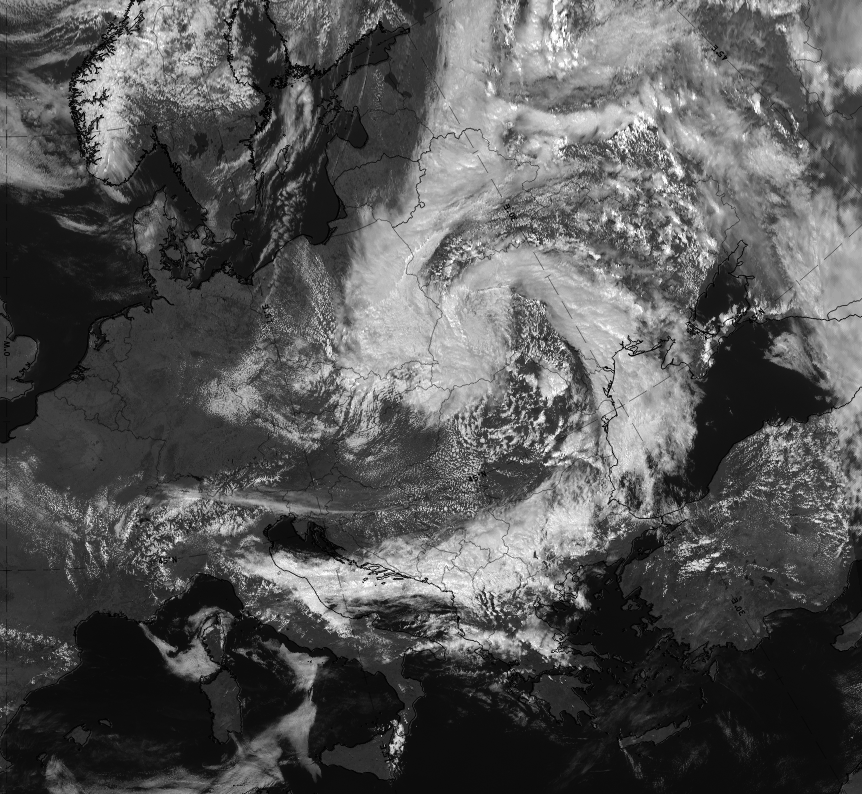
The case from 6 May 2020 at 12 UTC, described in detail in the chapter "Appearance in satellite images" over Central Europe, can be used as an example for a cut-off low over land. The IR image below shows the two cyclonically curved cloud bands around the cut-off low centre which is at least partly filled with dense low-level cloud over Eastern Poland and Western Ukraine. More eastwards, cellular cold air cloud does exist in the mostly cloud free area.
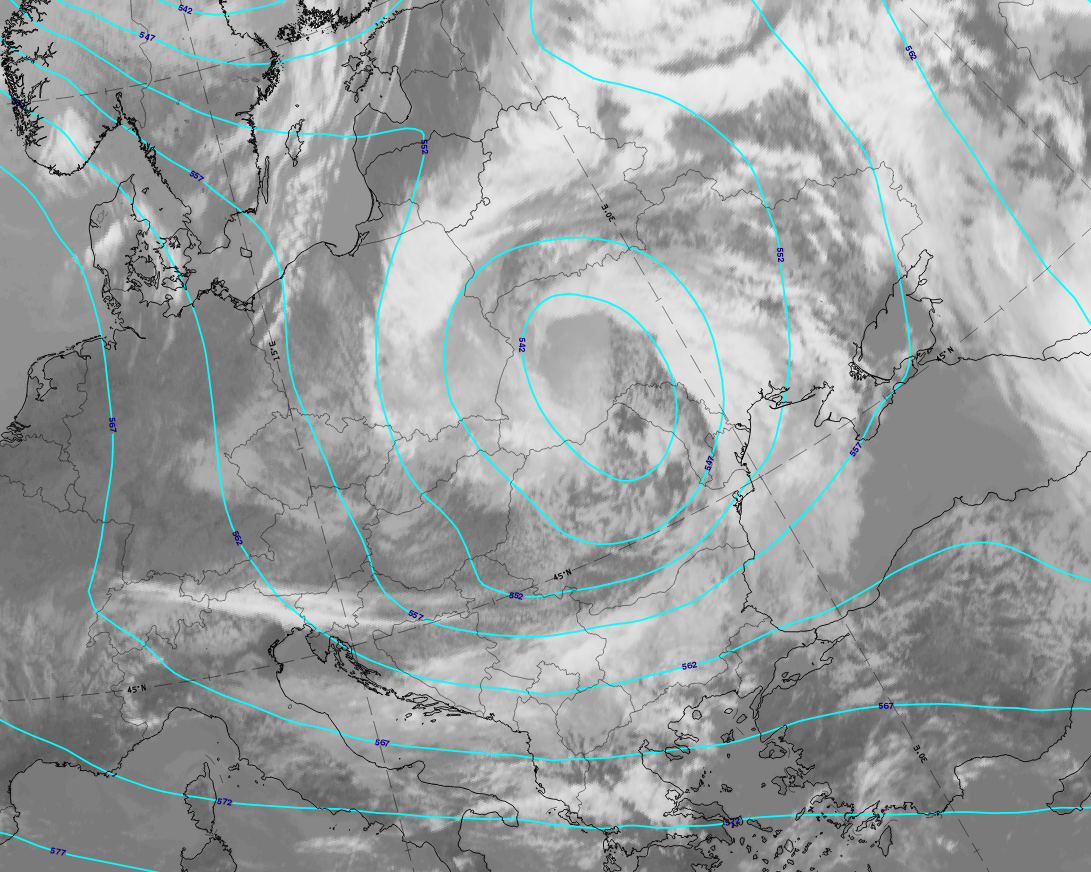
6 May 2020 at12 UTC: IR; cyan lines: height contours 500 hPa.
|
|
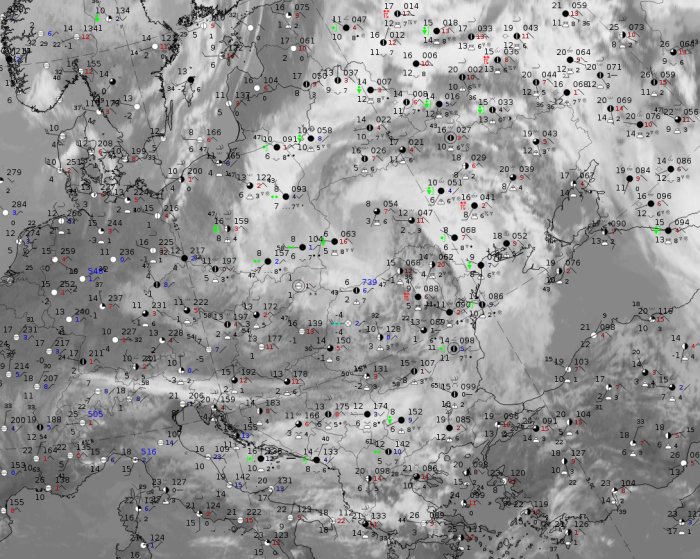
Note: for a larger SYNOP image click this link.
The overcast part of the cut-off low over Eastern Poland and Western Ukraine show rain as well as showers and Cbs which are superimposed. East of this, there are isolated Cbs and thunderstorms. The probability of moderate precipitation computed by NWCSAF diagnoses very high values for the overcast part in the cut-off low centre.
|
|
|
|
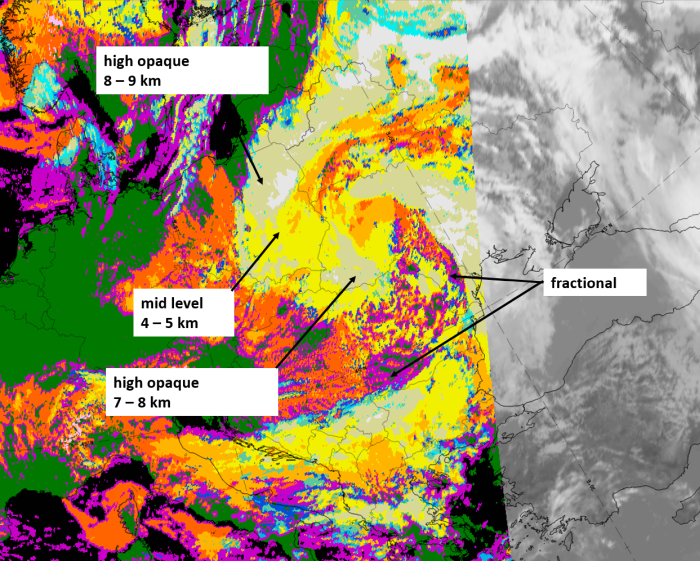
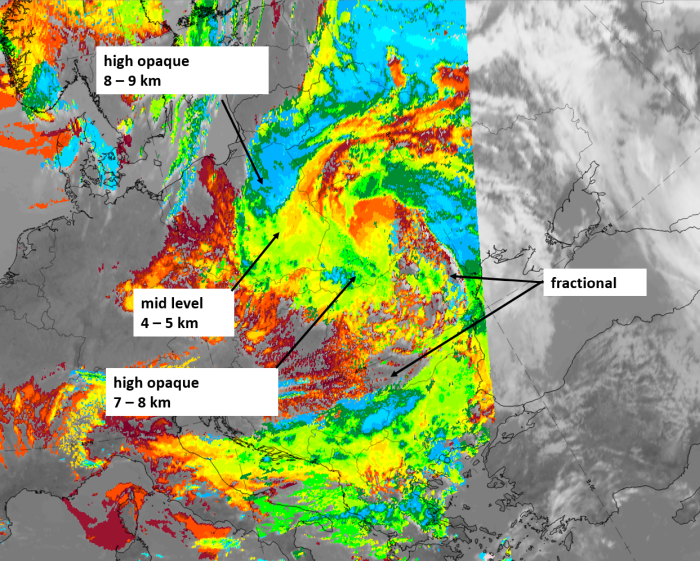
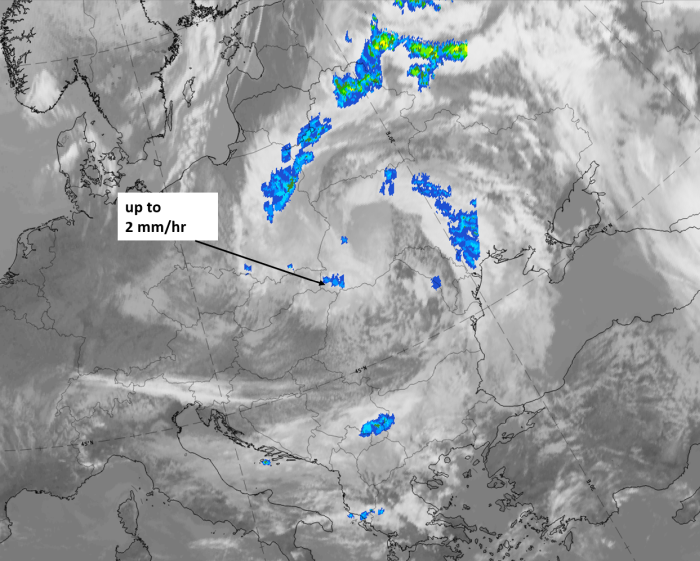
Legend:
6 May 2020 at 12 UTC, IR ; superimposed:
u.l.: Cloud Type (CT NWCSAF); u.r.: Cloud Top Height (CTTH - NWCSAF); l.l.: Convective Rainfall Rate (CRR - NWCSAF); l.r.: Radar intensities from Opera radar system.
For identifying values for Cloud type (CT), Cloud type height (CTTH), precipitating clouds (PC), and Opera radar for any pixel in the images look into the legends. (link).
References
General Meteorology and Basics
- BOHR P., KATHE G., KNORR M., KURZ M. and LANGE K. - D. (1987): Allgemeine Meteorologie - Leitf?en f?r die Ausbildung im Deutschen Wetterdienst, 3. Auflage, Selbstverlag des Deutschen Wetterdienstes
- CONWAY B. J., GERARD L., LABROUSSE J., LILJAS E., SENESI S., SUNDE J. and ZWATZ-MEISE V. (1996): COST78 Meteorology - Nowcasting, a survey of current knowledge, techniques and practice; Phase 1 report; Office for official publications of the European Communities
- HOSKINS B. J., MCINTYRE M. E. and ROBERTSON A. W. (1985): On the use and significance of isentropic potential vorticity maps; Quart. J. R. Meteor. Soc., Vol. 111, p. 877 - 946
- HOSKINS B. J. (1991): Towards a PV - Theta view of the general circulation; Tellus, Vol. 43 AB, p. 27 - 35
- KOISTINEN J.: Lectures on Synoptic Meteorology in the University of Helsinki, unpublished paper
- KURZ M. (1990): Synoptische Meteorologie - Leitf?en f?r die Ausbildung im Deutschen Wetterdienst; 2. Auflage, Selbstverlag des Deutschen Wetterdienstes
General Satellite Meteorology
- BADER M. J., FORBES G. S., GRANT J. R., LILLEY R. B. E. and WATERS A. J. (1995): Images in weather forecasting - A practical guide for interpreting satellite and radar imagery; Cambridge University Press
Specific Satellite Meteorology
- BILLING H., HAUPT J. and TONN W. (1983): Evolution of a hurricane-like cyclone in the Mediterranean Sea; Beitr. Phys. Atm., Vol. 56, p. 508 - 510
- KEYSER D. and SHAPIRO M. A. (1986): A review of the structure and dynamics of upper level frontal zones; Mon. Wea. Rev., Vol. 114, p. 452 - 499
- LILJEQUIST G. H. and CEHAK K. K. (1984): Allgemeine Meterorologie, 3. Auflage, Braunschweig Vieweg
- MONK G. A. (1992): Synoptic and mesoscale analysis of intense mid-latitude cyclones, Met. Mag., Vol. 121, p. 269 - 283
- PRICE J. D. and VAUGHAN G. (1993): The potential for stratosphere - troposphere exchange in cut - off - low systems; Quart. J. Roy. Meteor. Soc., Vol. 119, p. 343 - 365
- RASMUSSEN E. (1987): A subsynoptic vortex over the Mediterranean with some resemblance to polar lows; Tellus, Vol. 39A, p. 408 - 425
- REED R. J. (1990): Advances in knowledge and understanding of extratropical cyclones during the past quarter century: an overview; in Extratropical Cyclones, The Erik Palmen Memorial Volume, Ed. Chester Newton and Eero O Holopainen, p. 27 - 45
- SIMMONS A. J. and HOSKINS B. J. (1979): The downstream and upstream development of unstable baroclinic waves; J. Atmos. Sci., Vol. 36, p. 1239 - 1254
- SMITH R. K. and ULRICH W. (1993): Vortex motion in relation to the absolute vorticity gradient of the vortex environment; Quart. J. Roy. Meteor. Soc, Vol. 119, p. 207 - 215