Key Parameters
- Height contours 500 hPa:
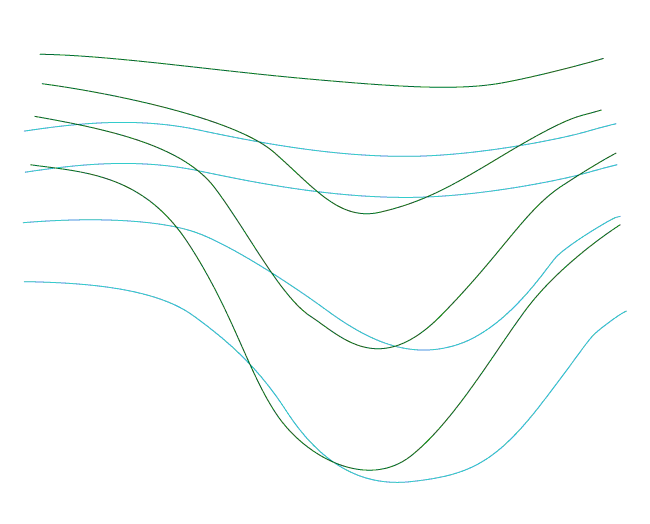
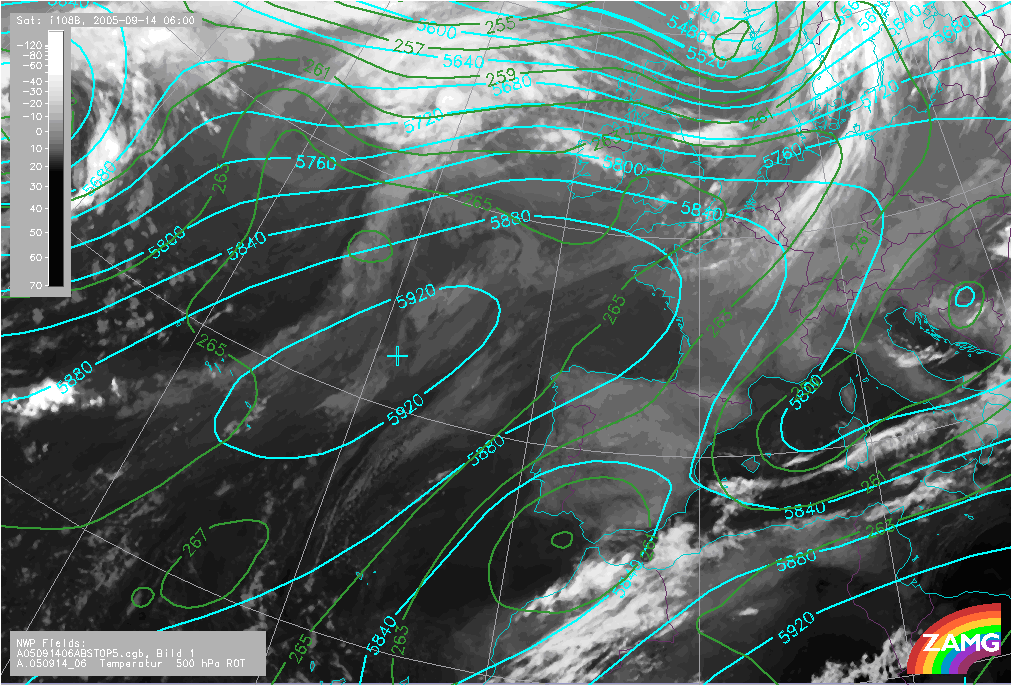
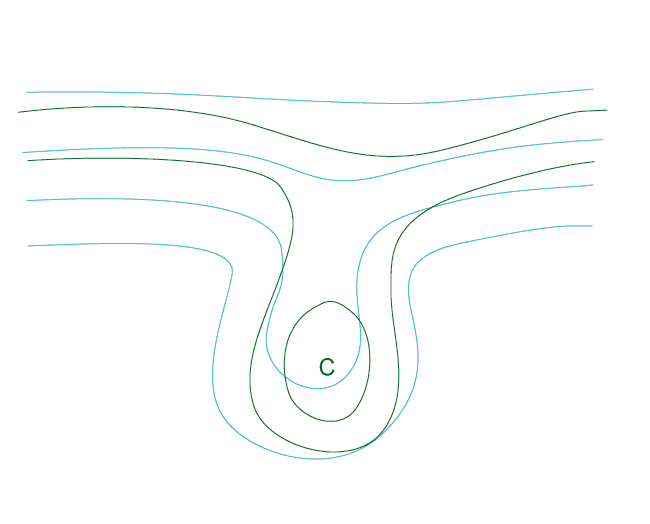
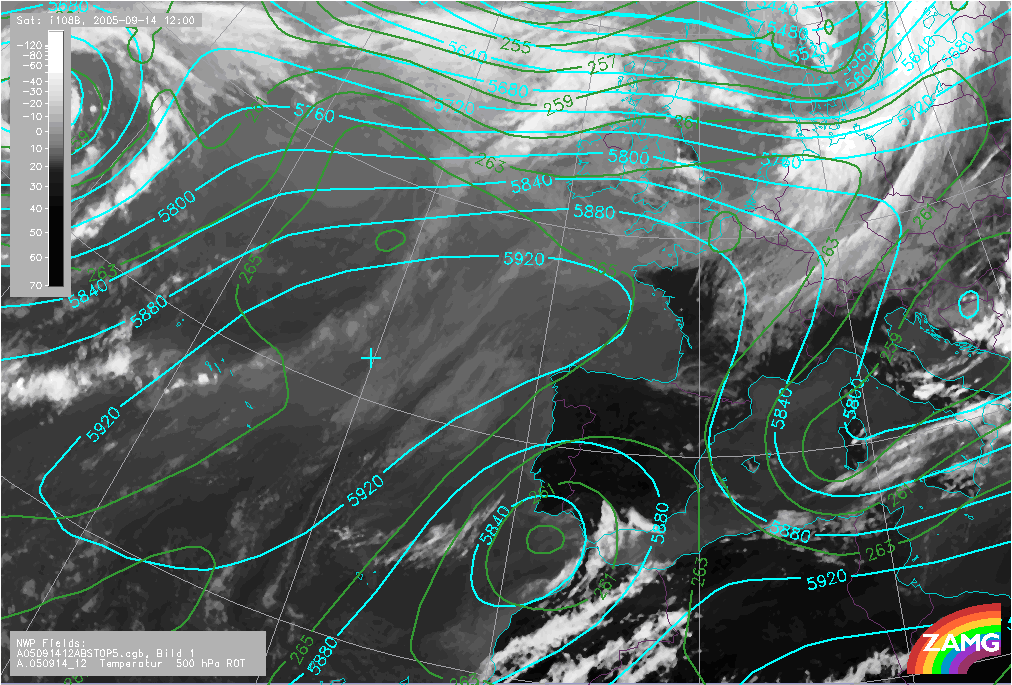
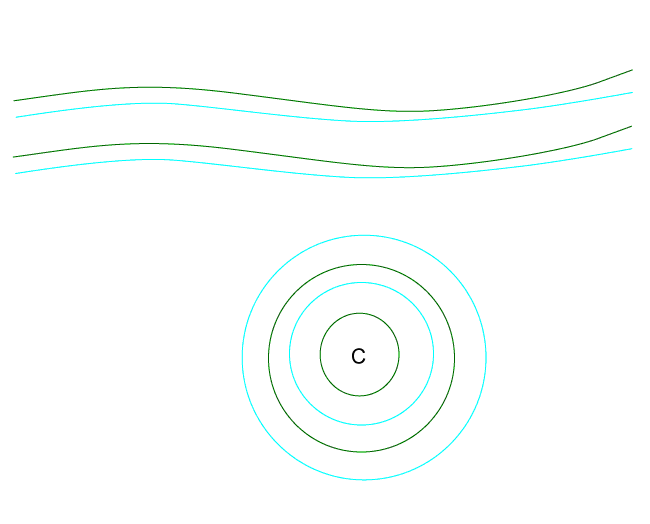
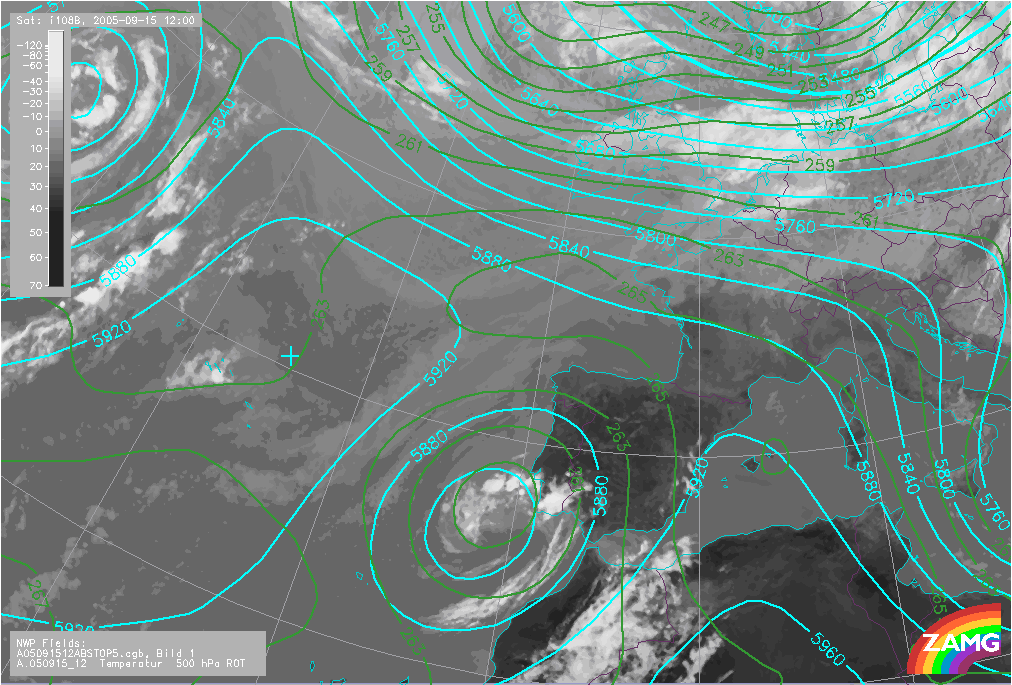
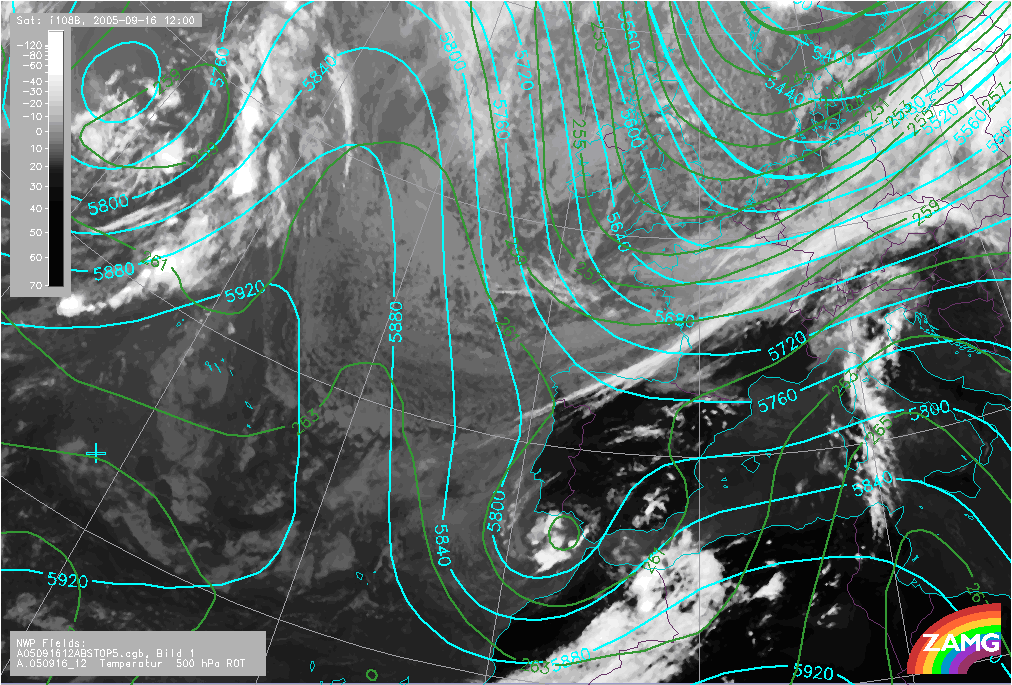
In the initial stage there is an upper trough. The bottom of the trough forms an inverse omega shape and is detached from the main stream forming a separate low. In the final stage the low weakens and merges with another trough or low. - Temperature 500 hPa:
The air within the Upper Level Low is colder than in the surroundings. The isotherms shows a life cycle similar to that of the geopotential. - Height contours 1000 hPa:
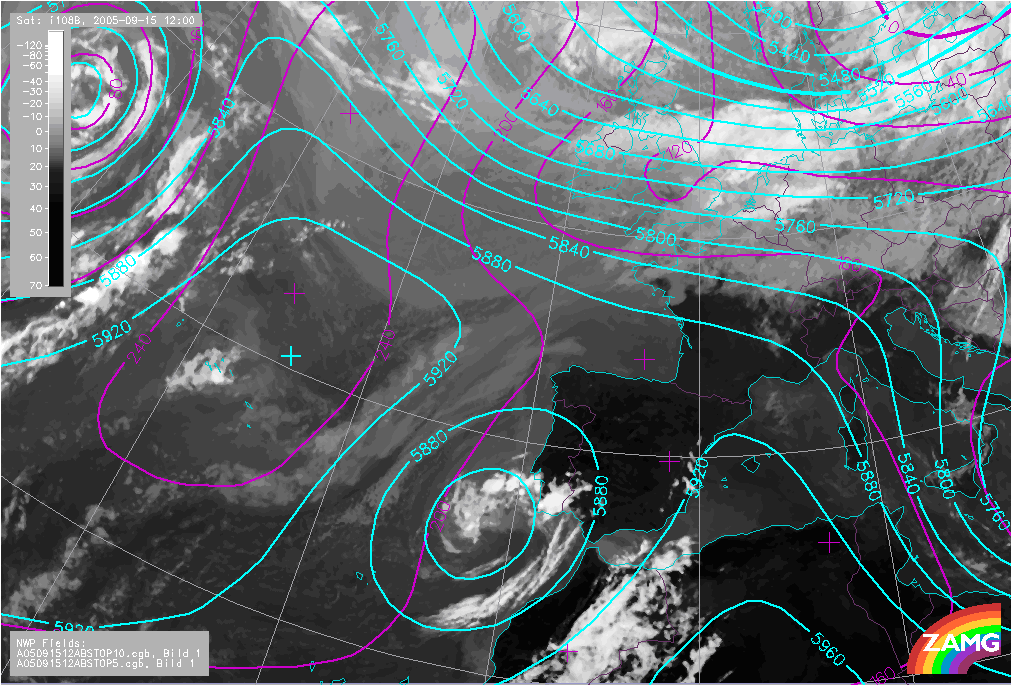
Usually loose field with no remarkable features. In some cases some weak cyclonic circulation may appear. - Equivalent thickness:
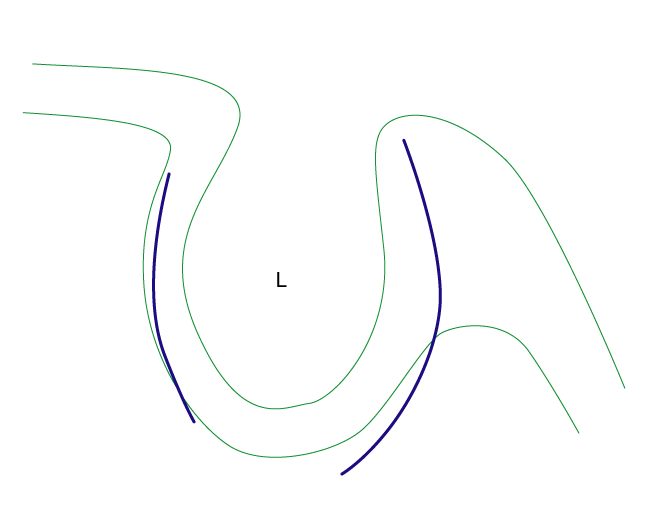
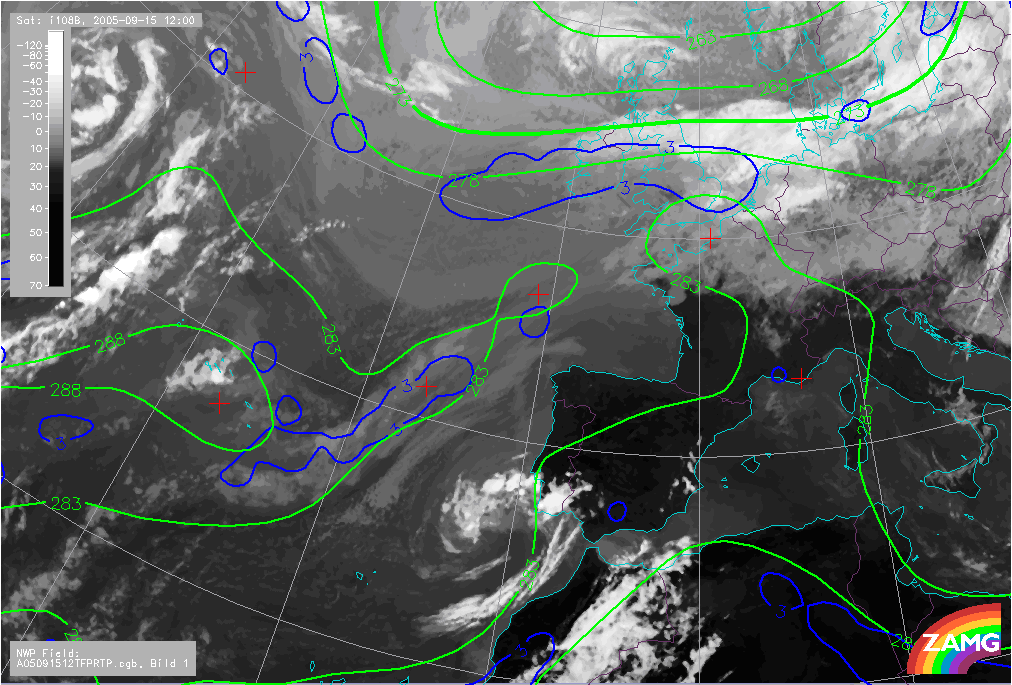
There is a thickness ridge ahead of the low and a trough or a distinct minimum behind or in the centre of the low. - Thermal front parameter:
There are two baroclinic zones:- A frontal-like cloud band ahead of the low
- A Baroclinic Boundary (see Baroclinic Boundary ) behind the low.
- Potential vorticity:
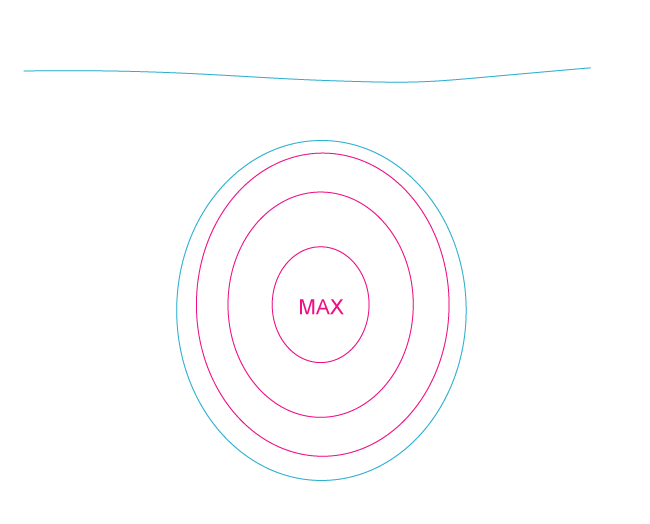
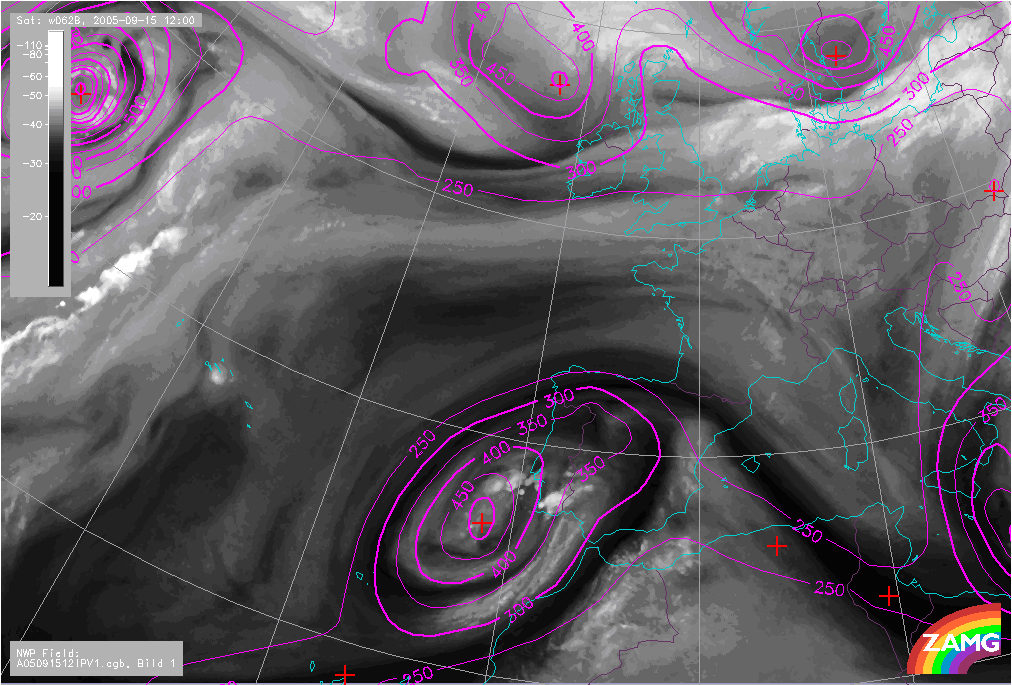
Within the Upper Level Low there is colder air with lower tropopause than in its surroundings. Consequently, in the area of the low there is a local maximum of PV.
Height contours and temperature 500 hPa
1. Trough stage
|
|
14 September 2005/06.00 UTC - Meteosat 8 IR 10.8 image; cyan: height contours 500 hPa, dark green: temperature 500 hPa
|
|
|
2. Tear-off stage
|
|
14 September 2005/12.00 UTC - Meteosat 8 IR 10.8 image; cyan: height contours 500 hPa, dark green: temperature 500 hPa
|
|
|
3. Cut-off stage
|
|
15 September 2005/12.00 UTC - Meteosat 8 IR 10.8 image; cyan: height contours 500 hPa, dark green: temperature 500 hPa
|
|
|
4. Final stage
|
|
16 September 2005/12.00 UTC - Meteosat 8 IR 10.8 image; cyan: height contours 500 hPa, dark green: temperature 500 hPa
|

|
|
Height countours at 1000 hPa
|
|
15 September 2005/12.00 UTC - Meteosat 8 IR 10.8 image; magenta: height contours 500 hPa, cyan: height contours 1000 hPa
|

|
|
Equivalent thickness and thermal frontal parameter
|
|
15 September 2005/12.00 UTC - Meteosat 8 IR 10.8 image; green: equivalent thickness, blue: thermal frontal parameter
|
|
|
Potential vorticity
|
|
15 September 2005/12.00 UTC - Meteosat 8 WV 6.2 image; magenta: height of PV=1 unit
|
|
|
Special investigation of DANA cases
As already mentioned, DANA situations do not differ in general from cut off processes, so the key parameters for the case of 27 October 2024 are not presented or repeated in this chapter; height contours can be seen in the earlier chapter “Cloud structures in satellite images” and further additional parameters will be presented in the following chapter “Parameters in vertical cross sections”.
Here only the cut off/DANA stage for the October 2024 example is presented with geopotential height at 300 hPa and thickness contours. The intensity of the cold drop directly above central and southern Spain is very typical for DANA situations. This image indicates again the differences in the atmosphere over the leading eastward part over Spain and the rearward part over Portugal. A vertical cross section in the following chapter will further clarify these differences.
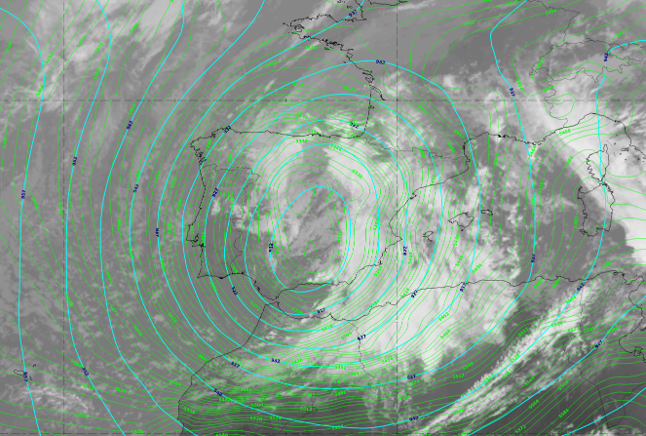
Fig 6:
27 Oct 2024, 12UTC: cut off stage—DANA; IR; cyan: height contours at 300 hPa; green: thickness at 500/1000 hPa.