Typical Appearance In Vertical Cross Sections
- Isentropes:
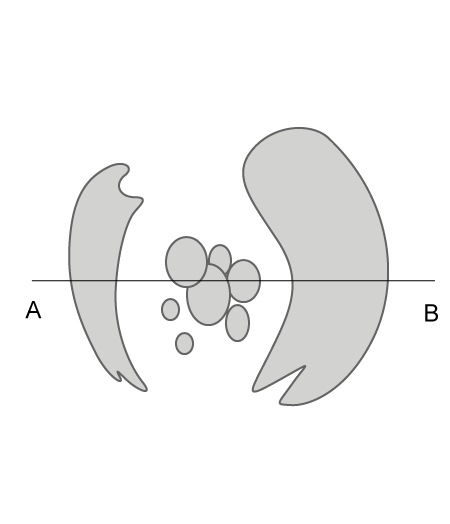
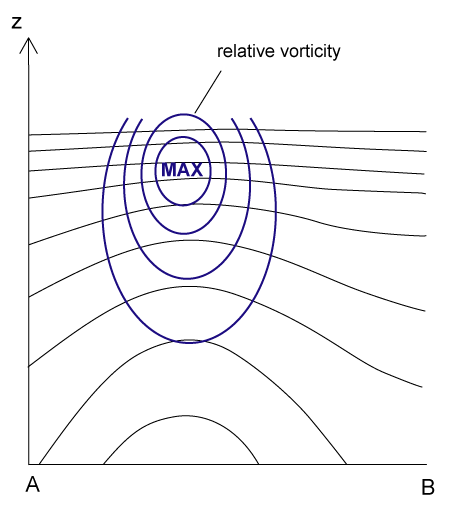
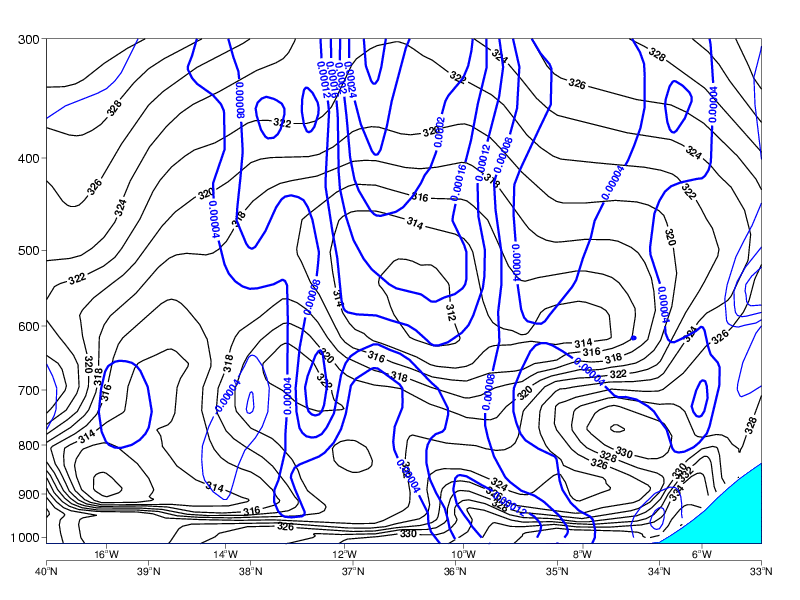
Often there is a conditionally unstable stratification in the lower and middle troposphere, with isentropic values decreasing with height. Otherwise isentropes show a shape of a ridge with the isolines far from each other in the area of the Upper Level Low. - Relative Vorticity:
Due to the cyclonic circulation within the Upper Level Low there is a maximum of relative vorticity. - Temperature Advection:
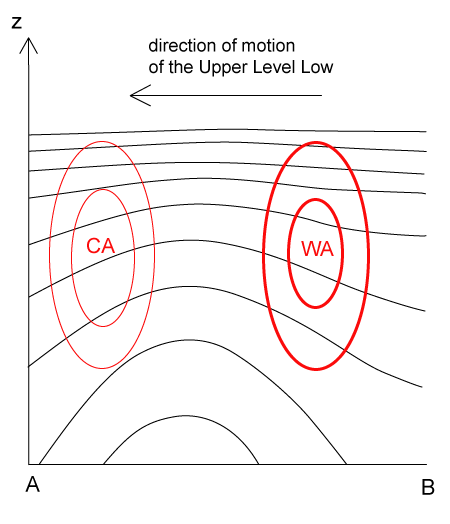
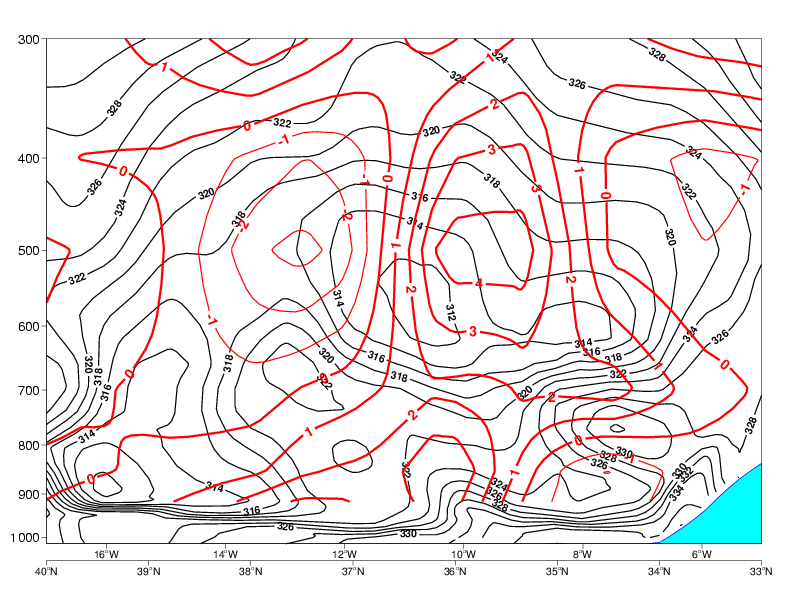
The air within an Upper Level Low is colder than in the surroundings. Therefore, there is distinct cold advection ahead of the Upper Level Low, and warm advection behind it. - Potential Vorticity:
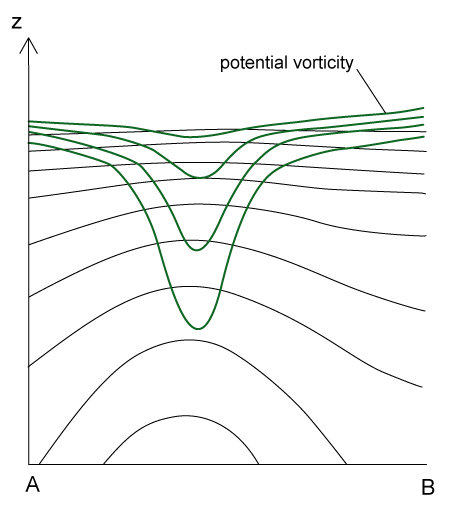
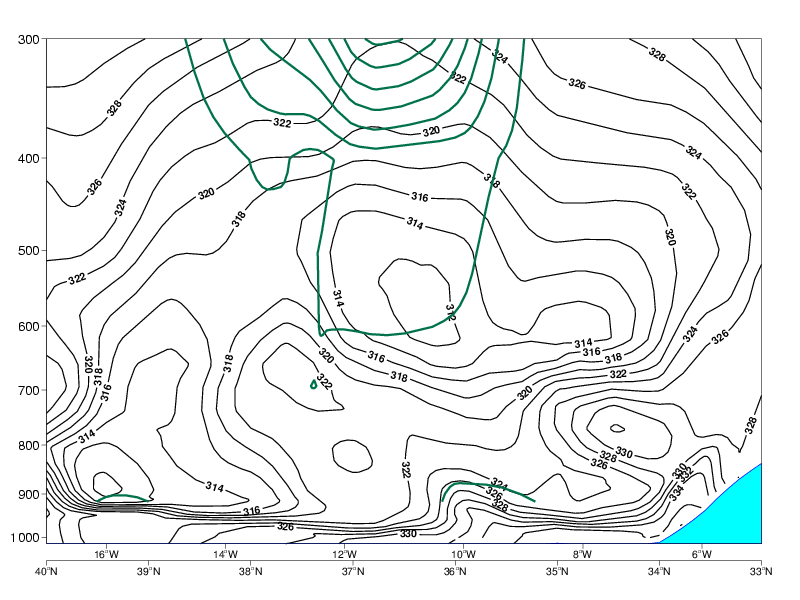
There is a maximum of potential vorticity above the centre of the Upper Level Low.
|
|
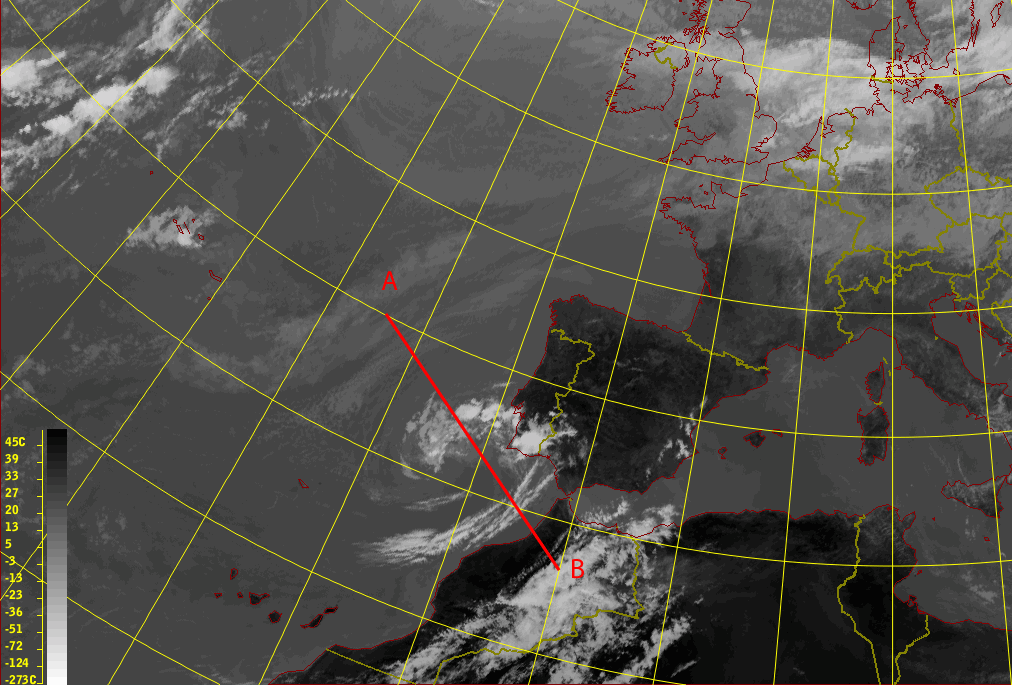
15 September 2005/12.00 UTC - Meteosat 8 IR 10.8 image; position of vertical cross section indicated
|
|
|
Relative vorticity
|
|
15 September 2005/12.00 UTC - Vertical cross section; black: isentropes (Thetae), blue: relative vorticity
|
|
|
Temperature advection
|
|
15 September 2005/12.00 UTC - Vertical cross section; black: isentropes (Thetae), red thin: temperature advection - CA, red thick:
temperature advection - WA
|
|
|
Potential vorticity
|
|
15 September 2005/12.00 UTC - Vertical cross section; black: isentropes (Thetae), dark green: potential vorticity
|
|
|
Special investigation of DANA cases
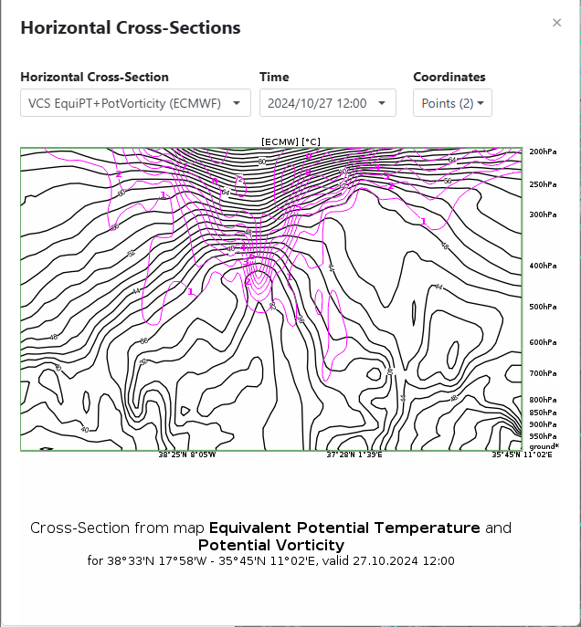
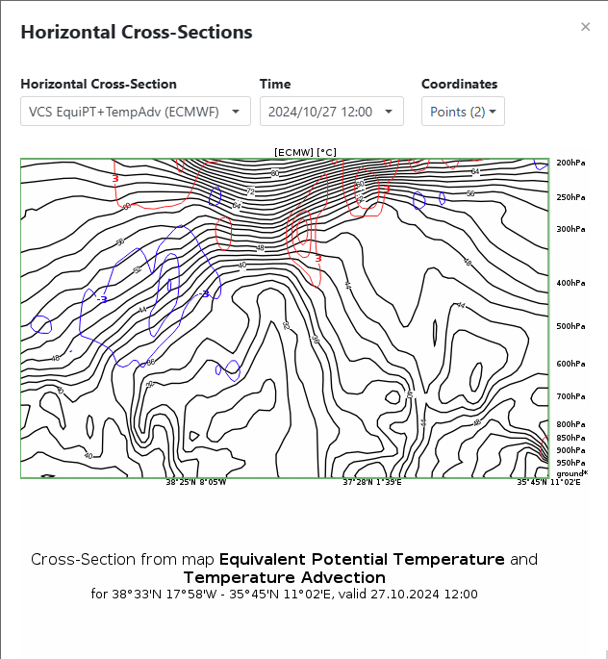
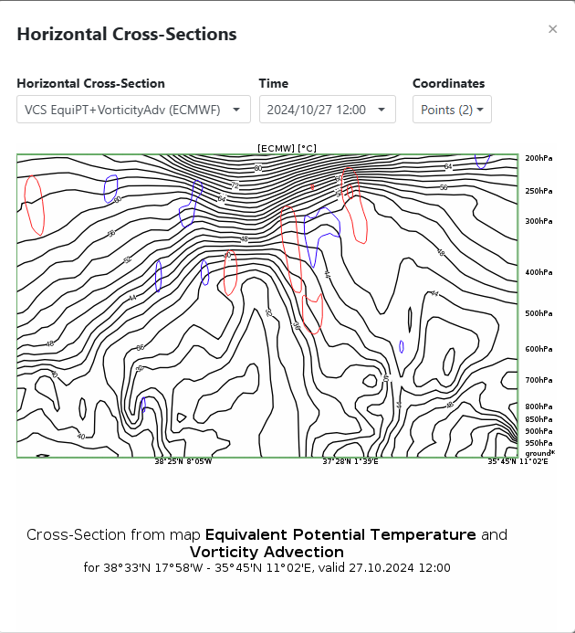
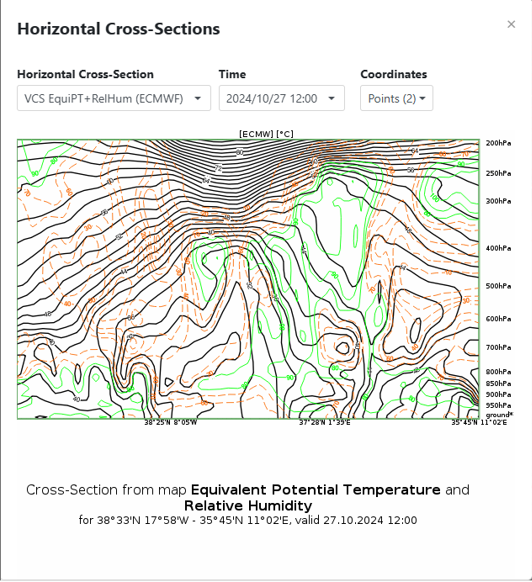
The typical atmospheric state in a DANA situation is illustrated here using isentropes, humidity, PV, TA, and omega in vertical cross sections. The figures below refer to the cut off stage of 27 October 2024 at 12 UTC.
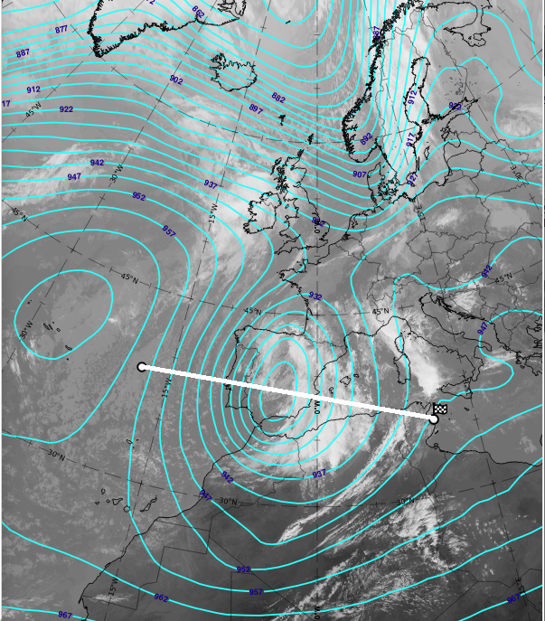
Fig 7:
27 October 2024, 12 UTC. IR;
cyan: geopotential height contours at 300 hPa;
white: line of vertical cross sections
 |
 |
 |
 |
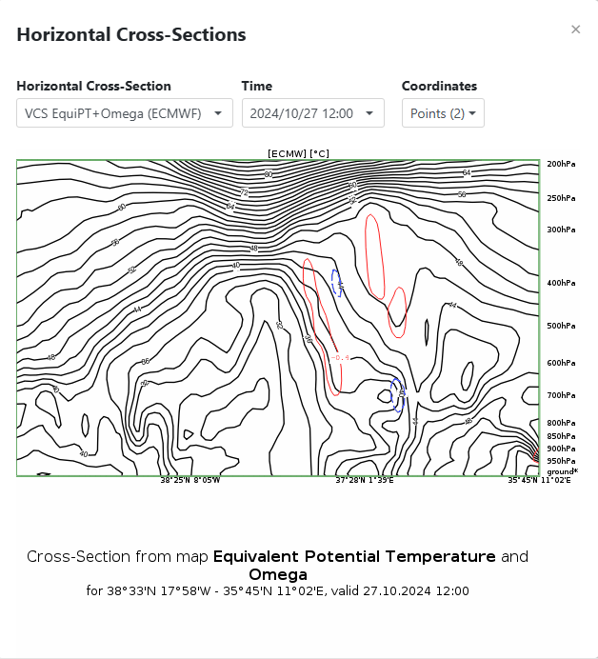 |
Fig 8:
27 October 2024, 12UTC: cut off stage—DANA.
First row left: PV>1.5 units; first row right: temperature advection;
2nd row left: vorticity advection; 2nd row right: humidity;
3rd row: omega.
All the parameters illustrate a very distinct situation which is typical for a cut off stage and the DANA stage over Spain:
There is a very large ridge of isentropes (θe) with two distinct regions with high gradients of contours at the boundaries; the PV anomaly reaches downward to 500 hPa; there is cold advection of dry air in the whole baroclinic zone at the rear, demonstrating the intensification of the cold drop (Gota Fría) at the rearward side (which is mainly over Portugal); there is no notable warm advection at the leading side, which indicates the stationarity of the DANA state; high humidity and very strong upward motion at the leading side (which is over southern and eastern Spain) corresponds to the development of a thick cloud band there. In the chapter on weather events, it can be seen that these cloud fields and cloud bands are connected with many and heavy rain events.
As already mentioned, these vertical cross sections also clearly illustrate the different physical and meteorological states of the atmosphere over Spain and Portugal.