Cloud Structure In Satellite Images
Upper Level Lows are relatively long-lived (mostly from 2 to 10 days) phenomena. Their life cycle consists of three stages:
- Upper level trough
- Tear-off
- Cut-off
- Final stage
1. Upper level trough stage
There is a pronounced upper level trough behind a frontal zone.
Appearance in the basic channels:
- In IR10.8 images, a white or light grey cloud band is connected to the frontal zone on the leading side of the trough, while some thin white cloud stripes due to Cloud Fibres exist on the rearward side. There may possiblybe some convective white cells around the axis of the trough.
- In VIS0.6 images, a white or light grey cloud band is connected to the front on the leading side of the trough. Some convective white cells may exist around the axis of the trough.
- In WV6.2 images, light grey bands occur on the leading and rear part of the trough.
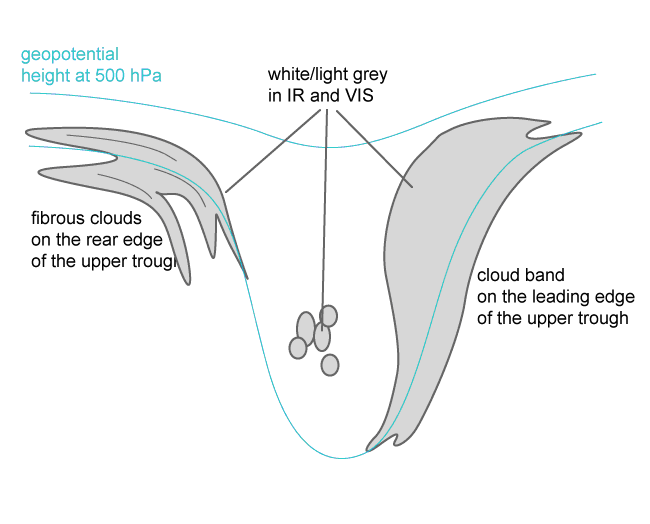
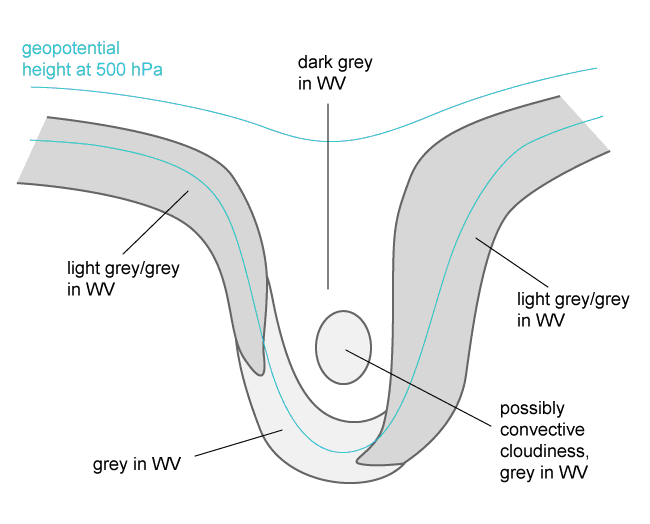
Appearance in the basic RGBs:
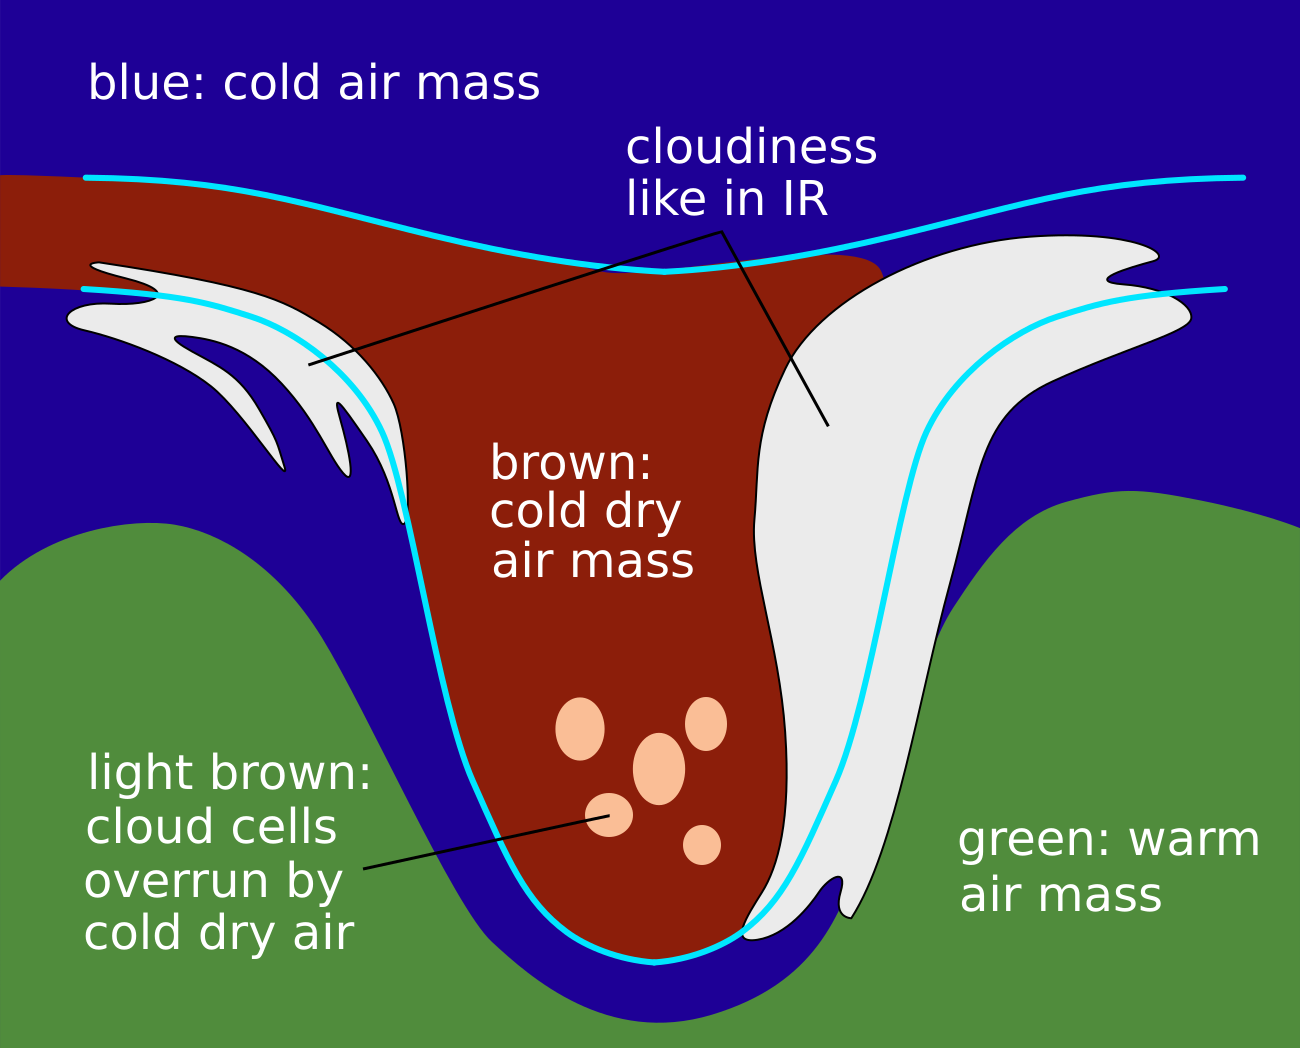
Airmass RGB:
The most important phenomenon here is the dark brown colour within the trough, indicating the cold and dry air there. Cloud bands and fibres at the boundaries of the trough, as well as possible cloud cells within the trough centre, are very similar to IR.
Dust RGB
The cloud free areas within the trough show blue to pinkish blue colours, while the cloud band at the leading side of the trough usually exhibits dark red colours, indicating thick ice cloud. If clouds exist at the rearward side, it can vary from dark red to black depending on the thickness of the ice clouds there. If there is already cold air cloudiness in the trough centre, this stage of the cut off process usually results in ochre cloud colours, indicating that the cloud-tops are low to mid-level. For cases over land in wintertime, this centre can also be filled by ochre mid-level cloud patches.
 |
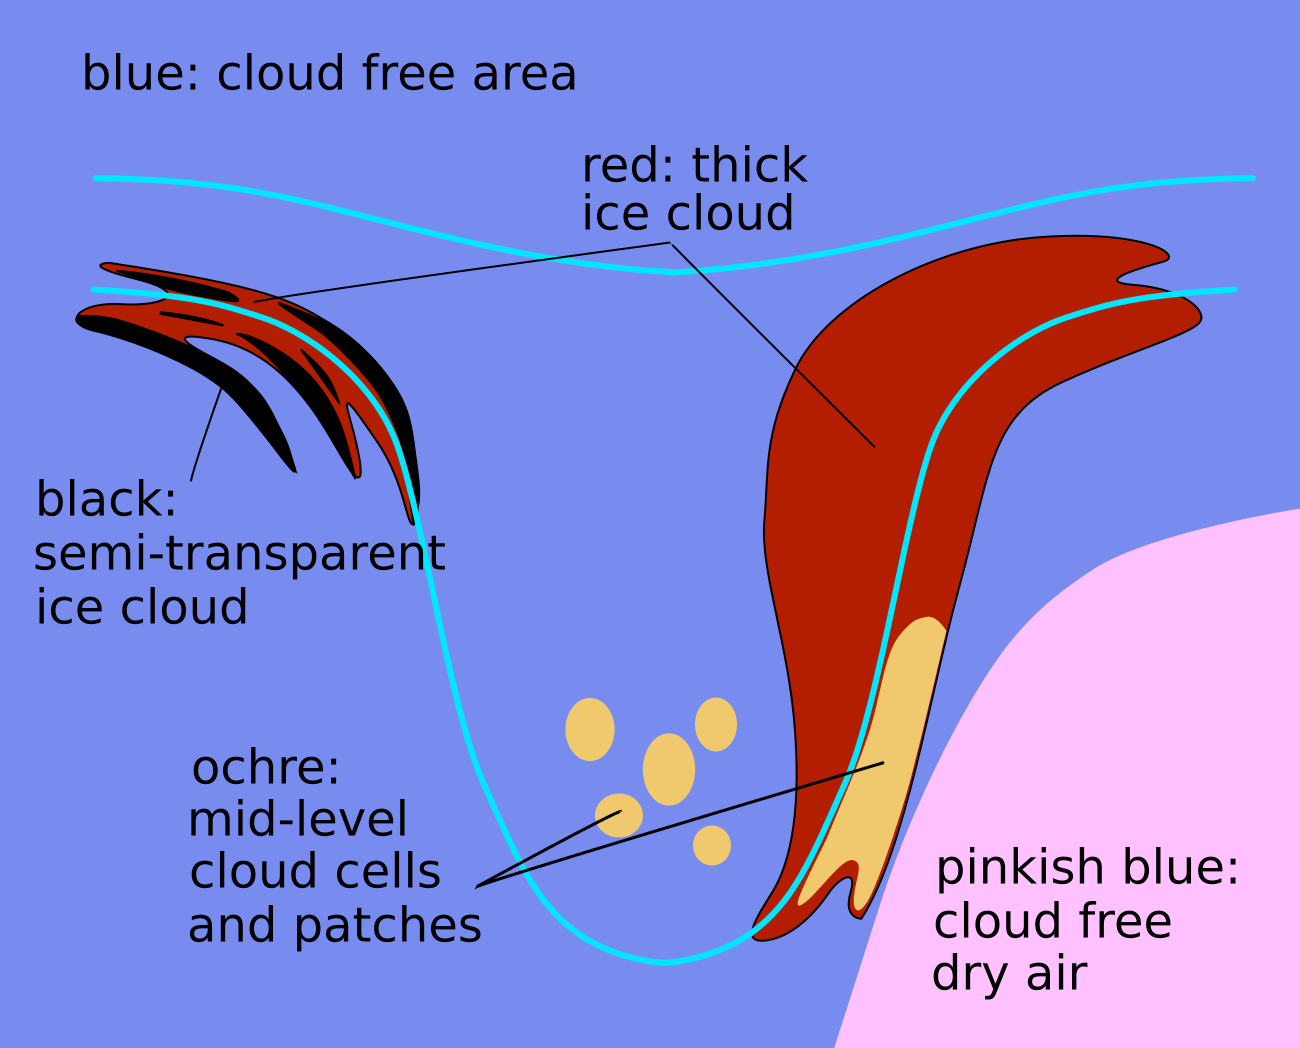 |
Legend: Cut off process: trough stage, Left: air mass RGB; right: dust RGB.
2. Tear-off
The bottom of the upper trough is detached from the main stream resulting in a closed circulation.
Appearance in the basic channels:
- In IR10.8 images, a white to light grey cyclonically curved cloud band is on the leading side of the trough - possibly also on the rear side. Some white convective cells may occur between the bands.
- In VIS0.6 images, a grey cyclonically curved cloud band exists on the leading side of the trough, possibly also on the rear side. Some white convective shells may occur between the bands.
- In WV6.2 images, a grey cyclonically curved cloud band exists around the detaching low.
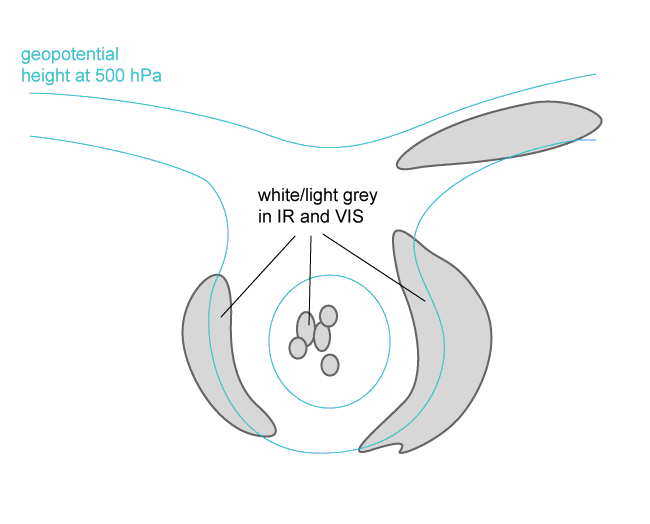
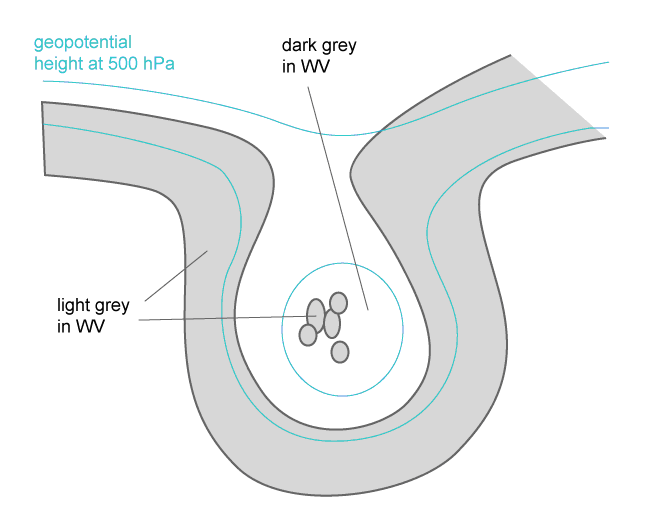
Appearance in the basic RGBs:
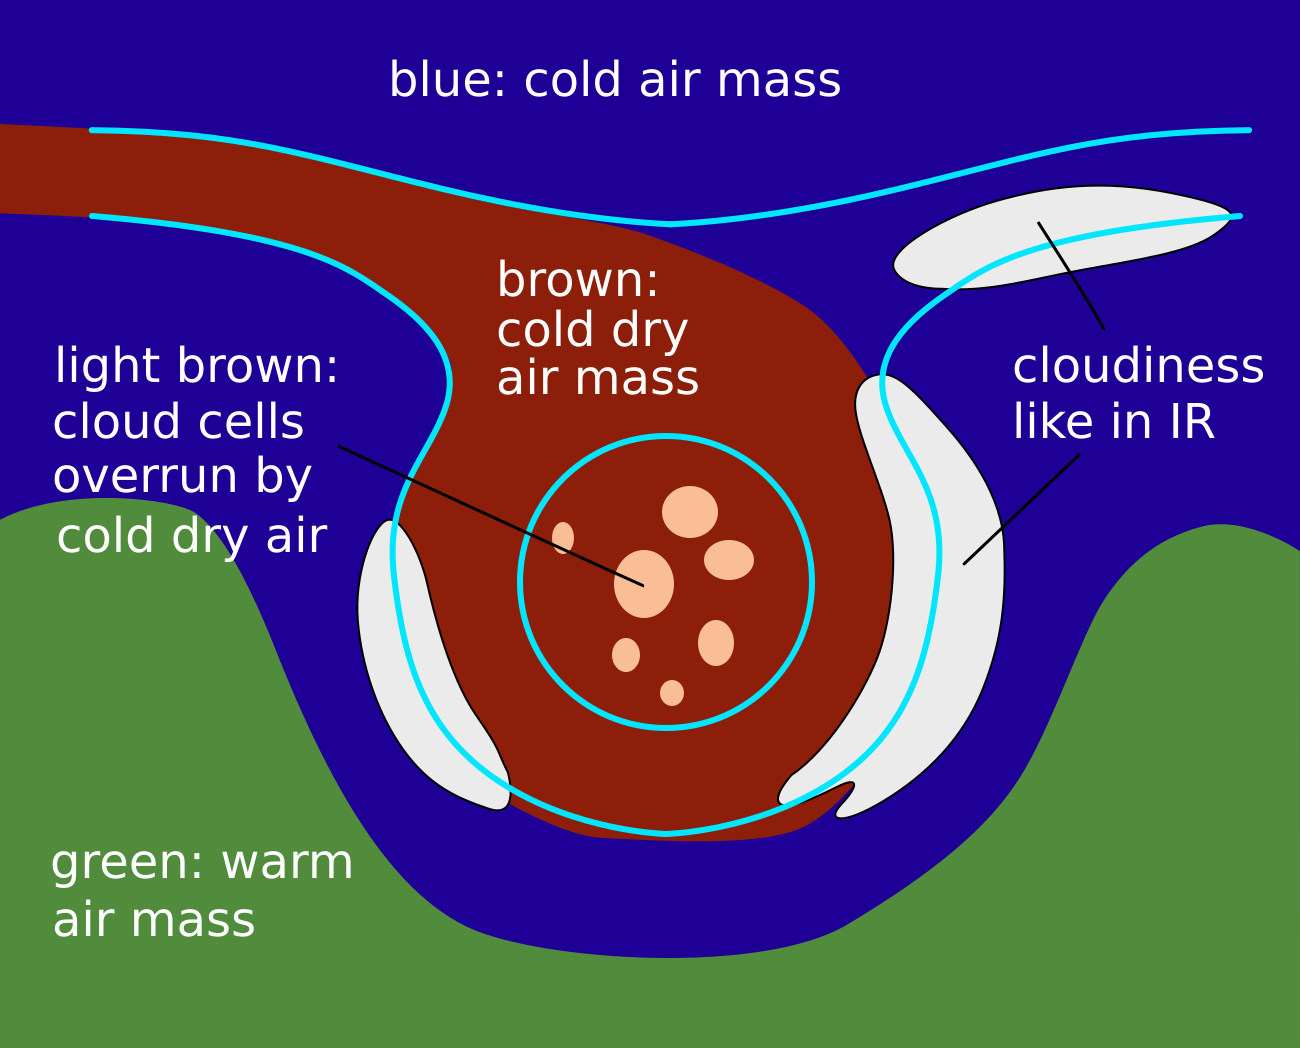
Airmass RGB
At this stage of the cut-off process, air mass composition makeup is the same as the trough stage before: dark brown colours in the centre are concentrated in the circle-like centre and cold air cloud (if it exists) is mostly overrun by this dry air, which results in a more ochre colour. Existing cloud bands at the boundaries are similar to those in the IR channel. Often the cloud band at the rear of the former trough is only weakly developed, or is not present at all.
Dust RGB
The same as before the cloud boundaries vary between ochre and dark red; the same is true for the clouds in the centre which often start to increase in thickness.
 |
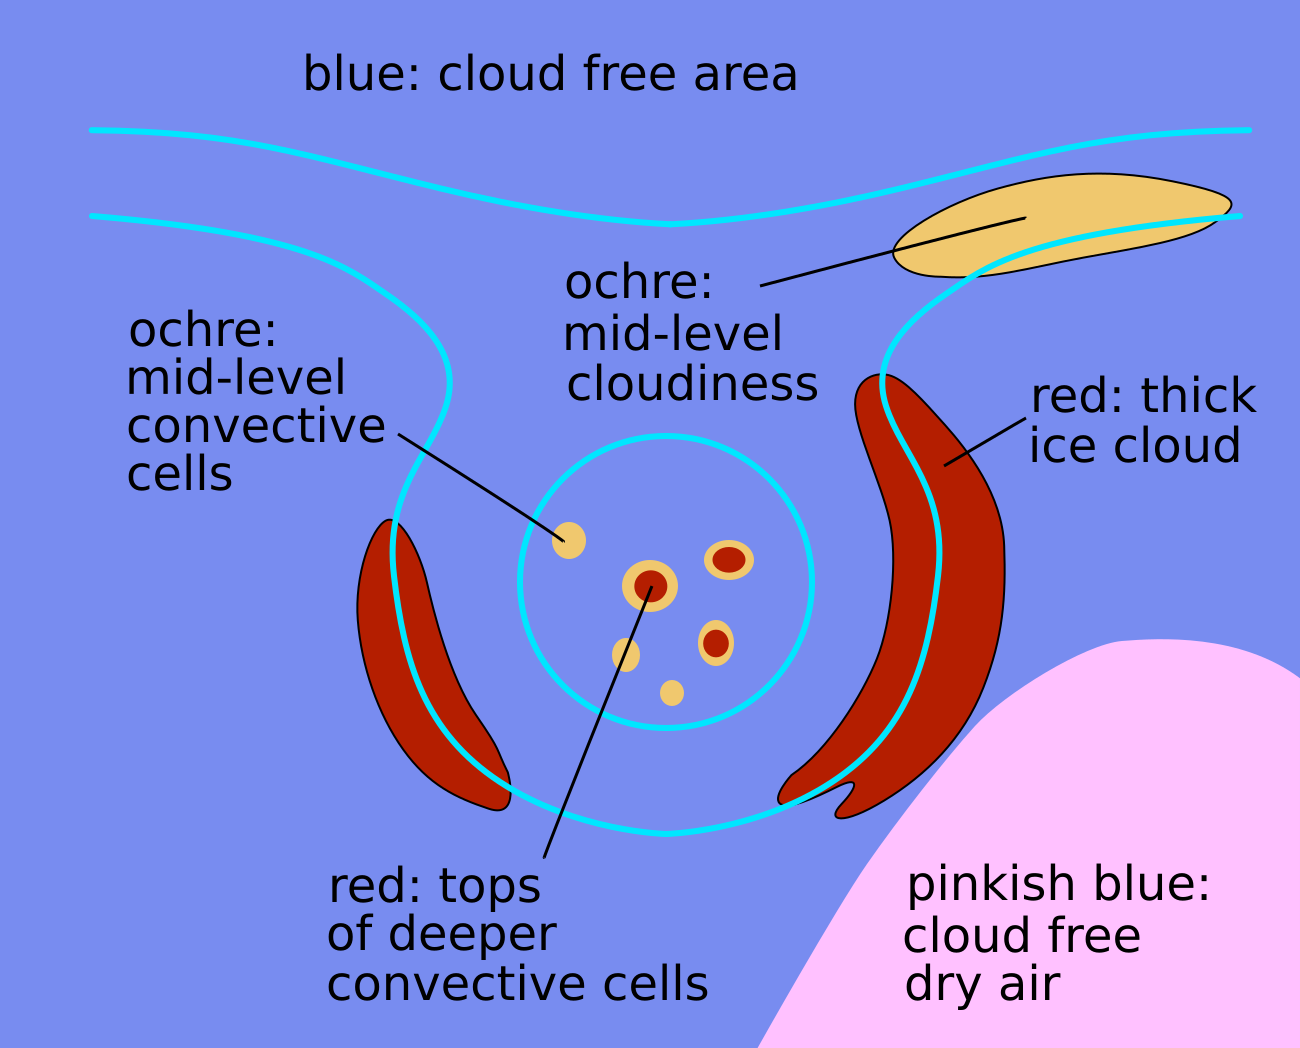 |
Legend: Cut off process: tear-off stage, Left: air mass RGB; right: dust RGB.
3. Cut-off stage
The Upper Level Low is separated from the main upper stream.
Appearance in the basic channels:
- In IR10.8 and VIS0.6 images, white to light grey cyclonically curved cloud bands exist on the leading and rearward side of the low, later forming a spiral. Some white convestive cells may exist within it.
- In WV6.2 images, a round area or a spiral of grey clouds exist, with some white cells on the leading side.
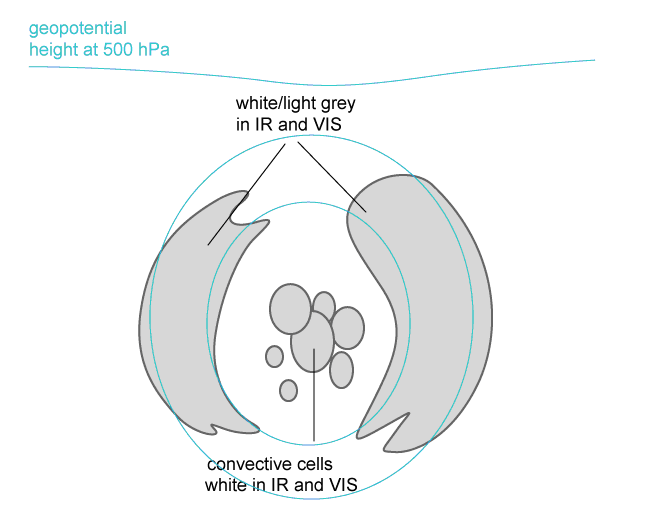
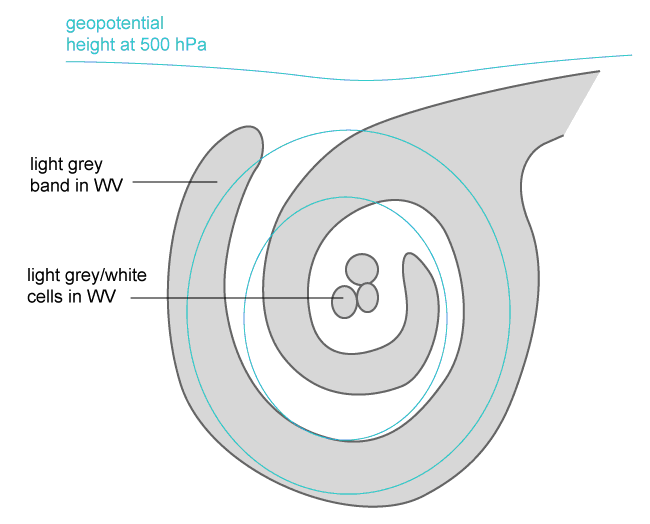
Appearance in the basic RGBs:
Airmass RGB:
In the cut-off stage the airmass RGB is a further development of the stage before. The most pronounced feature is the dark brown colour in the cold and dry centre.
Dust RGB
The most pronounced features are the dark red, thick ice cloud in the cloud band, which are spiralling around the cut off low centre. Cold clouds in this centre are now thick, demonstrated by the dark red colour for thick ice cloud.
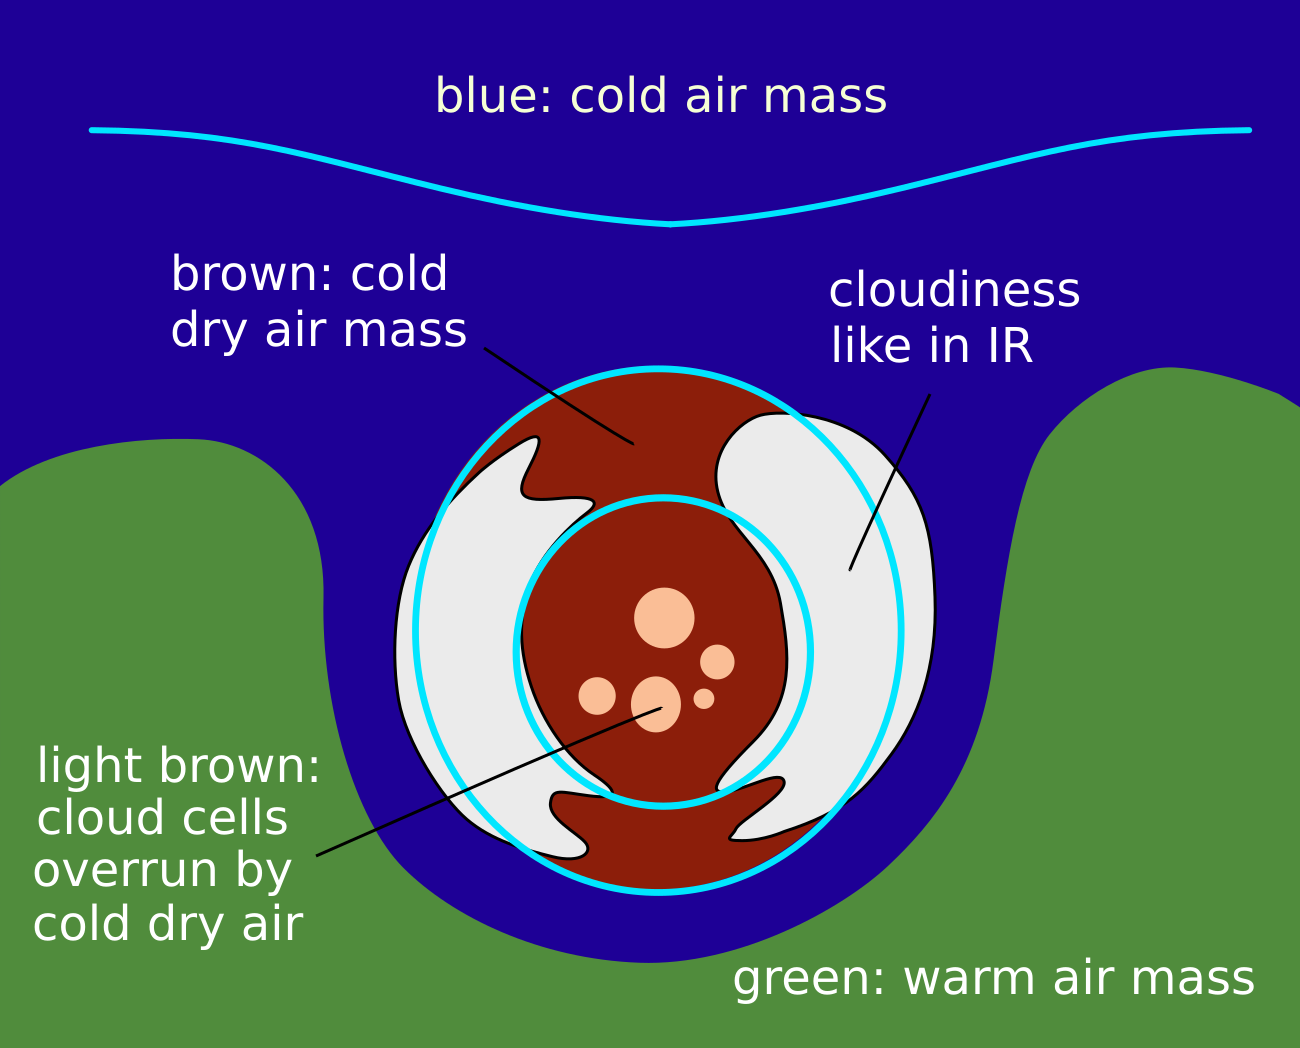 |
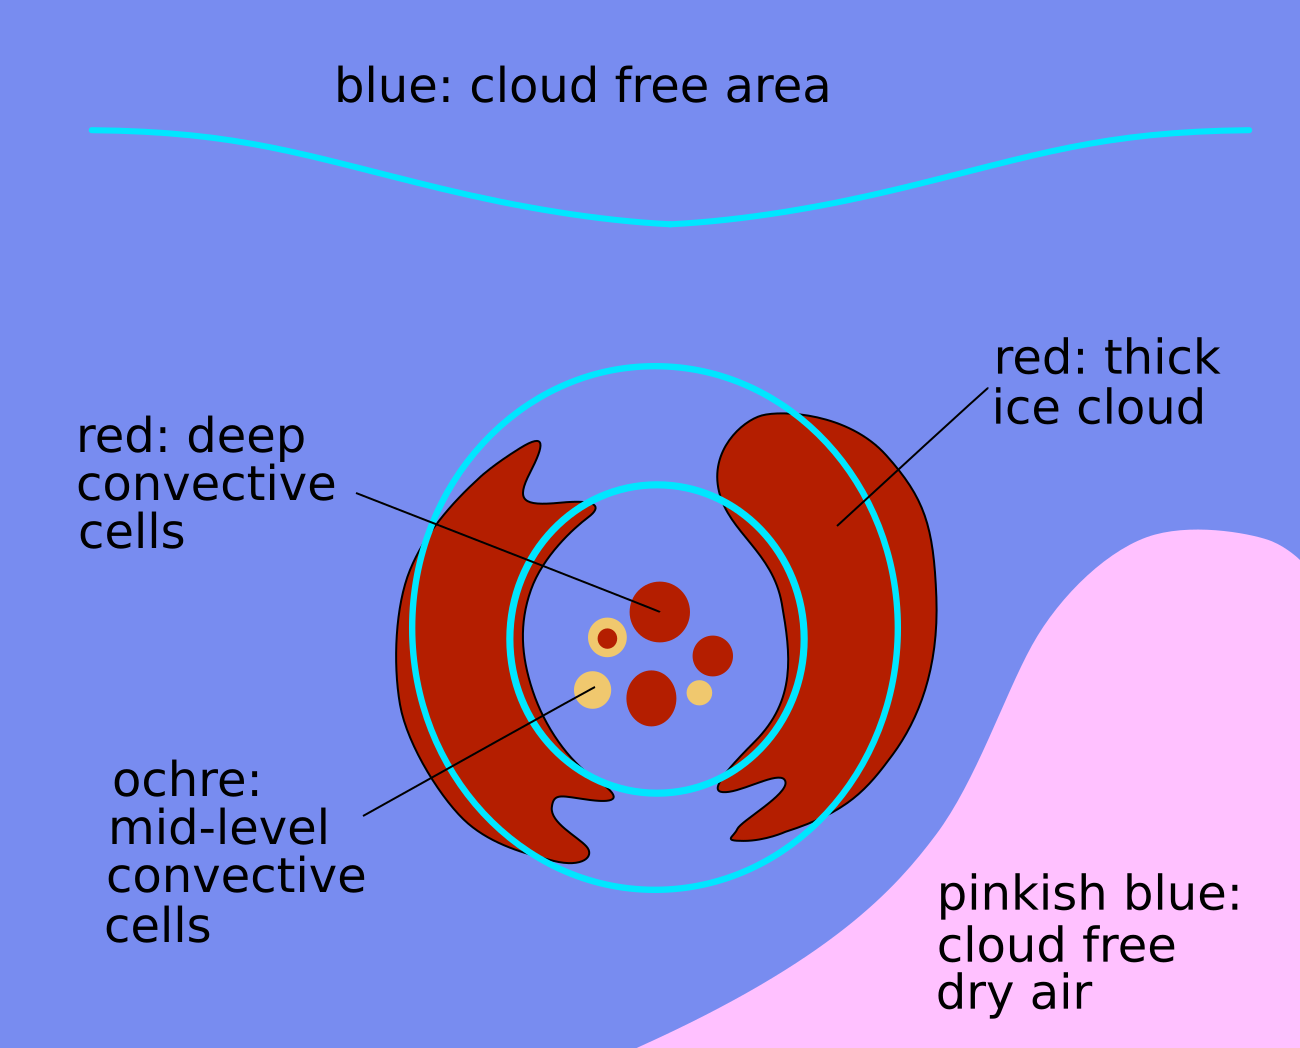 |
Legend: Cut off process: cut-off stage, Left: air mass RGB; right: dust RGB.
4. Final stage
The Upper Level Low merges with the main stream, or dissolves slowly while being almost stationary.
Appearance in the basic channels:
- In IR10.8 and VIS0.6 images there are light grey cyclonically curved stripes that merge with the white cloud band of a frontal zone.
- In WV6.2 images there is a dark grey area that soon disappears under the light grey area of the frontal zone.
Cut-off processes can last several days. During this long development phase, cloud features can vary a bit from the ideal schematics or show only some features from it. In the two cases shown below, typical areas for cut-off processes over Europe are shown.
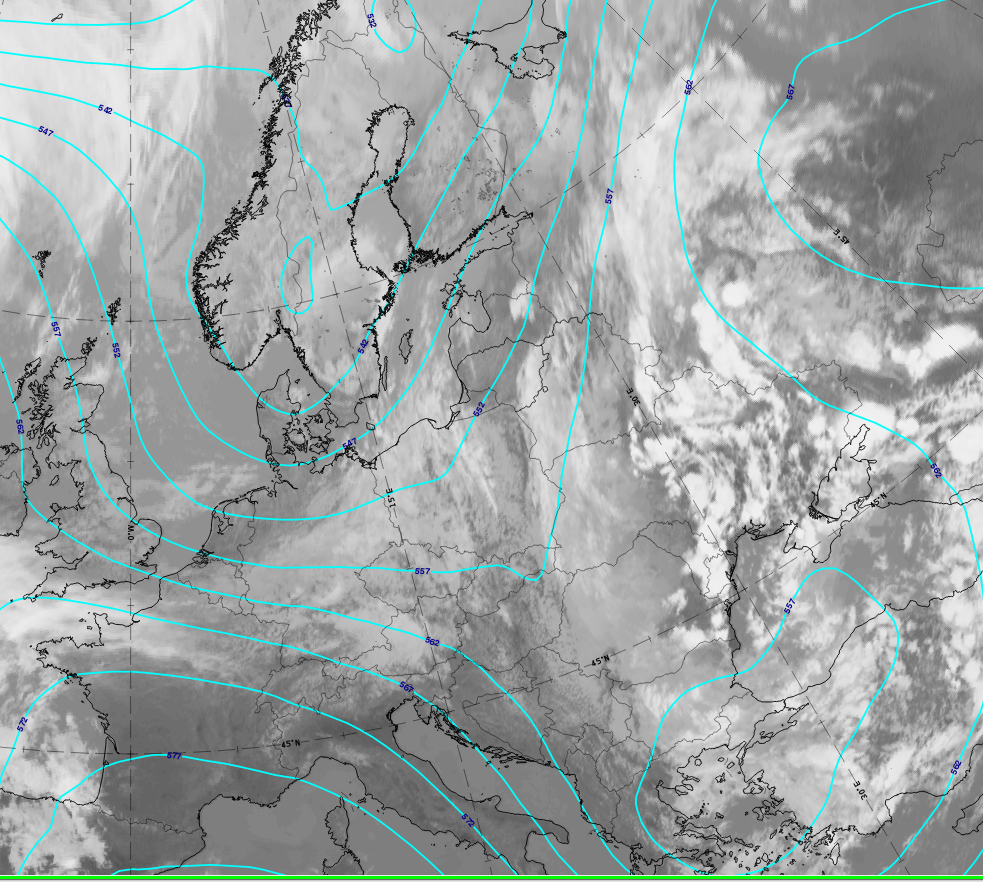
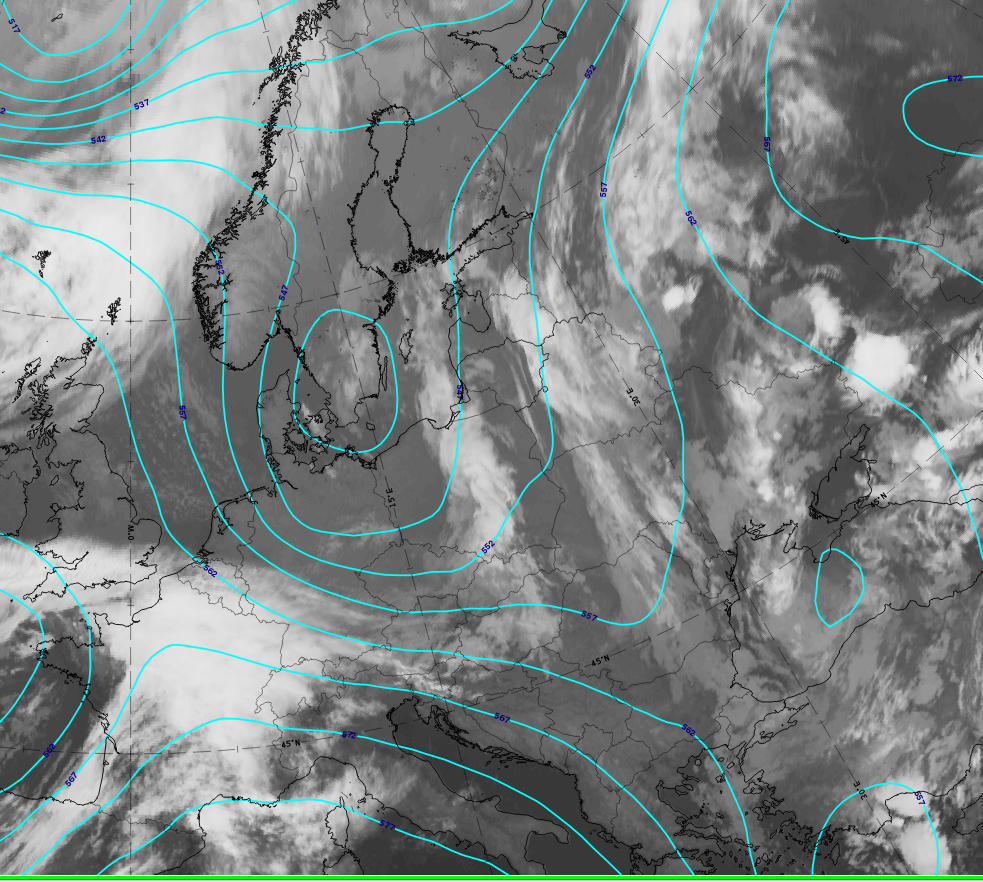
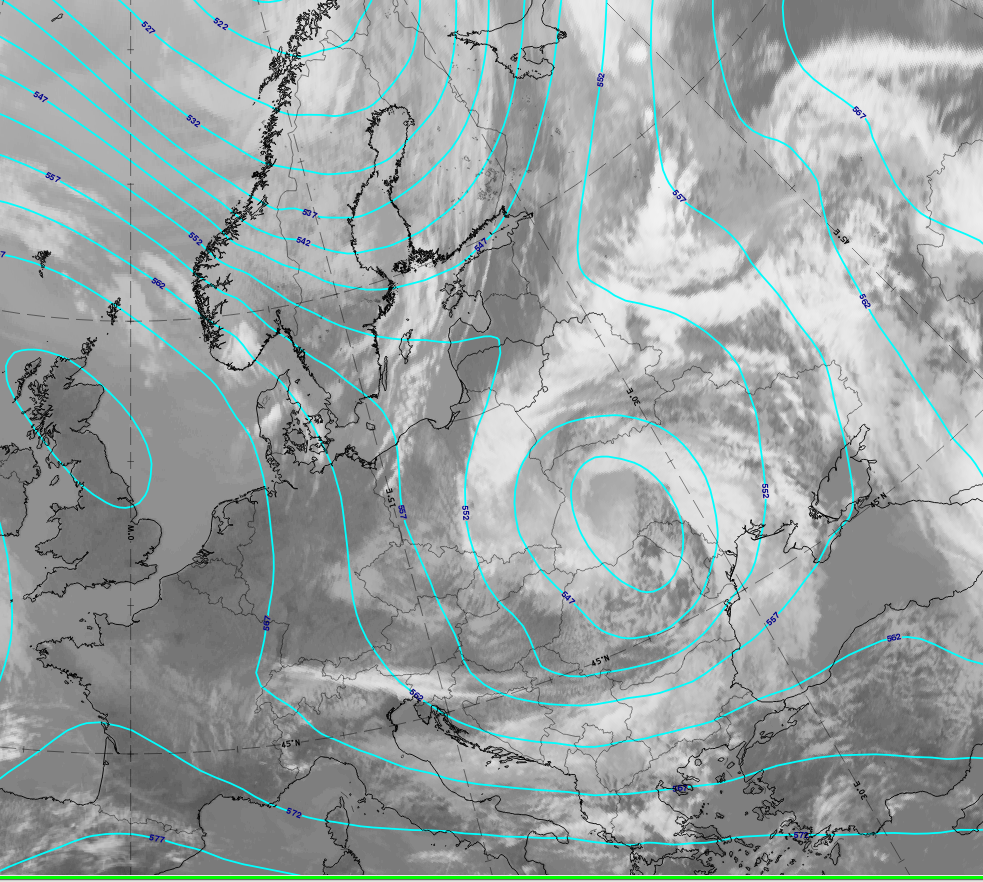
In the case of 4 - 7 May 2020 the cut-off process starts with a trough over Scandinavia which moves and develops into Central Europe. The trough and the tear off stage are accompanied by less distinct cloud features than those described for a well-developed case. However, the cut-off and final stage are very distinct.
 |
 |
 |
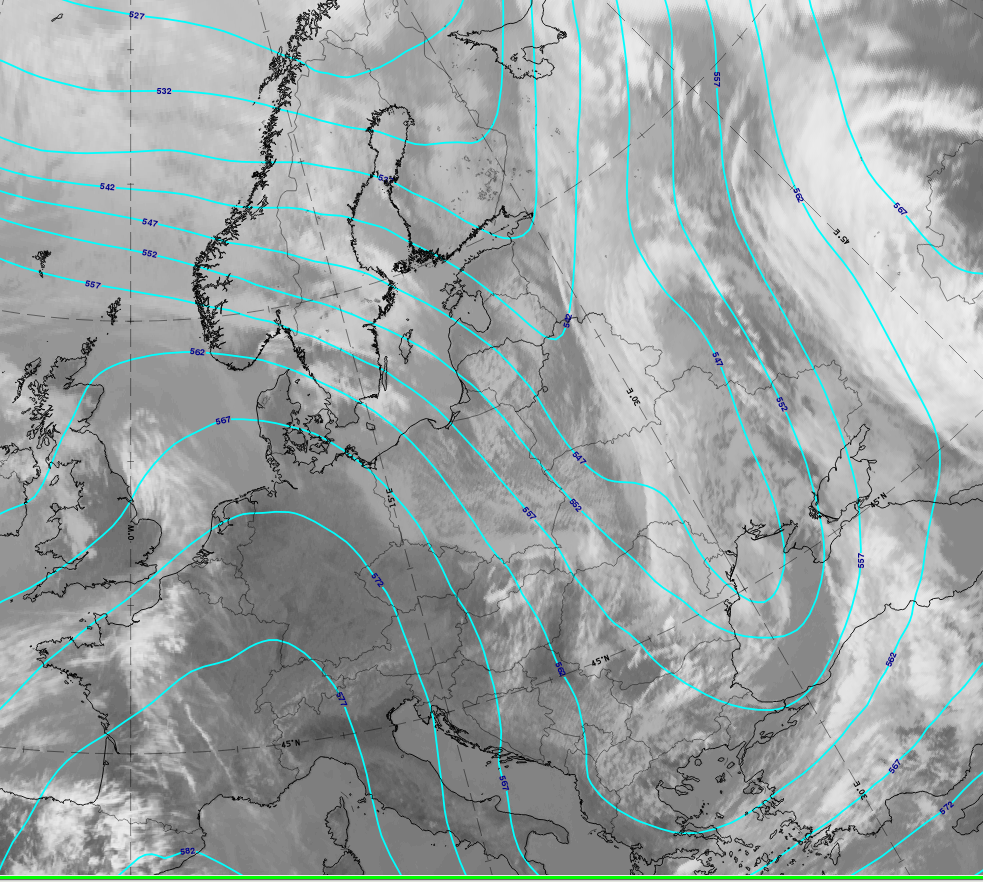 |
4 - 7 May 2020: cut-off process: IR; cyan lines: Height contours 500 hPa.
u.l.: 4 May at 12 UTC trough stage; u.r.: 5 May at 3 UTC tear-off stage; l.l.: 6 May at 12 UTC cut-off stage; l.r.: 7 May at 12 UTC final stage.
*Note: click on the image to access image gallery (navigate using arrows on keyboard)
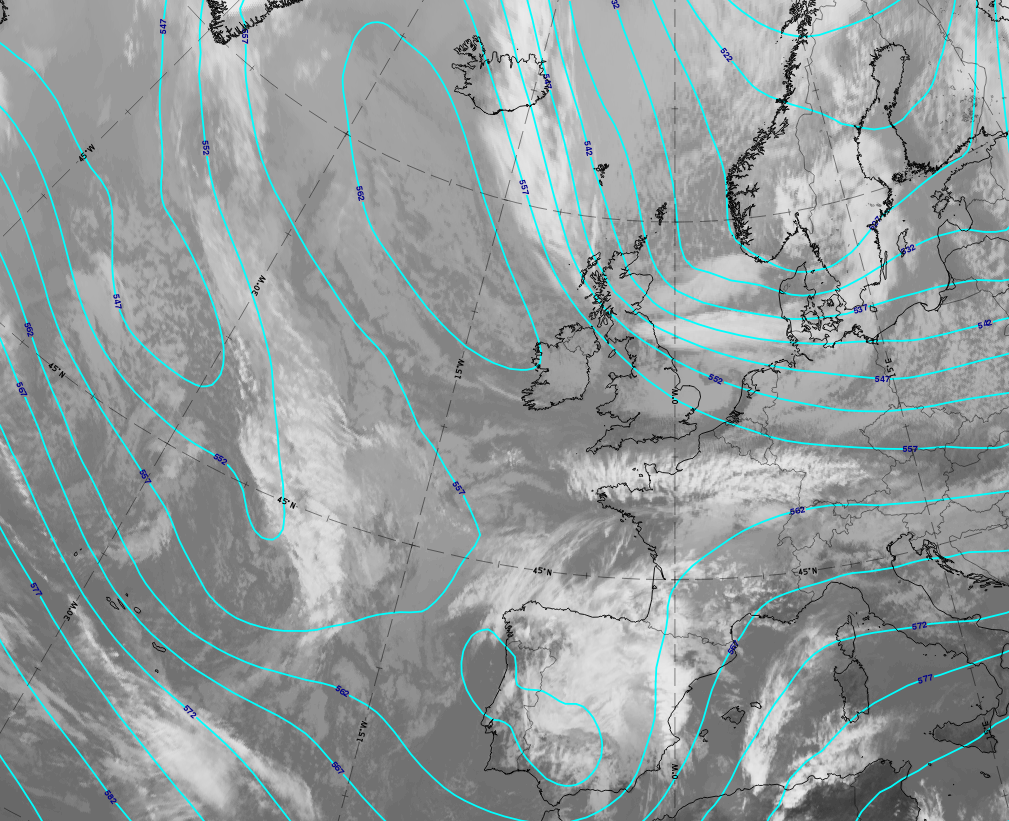
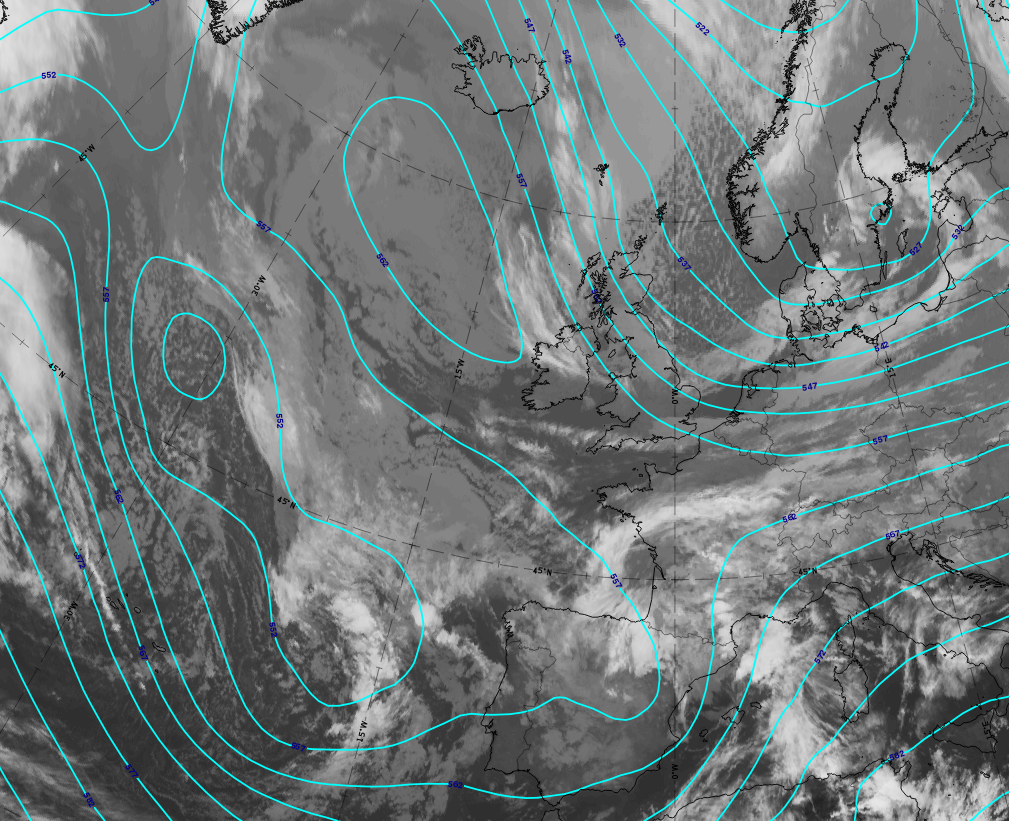
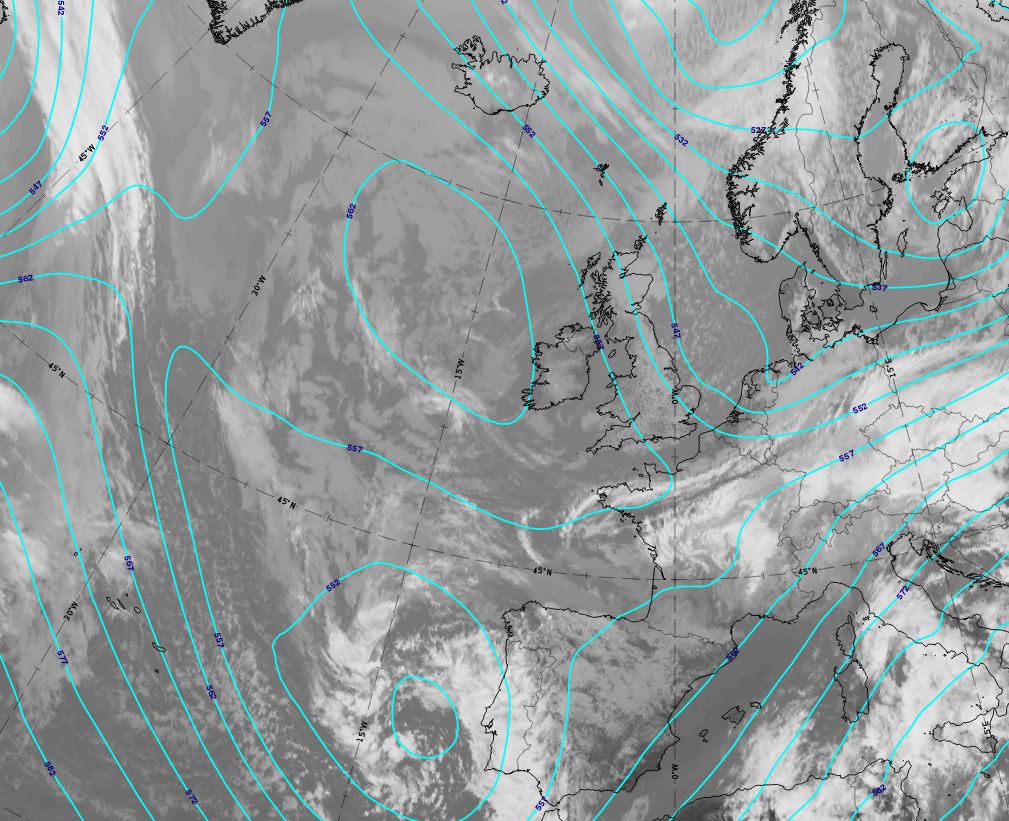
The second case which is from 12 - 14 May (and continued beyond this), starts with a trough over the Atlantic and during the cut-off process this shifts to the southeast with a very well-developed cut-off stage over Spain. All stages have very pronounced cloud features but a final stage cannot be observed - the cut-off feature lasts for several days longer and thereby moves southward out of the panel frame.
 |
 |
 |
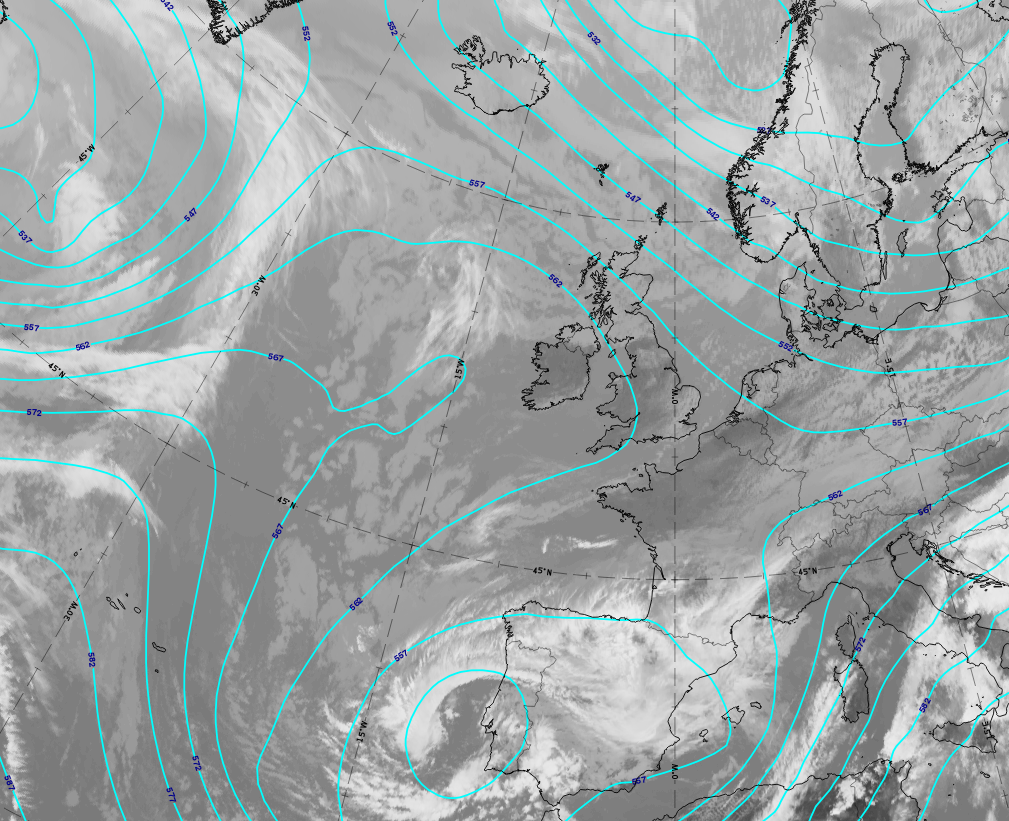 |
12 - 14 May 2020: cut-off process: IR; cyan lines: Height contours 400 hPa.
u.l.: 12 May at 15 UTC trough stage; u.r.: 13 May at 00 UTC tear-off stage; l.l.: 13 May at 15 UTC cut-off stage; l.r.: 14 May at 12 UTC advanced cut-off stage.*Note: click on the image to access image gallery (navigate using arrows on keyboard)
The case of 4 - 7 May 2020 is chosen for demonstrating the basic channels and the basic RGBs for the typical cut-off development stages.
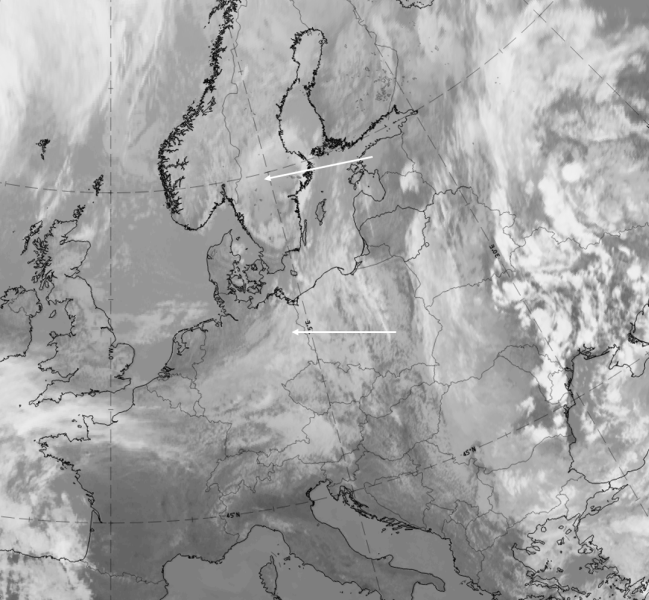
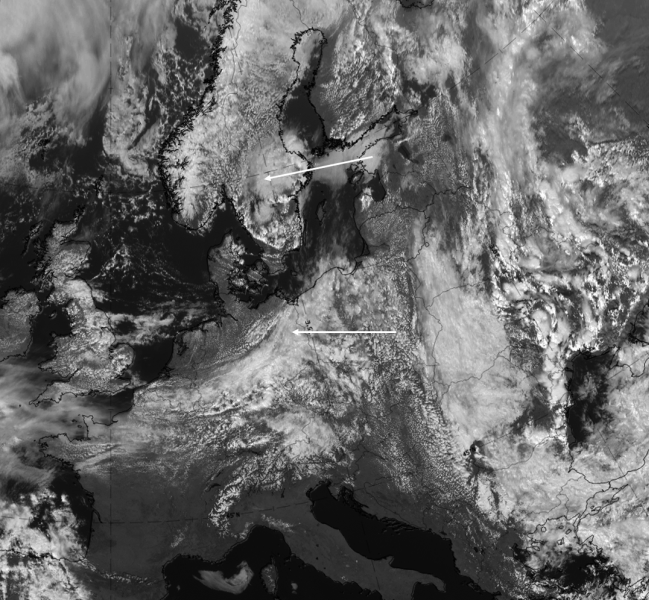
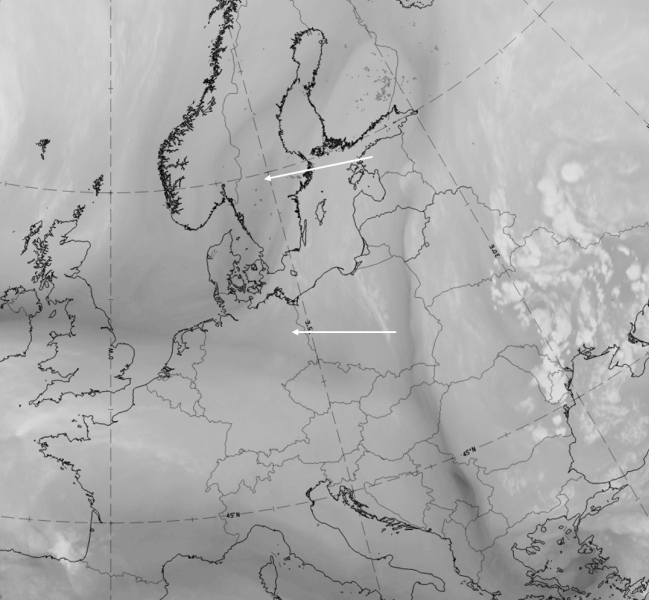
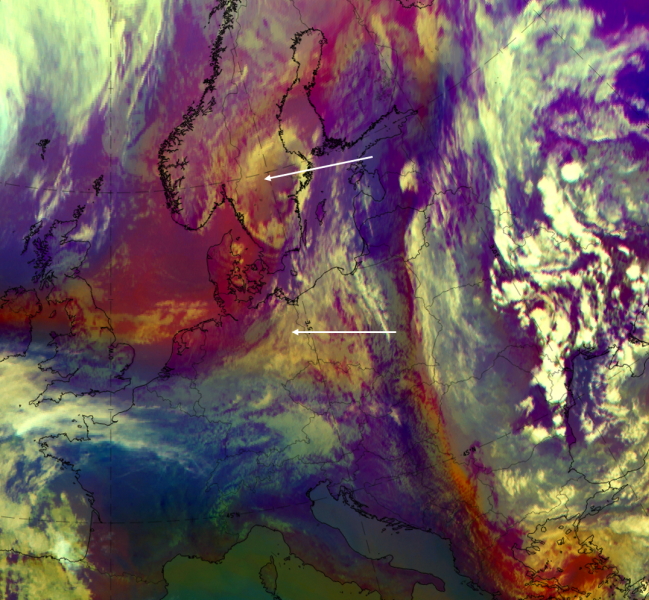
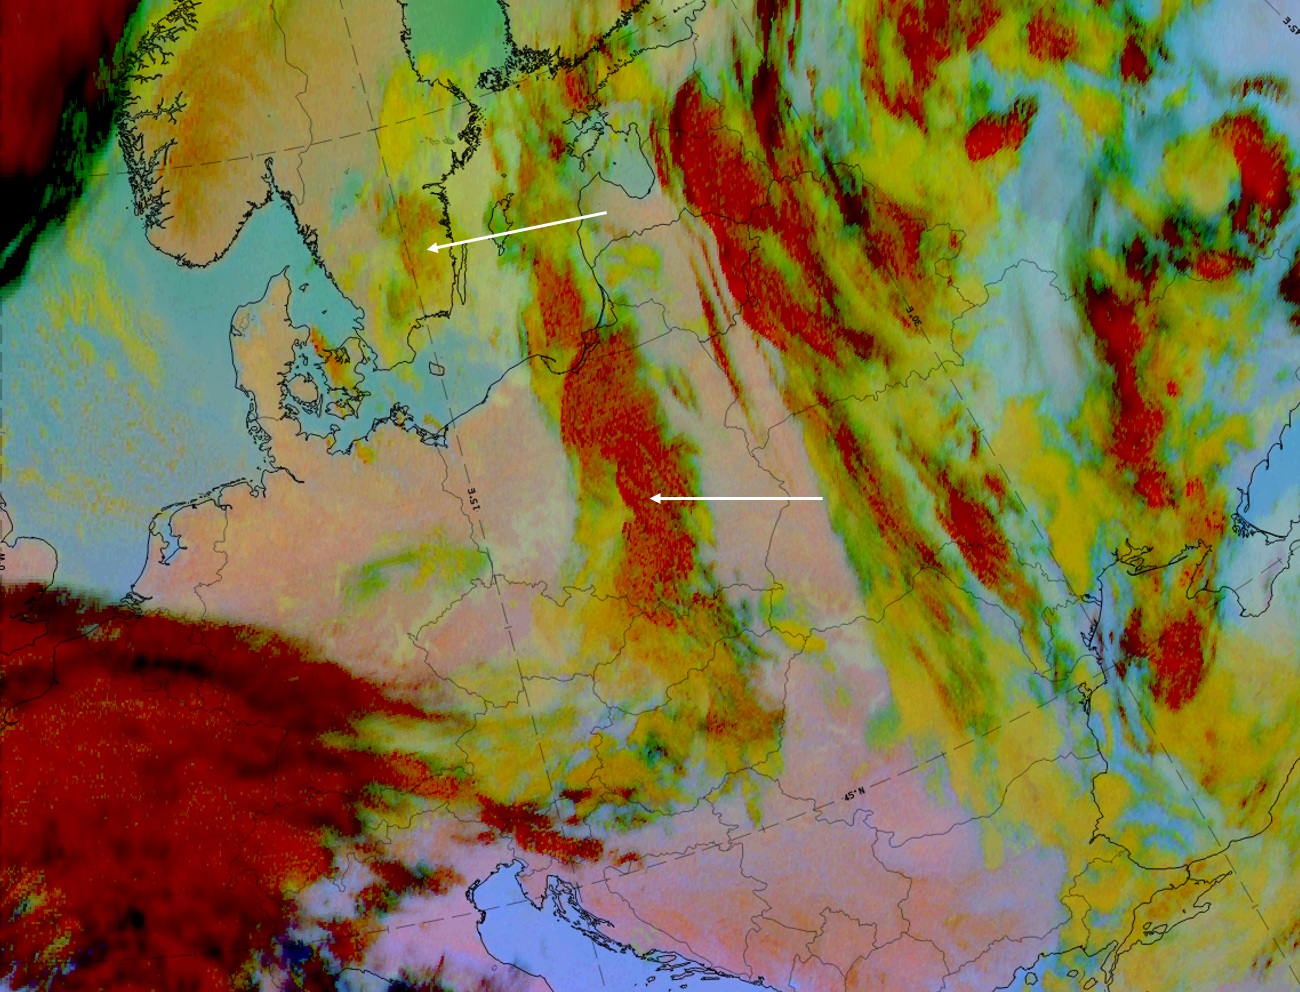
Trough stage: 4 May 2020 at 12 UTC
Frontal cloud band at the southern leading side of the trough over Germany and Poland; some cloud cells and patches in the trough centre over south Sweden; no cloud system at the rear side of the trough.
|
|
|
|
Legend:
4 May 2020 at 12UTC: 1st row: IR (above) + HRV (below); 2nd row: WV (above) + Airmass RGB (below); 3rd row: Dust RGB (black arrows indicate the cloud band at the rear of the trough, as well as cold air cloudiness within the trough) + image gallery.
*Note: click on the Dust RGB image to access image gallery (navigate using arrows on keyboard).
| IR | A light grey to white cloud band exists at the southern leading side of the upper level trough. Some light grey clouds exist in the trough centre over Southern Sweden. No cloud system exists at the rear side of the trough - the next cloud system is far to the NW. |
| HRV | A white cloud band at the leading side of the trough, with white cells in the trough centre over Sweden. |
| WV | The whole area shows grey colours but not distinct band-like structures; darker grey colours exist in the trough centre over Sweden. |
| Airmass RGB | Dark brown colours in the trough centre representing the cold and dry air; clouds at the leading side are overrun by cold air (blue colours) in the south and cold and dry air (brown colours) to the north. |
| Dust RGB | A cloud band at the leading side is mostly ochre in colour, representing mid-level cloud. Some fibres also exist. |
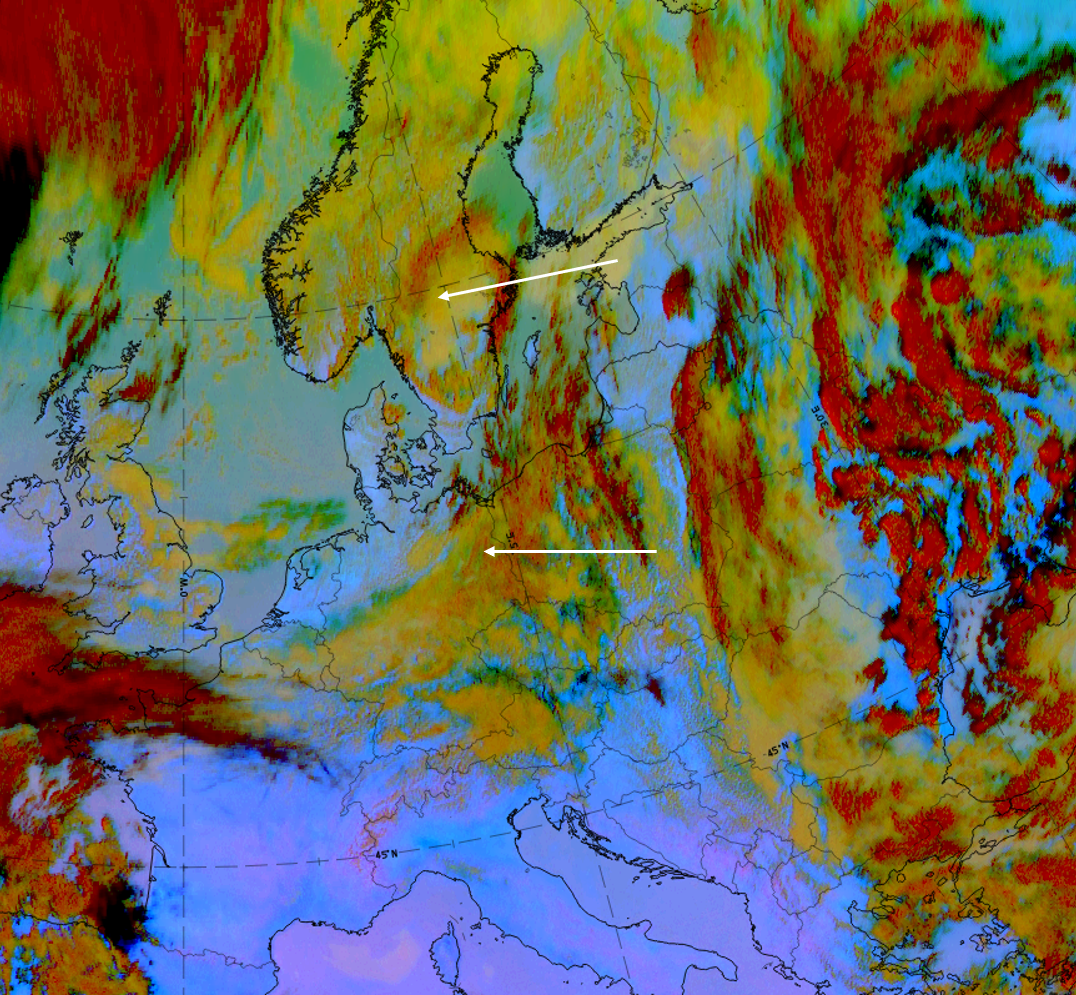
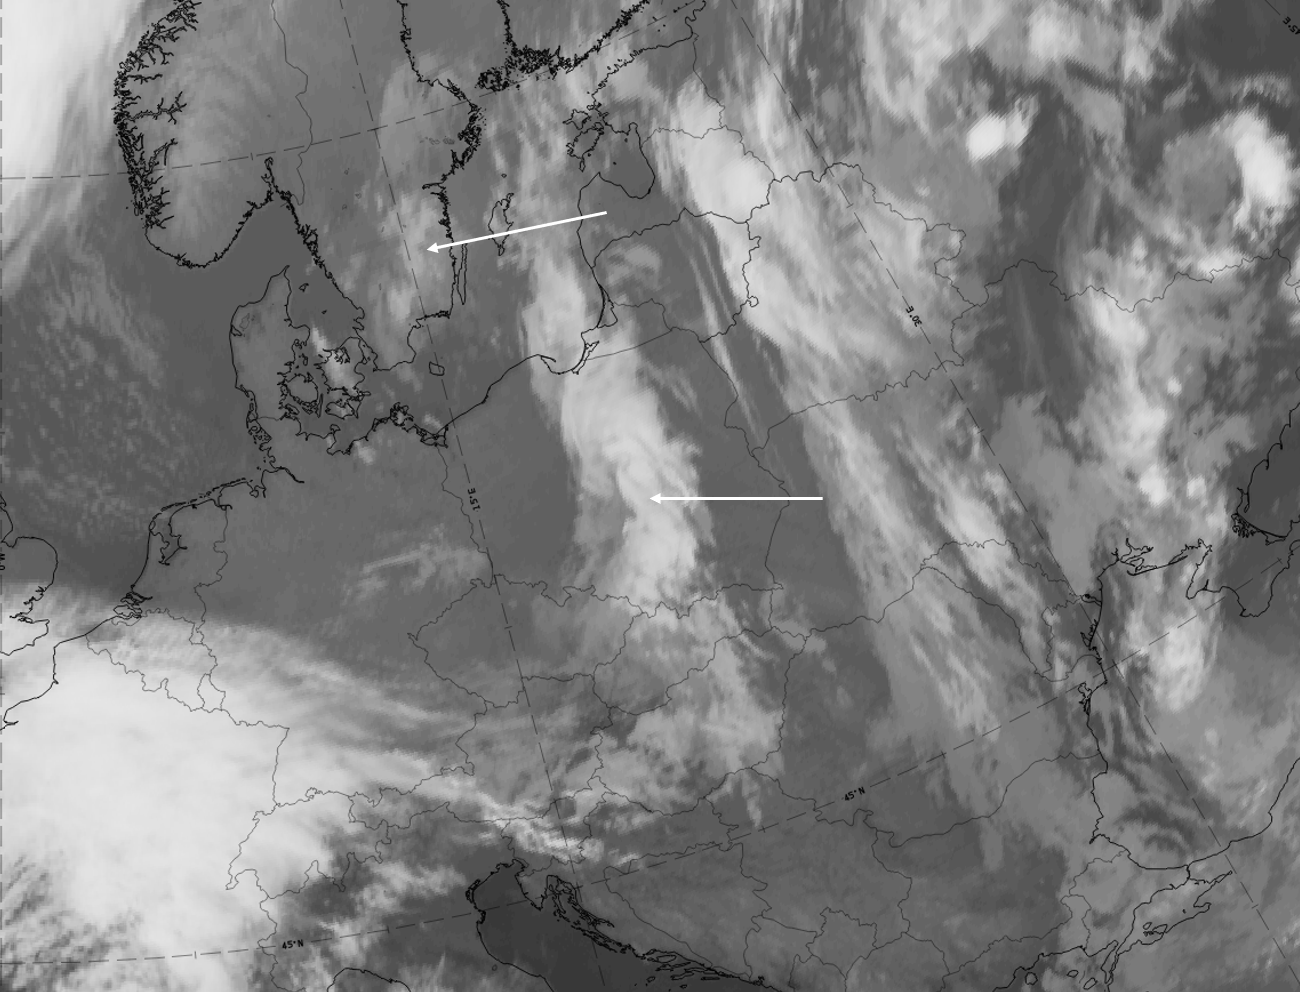
Tear-off stage: 5 May 2020 at 03 UTC
The cloud band at the leading edge of the torn-off low can be seen over Poland. Some cloud cells exist in the low centre over Southern Sweden and some fibrous clouds from the next system exist over Northern Norway.
|
|
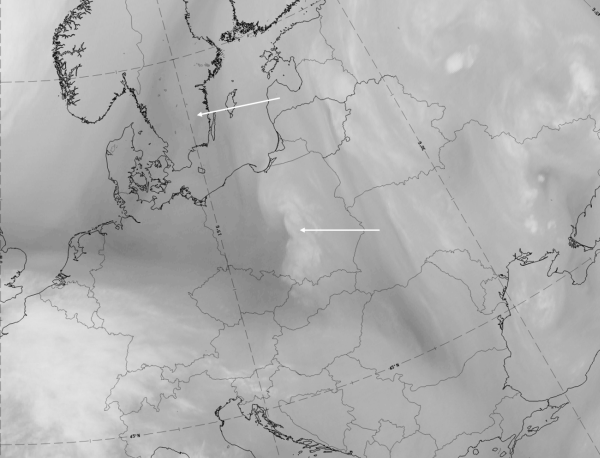
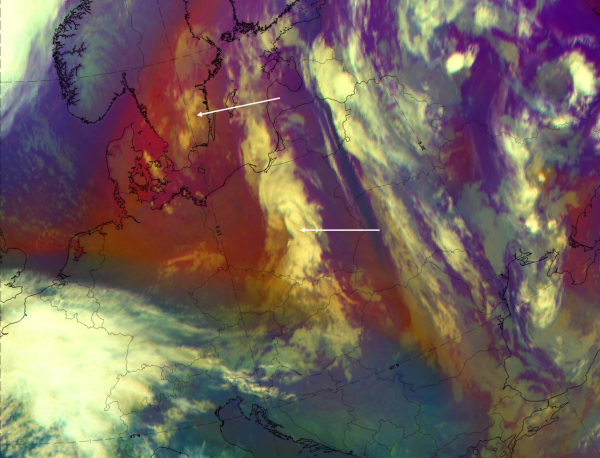
5 May 2020 at 03UTC: 1st row: IR; 2nd row: WV (above) + Airmass RGB (below); 3rd row: Dust RGB + image gallery.
*Note: click on the Dust RGB image to access image gallery (navigate using arrows on keyboard).
| IR | All three cloud systems accompanying the leading side, the centre and the rearward side of the tear-off low, are white. |
| HRV | Not available at this point of time. |
| WV | Light grey colours on the cloudy areas, especially at the leading side; dark grey shades exist in the centre of the torn-off low; cyclonic rotation becomes visible. |
| Airmass RGB | Dark brown colours partly in the tear-off low centre and above the cold air cloud; very bright cloud band at the leading side. |
| Dust RGB | Dark red colours are the cloud band at the leading side of the tear-off low, indicating thick ice cloud; the same is true for small cold air clouds in the centre over Southern Sweden; the cloud free areas are mostly in pinkish blue, indicating higher humidity in the air near the ground below. Some greenish areas indicate thin mid-level cloud. |
Cut-off stage: 6 May 2020 at 12 UTC
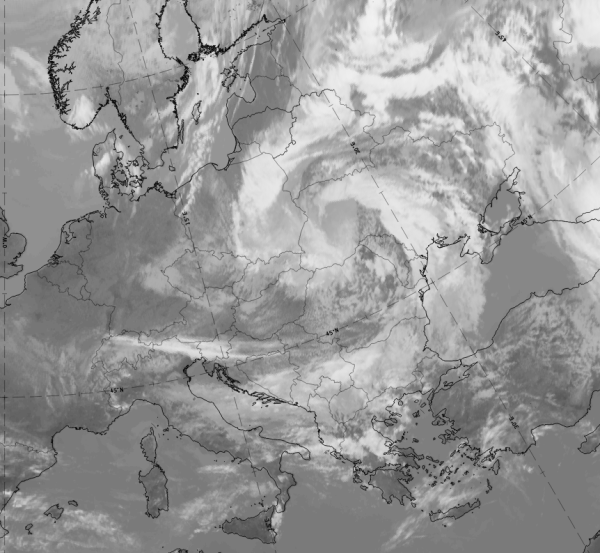
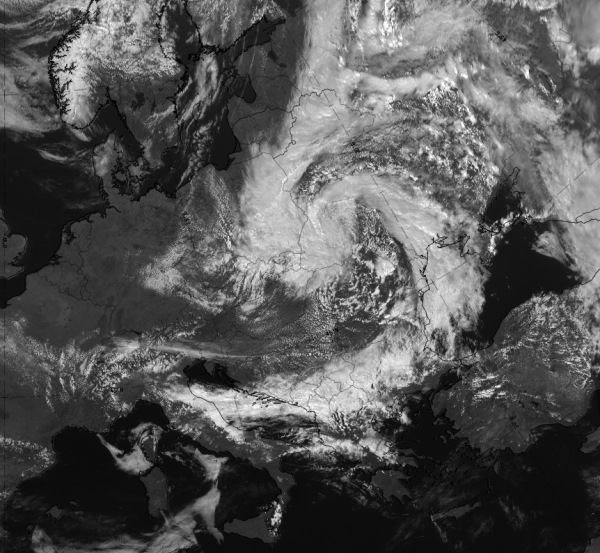
Two cloud bands spiral around the cut off low centre: the southern one developed from the frontal band at the rear side of the trough and the northern one developed within the cyclonic rotation, after cut off from cloudiness in the northeast. Some small cold air cells exist in the cut off low centre.
|
|
|
|
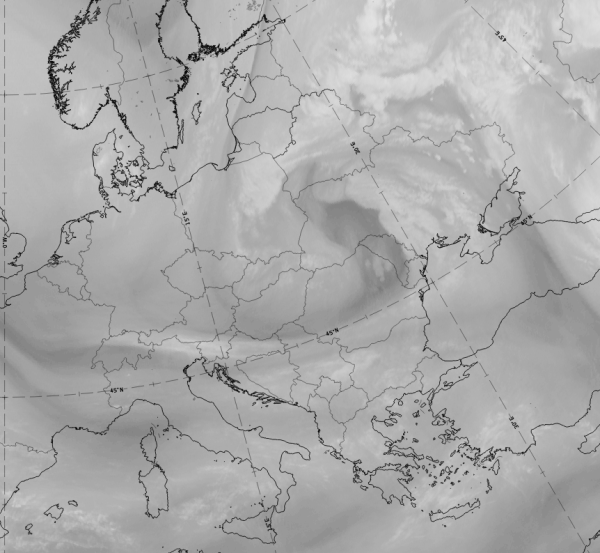
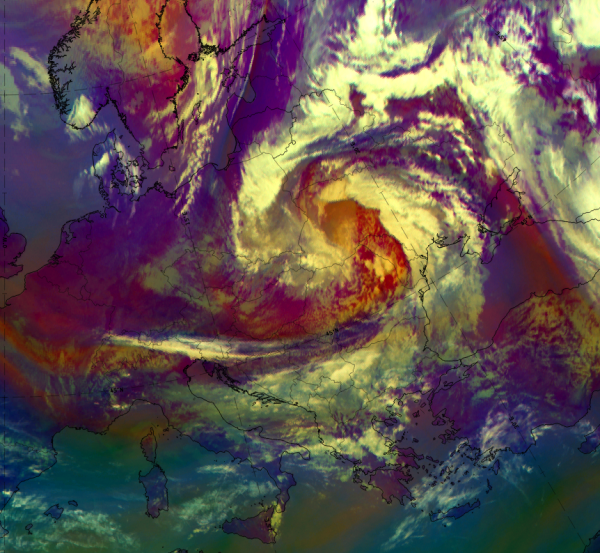
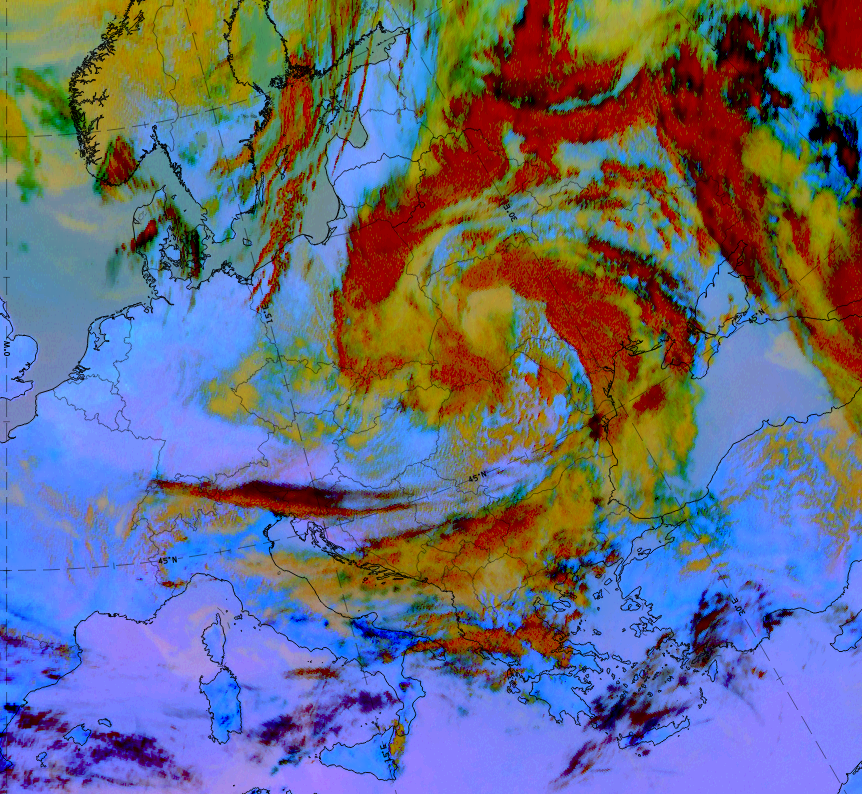
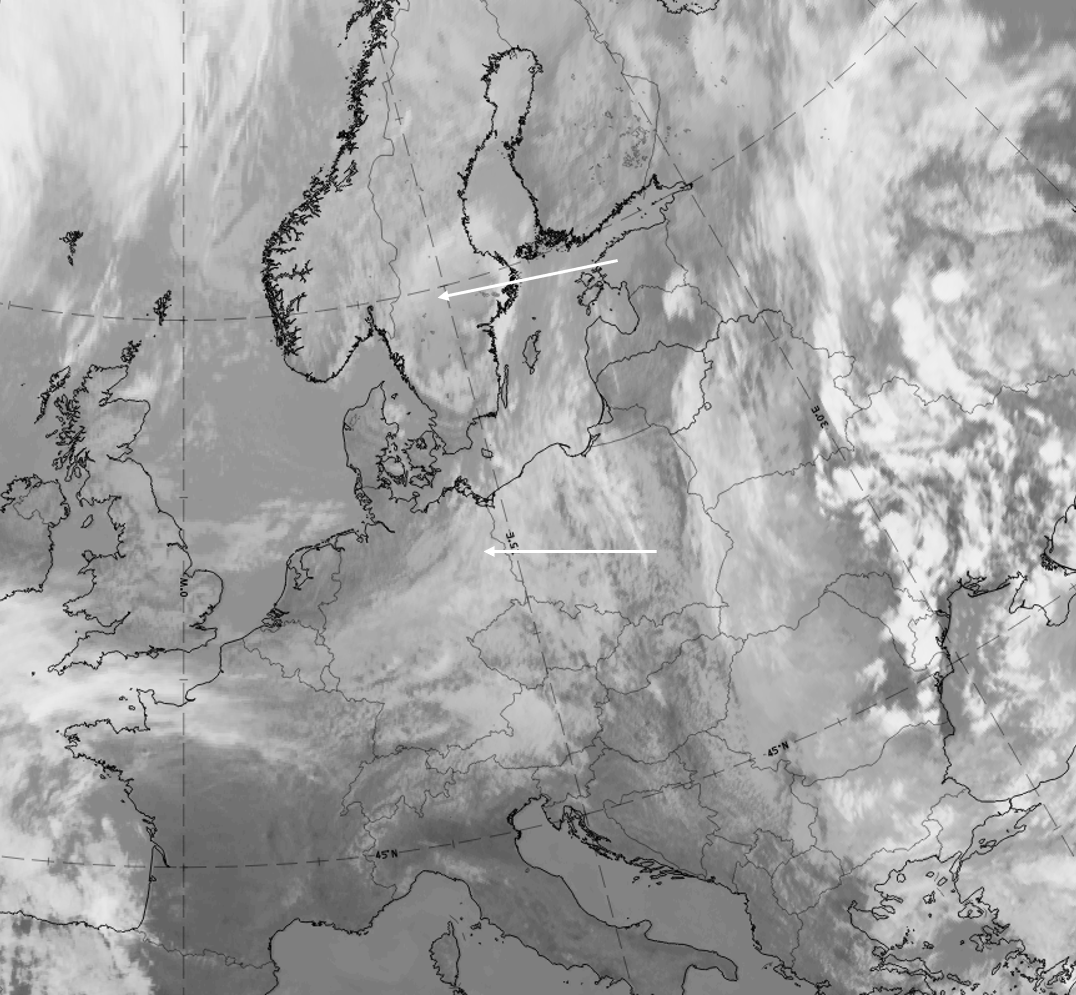
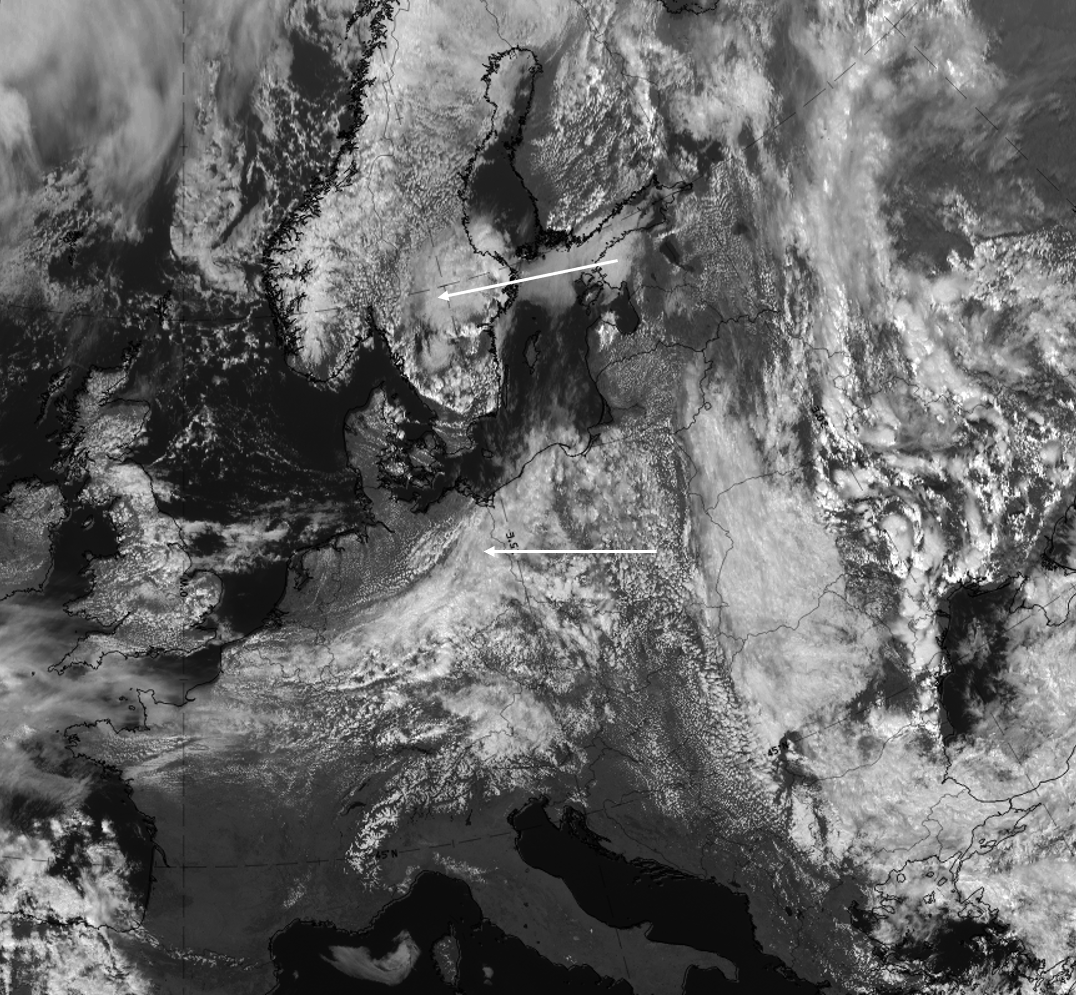
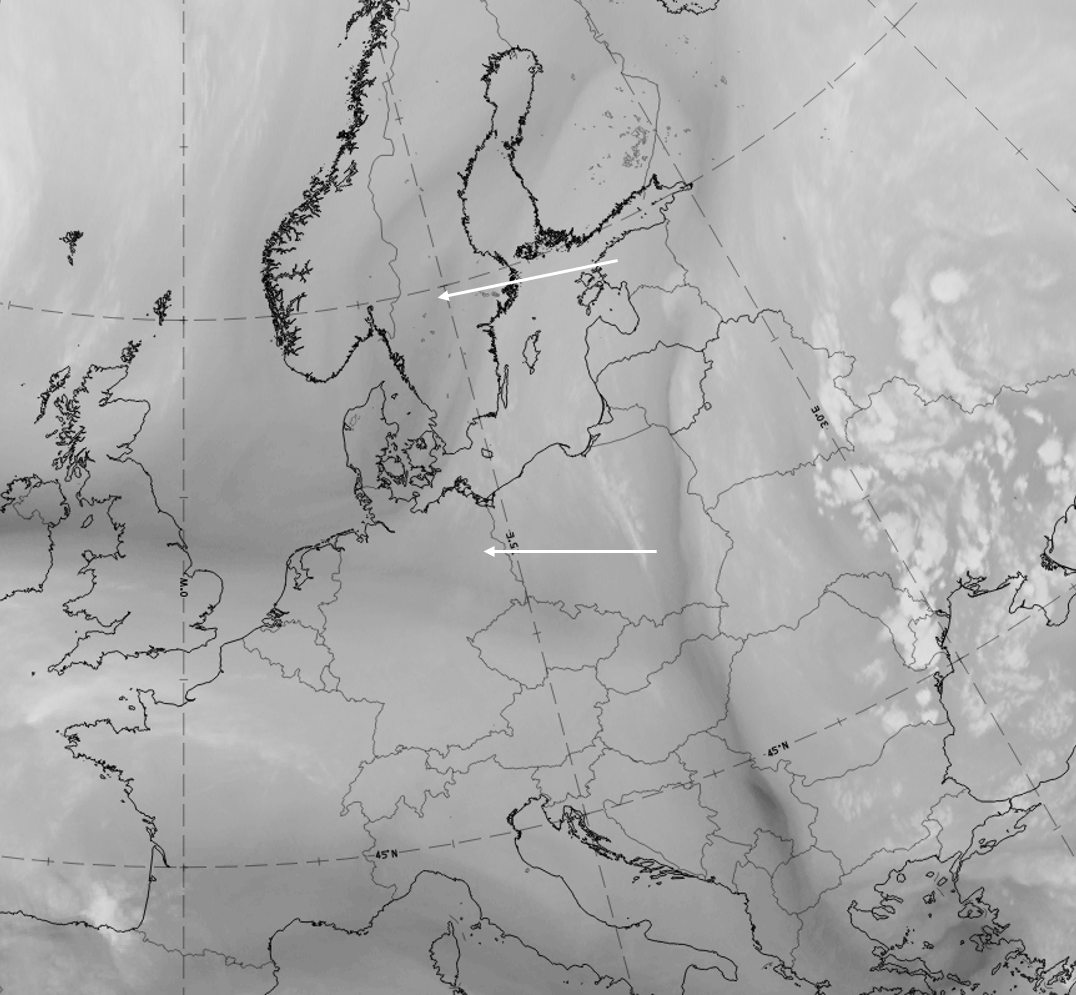
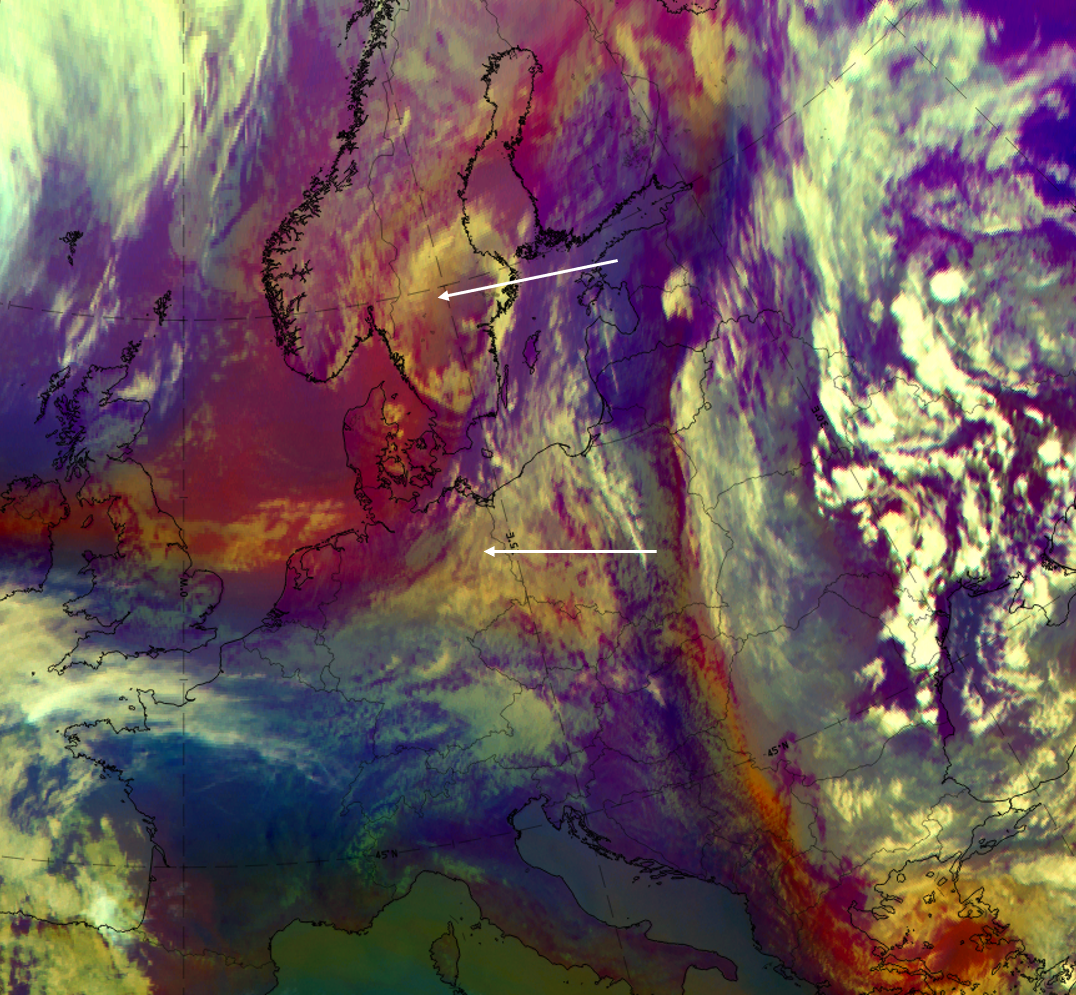
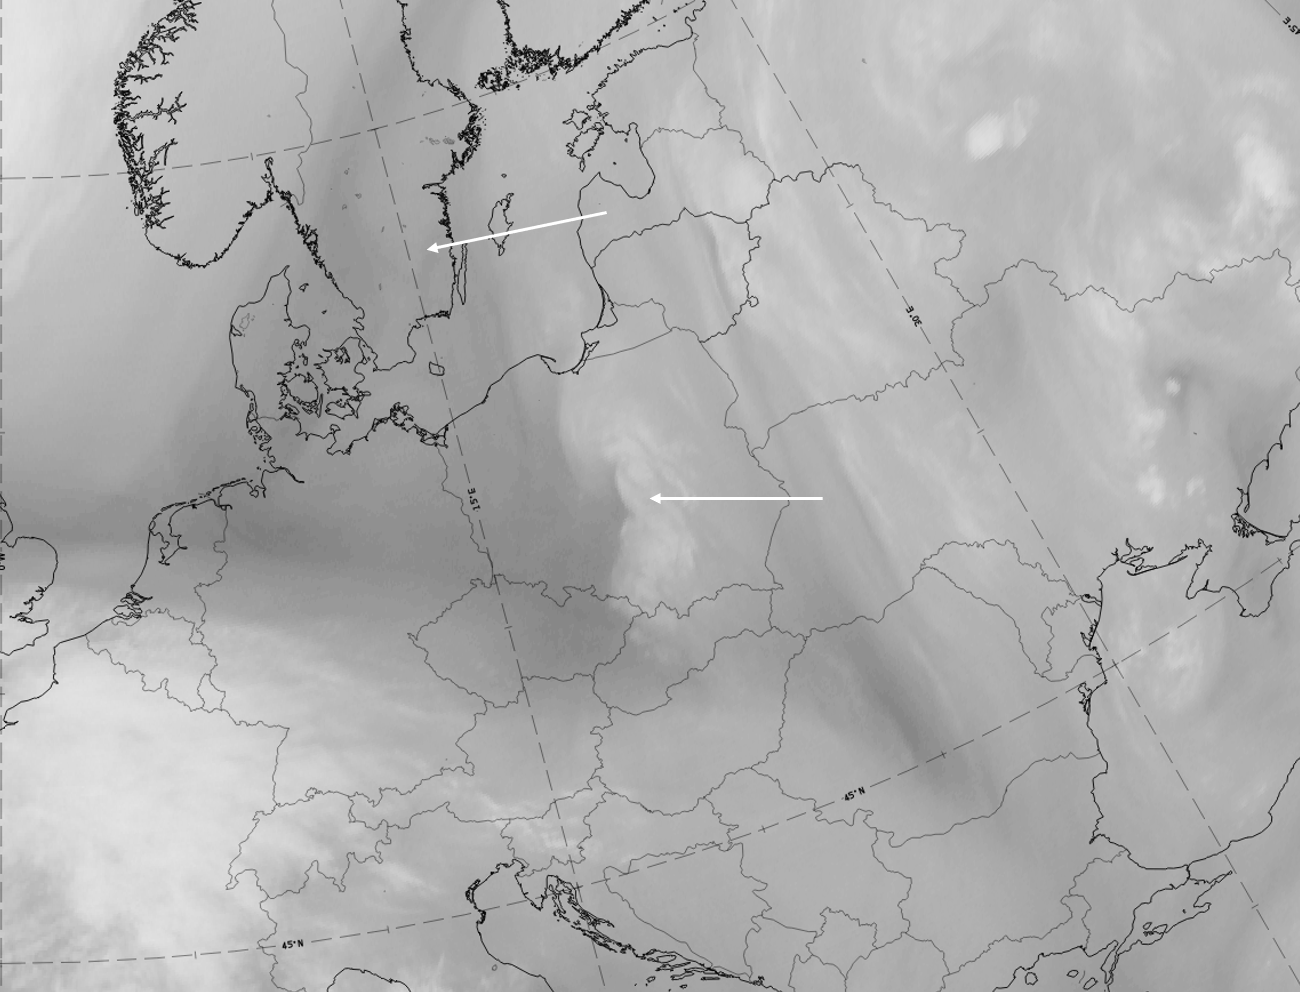
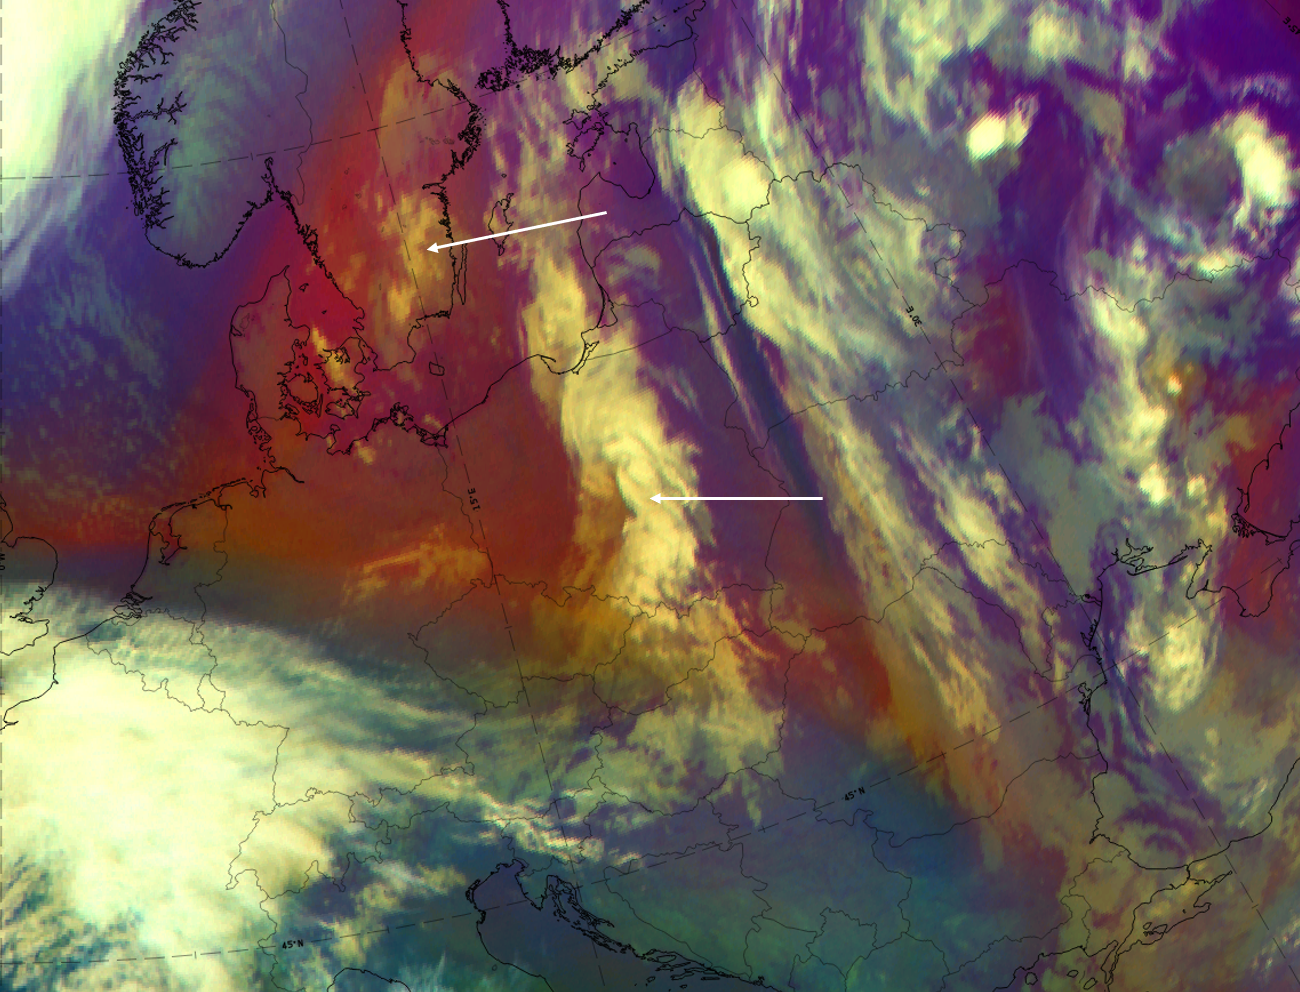
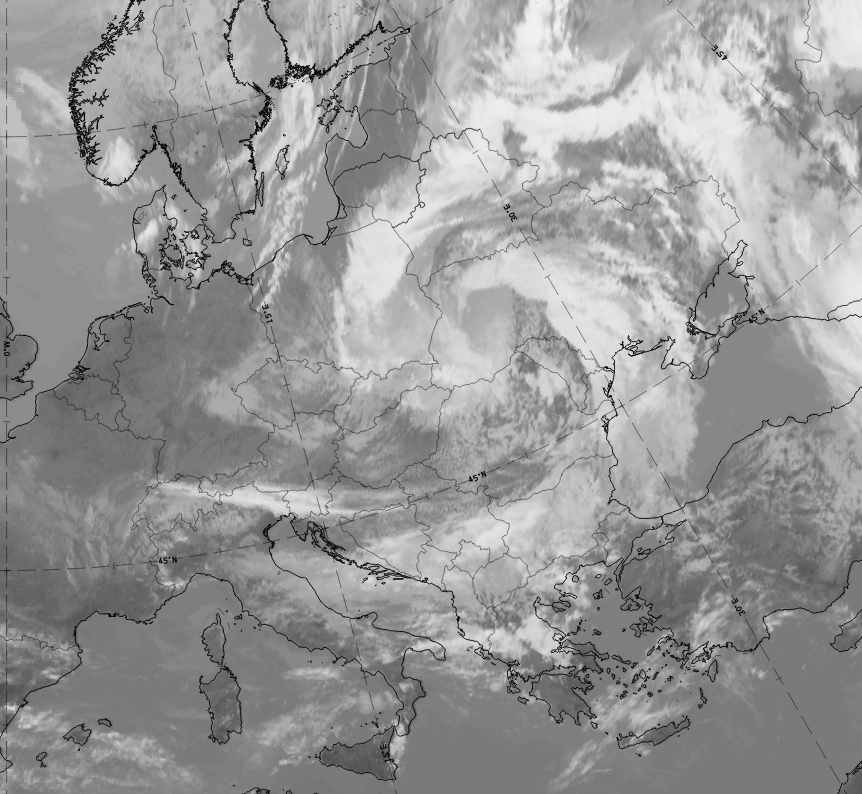
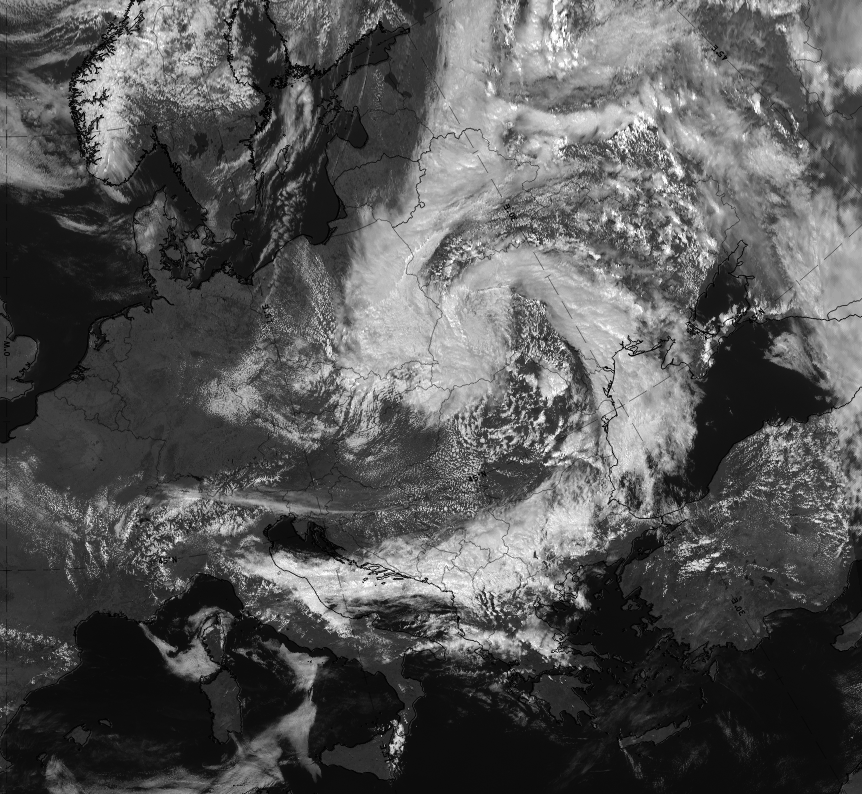
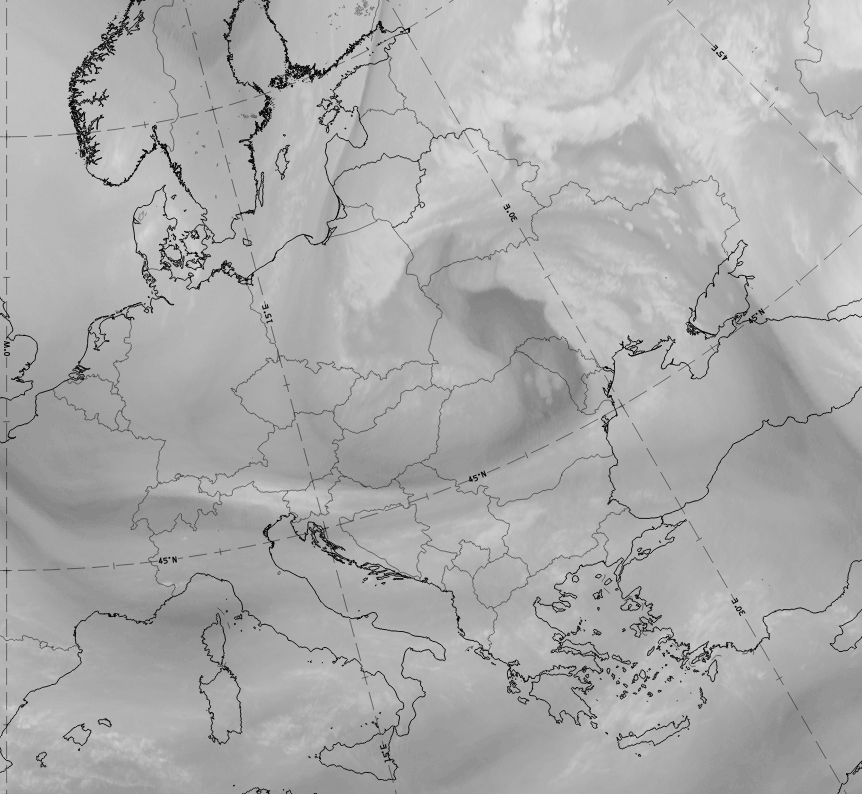
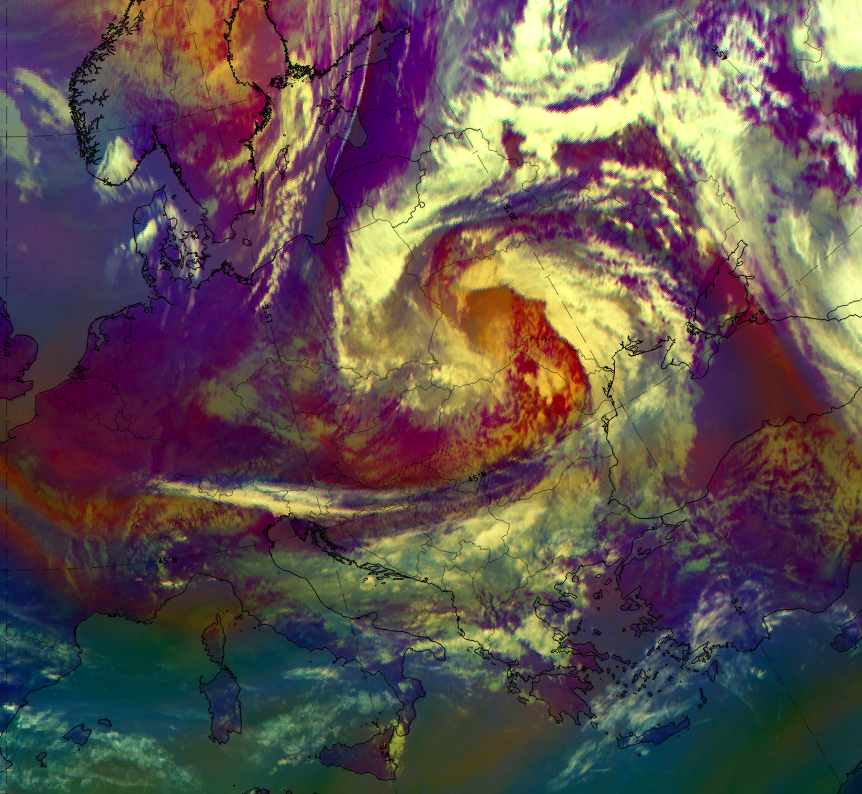
6 May 2020 at 12UTC: 1st row: IR (above) + HRV (below); 2nd row: WV (above) + Airmass RGB (below); 3rd row: Dust RGB + image gallery.
*Note: click on the Dust RGB image to access image gallery (navigate using arrows on keyboard)
| IR | Two cloud bands are cyclonically curved around the cut of low centre, with light grey to white grey shades; white small cells in the centre indicated by some light grey cloud patches. |
| HRV | A white cloud band around - and white cloud cells within - the cut-off low centre; white low to mid-level cloud patches in the centre are very distinct in the HRV channels. |
| WV | Cloud bands are white to light grey; the centre of the cut off low is dark grey. |
| Airmass RGB | Bright cloud bands with similar appearance to those in the IR channel; blue colours accompanying the bands indicate the cold air. The cut-off low centre has dark brown colours indicating the cold and dry air there. |
| Dust RGB | The two curved cloud bands are dark red over a large area, representing the thick ice cloud; the ochre colours indicate the mid-level water clouds which are partly in the cloud bands and partly in the cut off low centre. |
The air below an Upper Level Low is potentially unstable, which leads to the so-called core convection and convective cloudiness. Over warm sea this convective development can be intensive. Contrary to this, the centre of an Upper Level Low over land is often overcast with low or middle level cloudiness with some convective cells embedded.
Other conceptual models that may look like an Upper Level Low in satellite images are Comma (see Comma) and Polar Low (see Polar Low). These can be separated from each other with the help of numerical fields, especially on the 500 hPa level.
Special investigation of DANA cases
DANA (Gota Fría) events over the Iberian Peninsula do not differ remarkably in their development process or their cloud appearance from the general descriptions and the examples of ULLs presented in the general chapter "Cloud Structures in Satellite Images". But they appear in a typical location with cloud systems typical of parts of this location and very often with very severe weather in specific areas. The name DANA refers to the cut off stage of the conceptual Model ULL which appears over the Iberian Peninsula and which is very often stationary for several days.
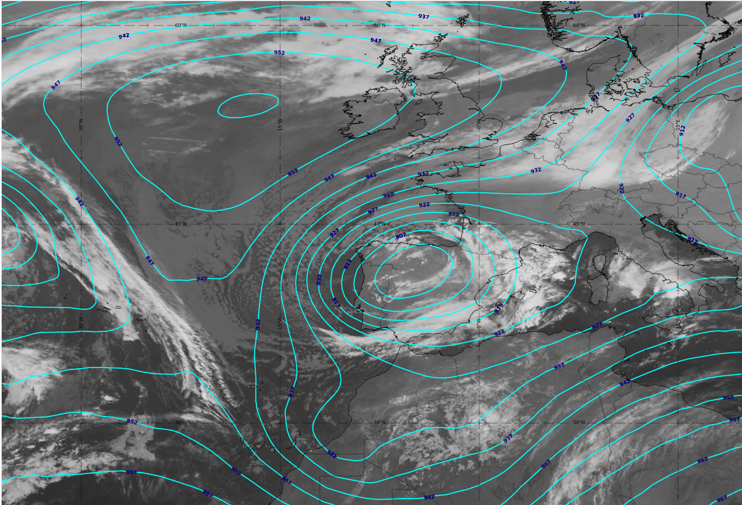
Below, some examples of DANA situations from investigations over the three years 2023–2025 are presented. Only those cases of ULLs in which the cut off stage over the Iberian Peninsula was stationary longer than 24 hours were counted as DANA cases; this happened for nine cases with durations between 24 and 68 hours of stationarity. In fact, there were at least five more instances of a ULL over the Iberian Peninsula but these crossed quickly within one day and/or affected only the south of Andalusia (for example the period 27–28 December 2025 in which heavy damage to property on the southern coast was reported).
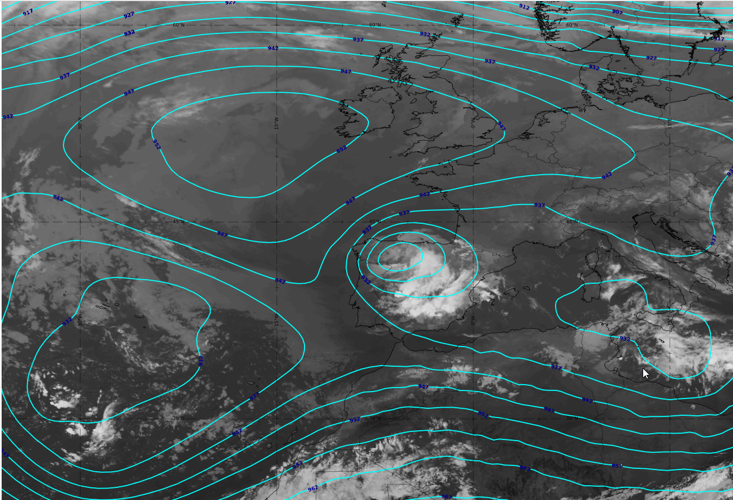
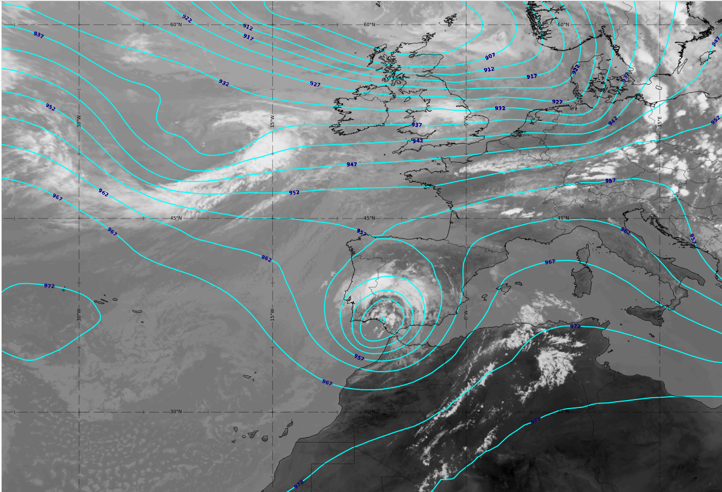
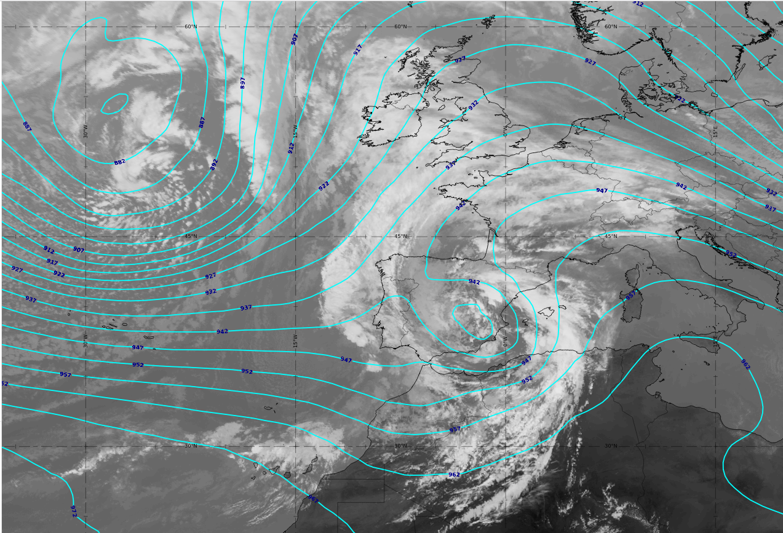
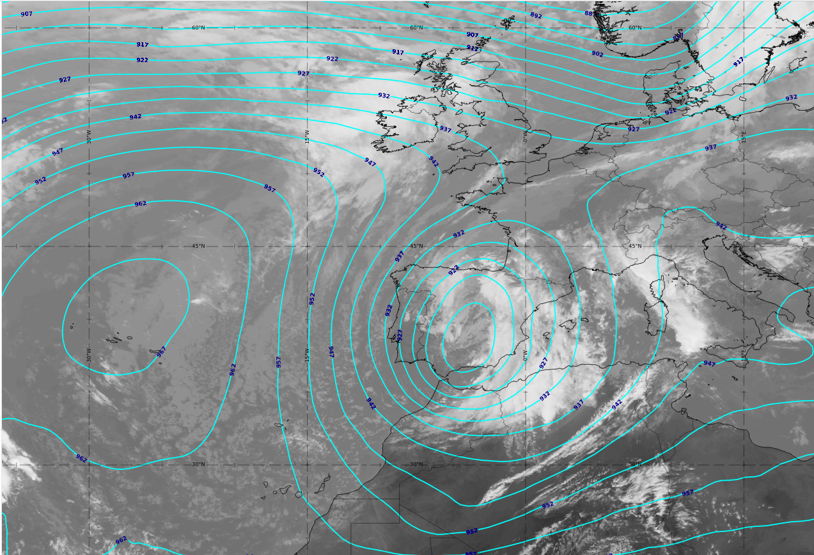
The following figure shows six of the nine DANA cases.
 |
 |
 |
 |
 |
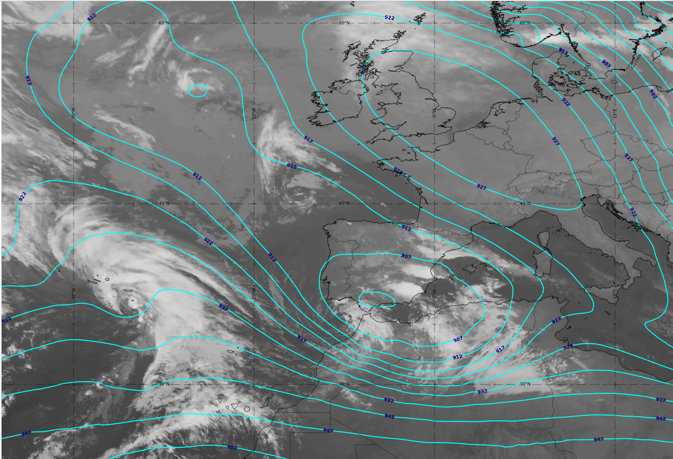 |
Fig 1: DANA examples.
IR channel + height contours at 300 hPa:
Top row left: 26 May 2023, 00 UTC; top row right: 28 June 2024, 12 UTC; 2nd row left: 15 October 2024, 06 UTC; 2nd row right: 27 October 2024, 12 UTC; 3rd row left: 13 November 2024, 06 UTC; 3rd row right: 28 December 2025, 18 UTC.
What all these examples of DANA situations have in common is a cloud band or bandlike cloud systems on the leading side, located primarily over Spain, in some cases extending over the Mediterranean.
However, the whole development and decay process before and after the cut off stage—the DANA stage over Spain—takes place over much larger regions and during a much longer time period. The nine DANA cases from 2023 to November 2024 showed four typical origin regions and paths:
- A trough over the N, NW Atlantic with a cut off process over the Atlantic to the west of Portugal;
- A trough over the SW, W Atlantic with a cut off process west of Morocco and a north/north-eastward movement into the Iberian Peninsula;
- A (often) secondary trough over the British Isles with a cut off process over the Bay of Biscay and a southward movement into the Iberian Peninsula;
- A trough over southern Scandinavia with a cut off process over Denmark and a long south-westward movement into the Iberian Peninsula.
After a DANA event the typical decaying phase paths are:
- Westward over Portugal into the Atlantic and further westward with a long phase of synoptic modifications;
- Southward into Morocco, often with backward movement to the south of Spain;
- Eastward into the Mediterranean or south-eastward into North Africa; this often occurs for DANA situations with a quick crossing over the Iberian Peninsula and a tremendous intensification of the cut off low over the mid Mediterranean or North Africa.
For long-lasting DANA situations in particular, a "final stage" cannot easily be defined over short time period.
The case from 27–29 October 2024 is a typical example of a DANA situation and its development, and it is chosen here to be described in more detail.
This case has a special and dramatic importance for Spain because it led to a terrible weather catastrophe in the area of Valencia with more than 200 deaths.
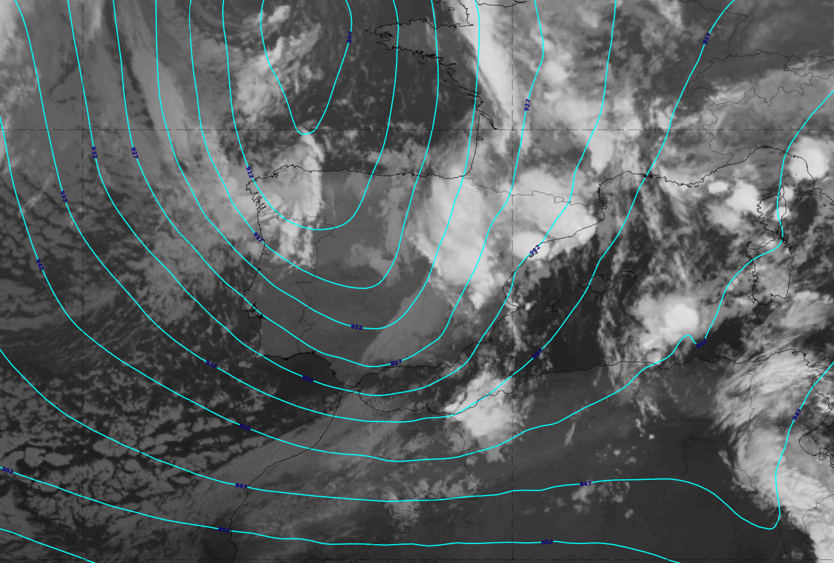
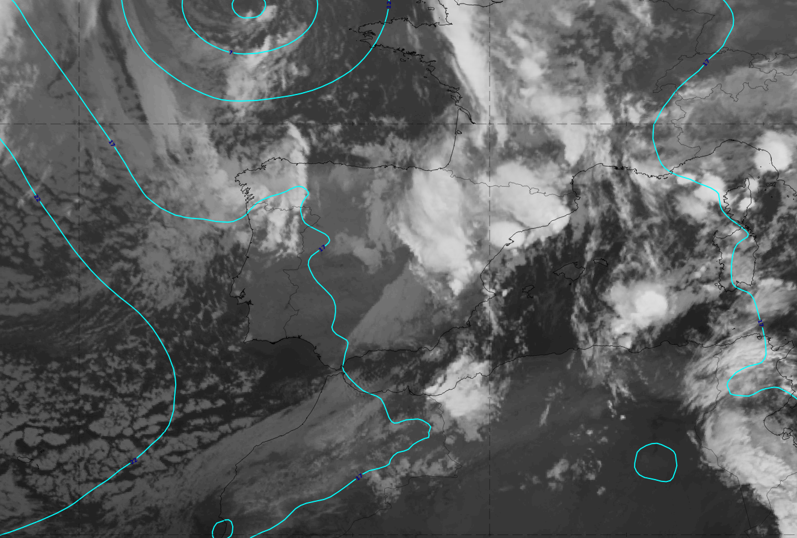
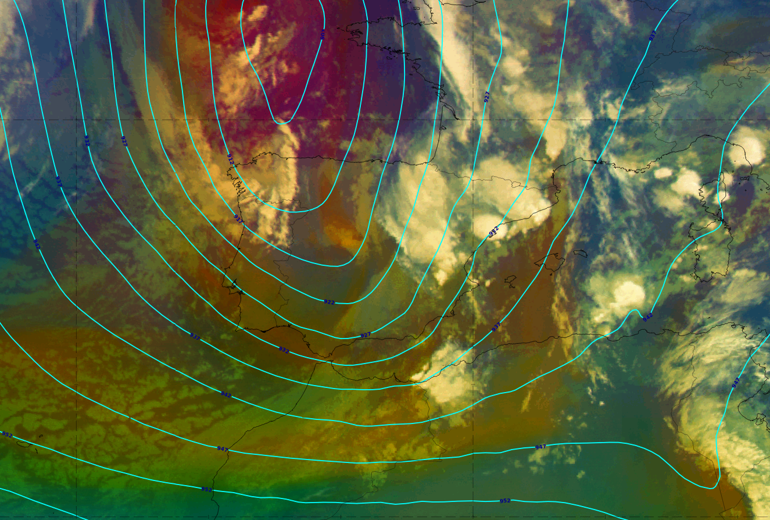
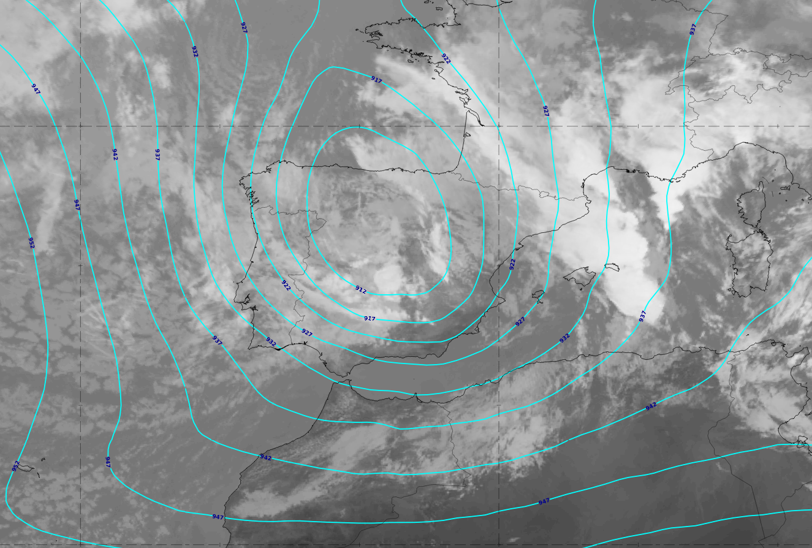
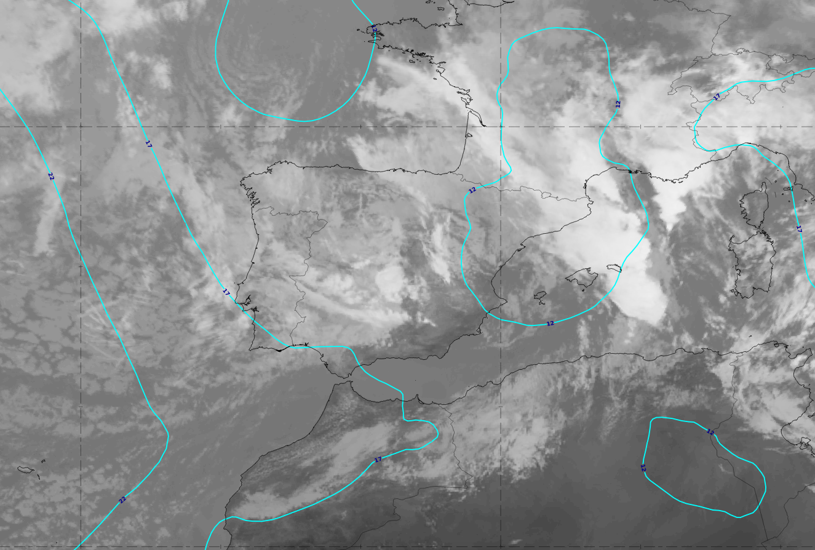
It started with a trough stage west of the British Isles, which changed its form and elongation while moving south-eastward and arrived at the Iberian Peninsula in a trough stage on 26 October 2024 at 00 UTC. Within the next 12 hours it developed from a trough to a tear off and finally to a cut off stage directly over the centre of the Iberian Peninsula; the cut off / DANA stage could be observed on 27 October 2024 around noon.
The corresponding images and height fields can be seen in the figures below. Geopotential heights at 300 and 1000 hPa clearly show, during the whole cut off process, a deep upper-level low without any corresponding distinct low close to the surface.
 |
 |
 |
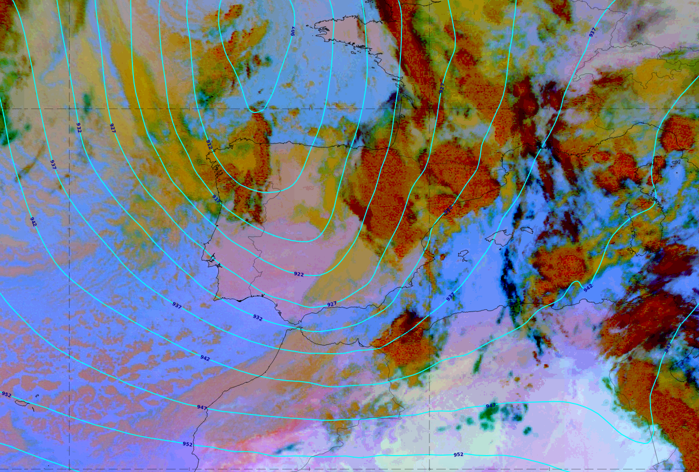 |
Fig 2:
26 October 2024, 00UTC: trough stage; cyan: geopotential height contours.
Top row: IR with left: geopotential height at 300 hPa; right: geopotential height at 1000 hPa.
Lower left: airmass RGB with geopotential height at 300 hPa; lower right: Dust RGB with geopotential height at 300 hPa.
 |
 |
 |
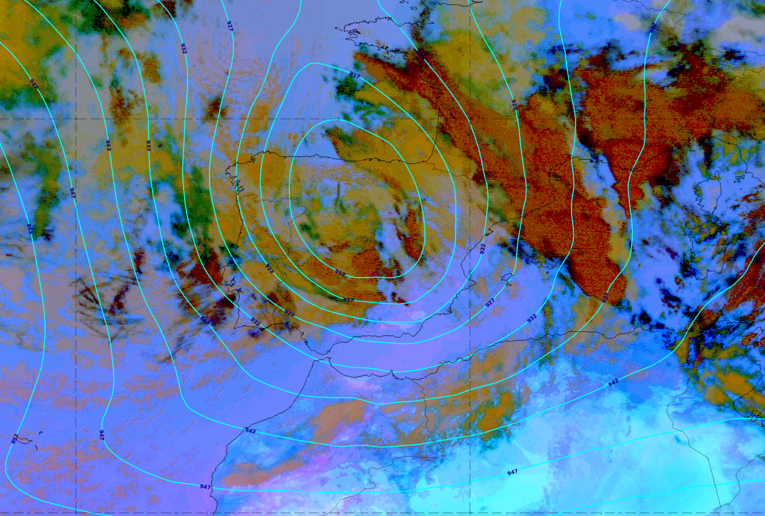 |
Fig 3:
26 October 2024, 12UTC: tear off stage; cyan: geopotential height contours.
Top row: IR with left: geopotential height at 300 hPa; right: geopotential height at 1000 hPa.
Lower left: airmass RGB with geopotential height at 300 hPa; lower right: dust RGB with geopotential height at 300 hPa.
 |
 |
 |
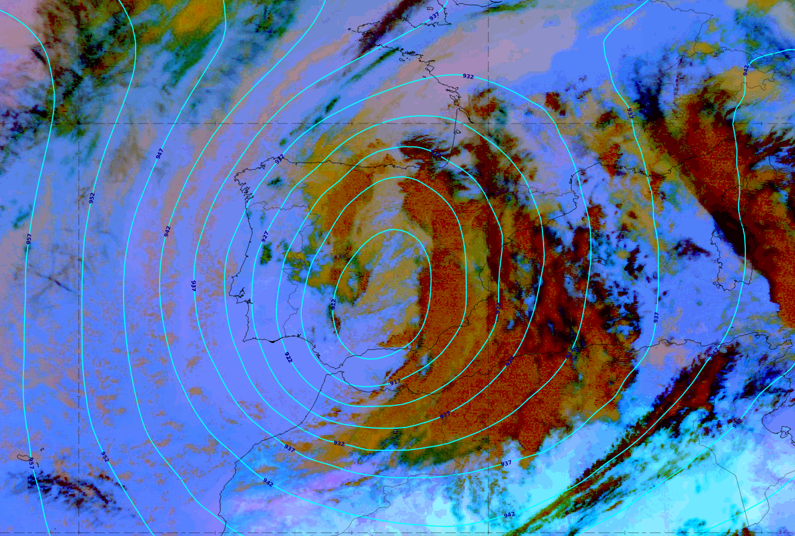 |
Fig 4:
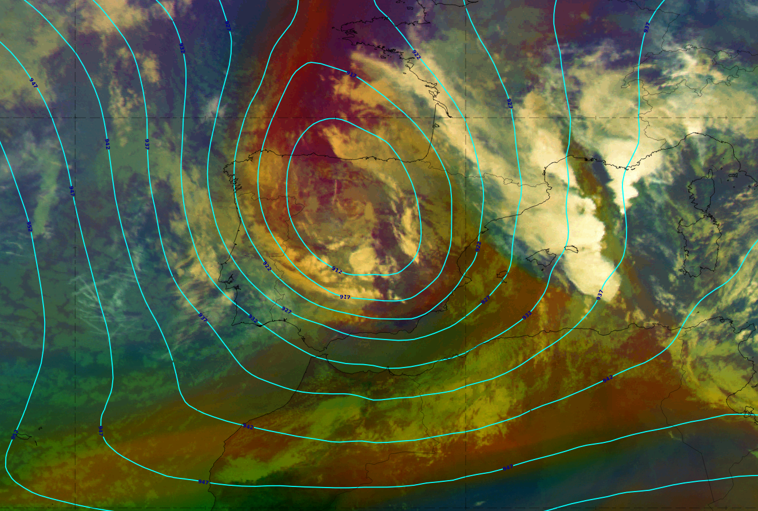
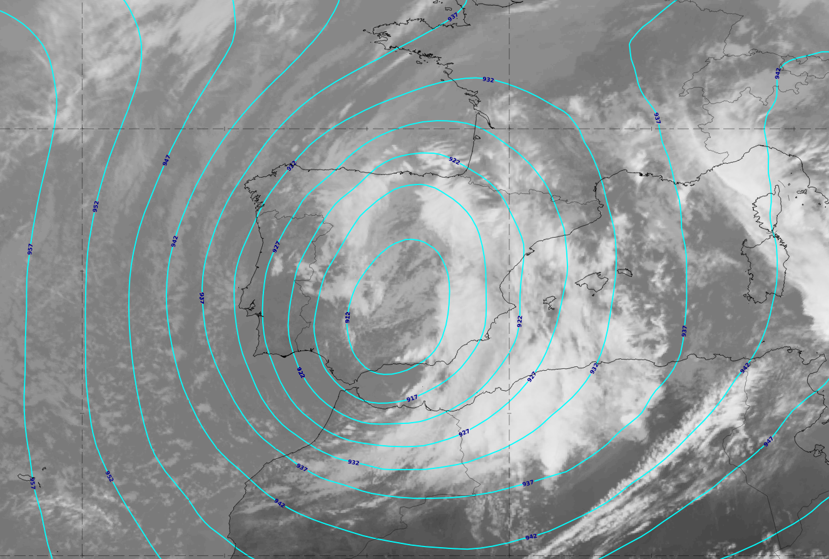
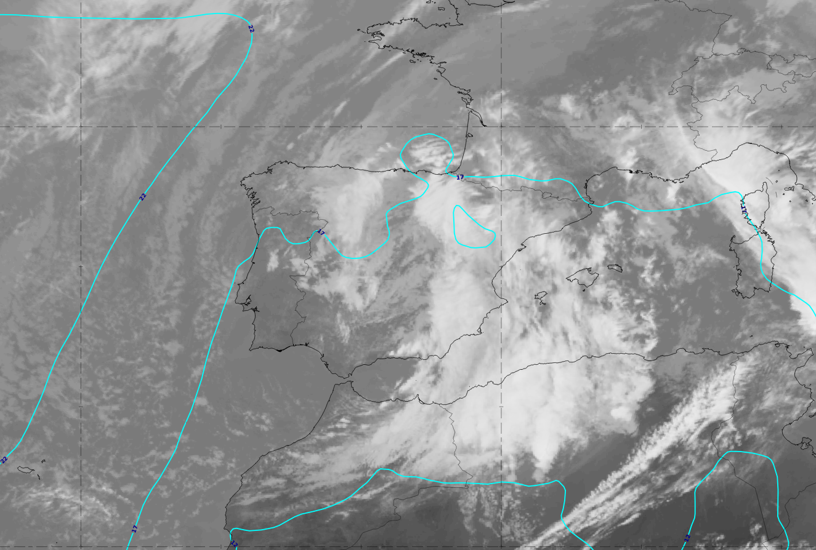
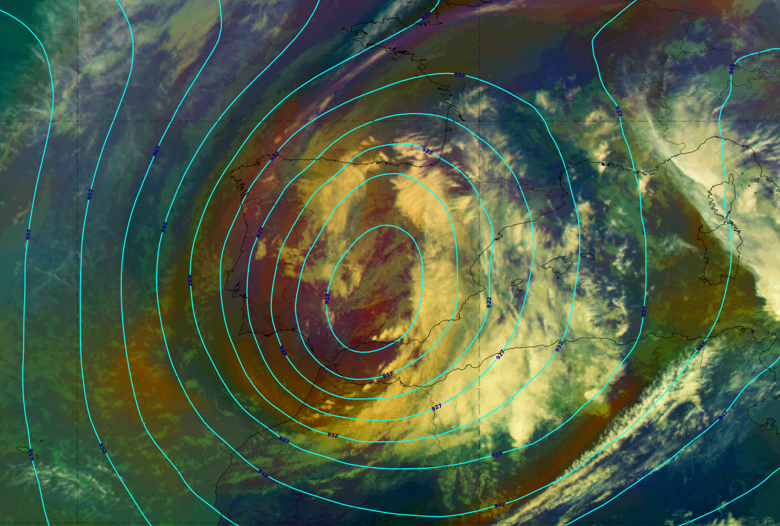
27 October 2024 at 12UTC: cut off stage—DANA; cyan: geopotential height contours.
Top row: IR with left: geopotential height at 300 hPa; right: geopotential height at 1000 hPa.
Lower left: airmass RGB with geopotential height at 300 hPa; lower right: dust RGB with geopotential height at 300 hPa.
During this cut off process over the Iberian Peninsula, cloud systems and finally cloud bands developed at the leading side of the DANA, which was in the northeastern, eastern and southeastern parts of Spain.
During all stages of development, the centre of the ULL/DANA is accompanied by dark brown colours in the airmass RGB, which represent the very dry and cold air protruding into upper-level heights from north and northwest into the Iberian Peninsula and becoming cut off there. The Dust RGB shows, with dark brown colours, that the developing cloud systems either at the leading border or within the centre of the DANA stage consist of thick ice cloud.
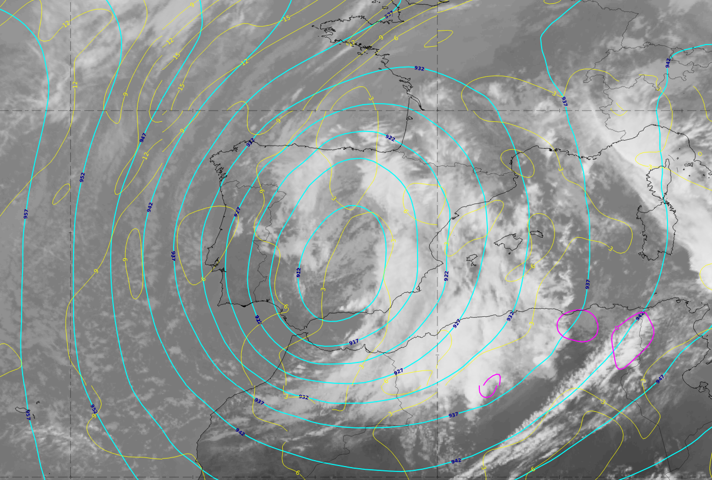
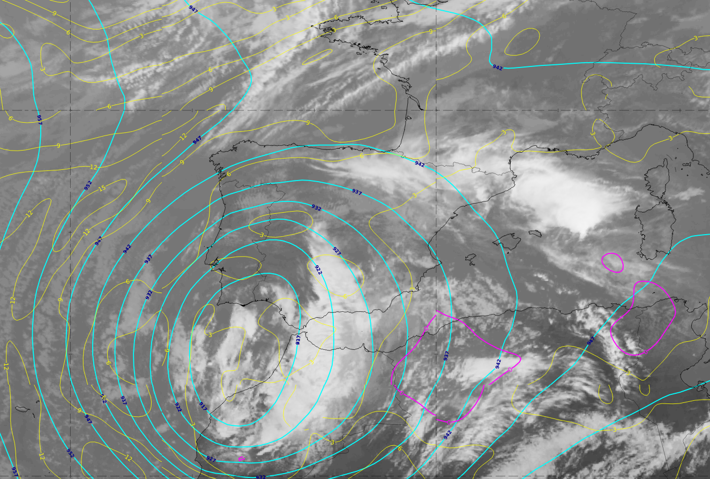
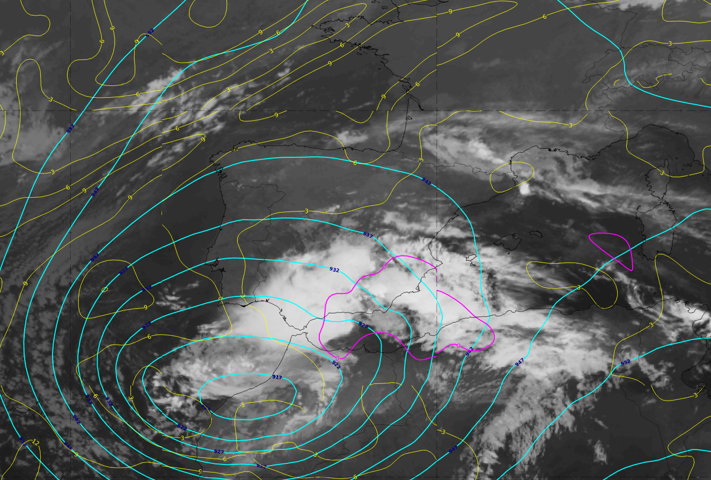
This special DANA situation remained after the cut off for rather a long time without any signs of weakening. It moved southward to North Africa—as is typical in many cases—and then moved back to the south of Spain. Over the whole period until 29 October, the southeastern parts of Spain were under the influence of varying cloud systems, which, in a warm and humid air mass, continuously changed its appearance in the RGB fields; they were also under the influence of increasingly high instability. In the late afternoon of 29 October 2024, the above-mentioned weather catastrophe with incredible flash floods occurred over the area of Valencia with the consequence of more than 200 deaths.
The figures below show these changes in the position of the ULL centre, the changes and new developments of cloud systems and the increase of instability represented by the Showalter index.
 |
 |
 |
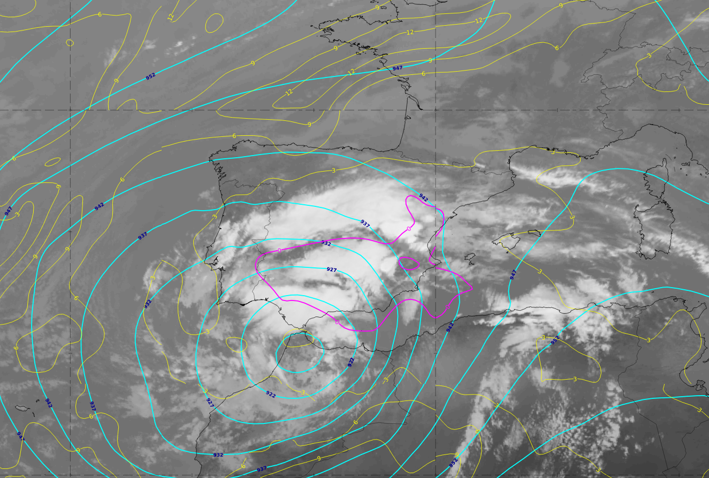 |
Fig 5:
Cut off stage—DANA. IR; height contours at 300 hPa; yellow/purple: Showalter Index.
Top left: 27 October 2024, 12UTC; top right: 28 October 2024, 12 UTC.
Lower left: 29 October 2024, 00 UTC; lower right: 29 October 2024, 12 UTC.
From 30 October at around noon a long decay phase of this DANA case started with a westward movement across Portugal far into the Atlantic where it changed its synoptic character. Therefore, it is not useful to show one date as representative of a typical final stage.
From all cases it can be seen that Portugal and Spain are in different positions in relation to a DANA development process. The central, eastern and northeastern parts of Spain are under the influence of the leading side of the ULL with the air masses from the south or southwest containing high humidity from the warm Mediterranean sea surface, which leads to the development of thick cloud bands and partly intense precipitation. Portugal is situated under the rearward side of the cut off DANA stage, which is the cold side with cold air cloud from the Atlantic or from developments west of the centre of the cut off low. In the schematics in the chapter “Typical appearance in satellite images”, non‑convective fibrous cloud fields on the rear side of the trough stage are also described, as they sometimes persist into later stages of development.
An inspection of all nine cases from 2023 to November 2024 confirms this description. Depending on slight differences in the relative position of the DANA centre to Portugal, these fibrous smaller cloud parts at the rear side can also be detected in some cases, as in the figures of the presented case.
Although the very heaviest, even catastrophic, rain is bound to the southern and eastern parts of Spain in the warm and humid air it should be noted that the convective cloud over Portugal together with local phenomena can sometimes also lead to damaging intense rain.